Ind. Eng. Chem. Res. 1994,33,
zyxwvutsrqponmlkjihgfedcbaZYXWVUTSRQPONMLKJIHGFEDCBA
1341-1347 1341Solubility of Amino Acids: A Group-Contribution Model Involving
Phase and Chemical Equilibria
Simao P. Pinho, Carlos M. Silva, and Eughnia
zyxwvutsrqponmlkjihgfedcbaZYXWVUTSRQPONMLKJIHGFEDCBA
A. Macedo'Laboratory
zyxwvutsrqponmlkjihgfedcbaZYXWVUTSRQPONMLKJIHGFEDCBA
of Separation and Reaction Engineering, Faculdade de Engenharia, Rua dos Bragas,4099 Porto Codex, Portugal
A new model is proposed to represent the solubility behavior of 14 amino acids and 5 small peptides in water. T h e UNIFAC model is combined with a Debye-Huckel term t o describe the activity coefficients of the species present in the biomolecule/water system. New groups have been defined according to the group-contribution concept, and chemical equilibrium is taken into account simultaneously with the physical equilibrium. T o estimate the new interaction parameters, molal activity coefficient data from the literature were used. These parameters, in addition t o solubility data, were the basis for the correlation of the solubility product of the amino acids. Using this approach, satisfactory results were obtained in the representation and prediction of the solubilities of amino acids in aqueous solutions at different conditions of temperature and pH.
Introduction
Many valuable biochemicals are produced in reactors where the product concentration in a very complex mixture is very small. Therefore, the development of efficient methods for separation, concentration, and purification of biological products is of fundamental importance.
To design, optimize, and scale-up separation processes, the application of molecular thermodynamics is a useful tool. In the case of biotechnology, it is particularly important to focus the attention on the properties of aqueous systems containing salts and large, charged molecules (Prausnitz, 1989). Although amino acids are among the simplest biochemicals, they have many simi- larities with more complex biomolecules such as antibiotics (Orella and Kirwan, 1991) and the study of their solubility in water is a good starting point for the understanding of
biochemical systems.
The successful representation of the solubilities is directly related to the ability of correlating and predicting the activity coefficients of the amino acids in solution. In this way, several attempts have been made in the last few years: Nass (1988) has assumed the activity coefficients of amino acids to be a product of two terms due to chemical reaction equilibria and physical interactions using for this the Wilson equation (Wilson, 1964), with Bondi's volume ratios (Bondi, 1968) as pure-component liquid volume ratios. Although the correlation results are satisfactory, they are limited to a few amino acids. The number of estimated parameters varies from 3 to 10. Chen et al.
(1989) added two different contributions for the calculation of the excess Gibbs energy of the system: one is the result of the long-range interactions and was represented by a Pitzer-DebyeHuckel term (Pitzer, 1980); the other is due to local interactions and was formulated by a modified form of the NRTL equation (Renon and Prausnitz, 1968) with two adjustable energy parameters for each amino acidJwater pair. As the data were correlated, each amino acid separately, the results were very satisfactory, both for correlation of activity coefficients (mean deviation of
2 % ) and of solubilities (mean deviation
zyxwvutsrqponmlkjihgfedcbaZYXWVUTSRQPONMLKJIHGFEDCBA
<
1.8%). More recently, Gupta and Heidemann (1990) tried todescribe the activity coefficients of amino acids in water considering only short-range interactions, using the mod- ifiedUNIFAC model (Larsen et al., 1987). Their definition
*
Author to whom all correspondence should be addressed. oaaa-5aa519412~33-i34i~04.50/0of groups is different from the usual, as they considered very large groups. The proline molecule for instance, was considered one group. In average, the results may be considered poor both for correlation and prediction.
In this work a new model for prediction of activity Coefficients of amino acidiwater and peptidelwater mix- tures has been developed. The model combines chemical and physical equilibrium simultaneously. The original UNIFAC group-contribution method (Fredenslund et al., 1975) is used for the description of physical equilibrium. New groups have been defined and new parameters were estimated. The influence of pH and of temperature on the solubility for several amino acids has been examined with satisfactory quantitative and qualitative results.
Model Development
aqueous phase, some reactions take place:
When an amino acid or a peptide (AA) is present in an
k,
AA(s) + AA
KD
AA=AA*
4
AAf *AA-
+
H+
(3) KzAA*
+
H+ + AA+H,O + H+
+
OH-(4)
( 5 )
Greenstein and Winitz (1961) reported values of
KD
for amino acids and small peptides in the range 105-106. Thus, reactions 1 and 2 can be combined as follows:K"
K.
AA(S) AA* (6) Reaction 6 indicates the dissolution of a biomolecule, forming a neutral dipolar species called a zwitterion, carrying dual electric charges. The participation of the zwitterion in acid-base reactions to form amino acid anionic or cationic species is shown by eqs 3 and 4. It is worthwhile to mention that some amino acids have more than one cationic species, such as arginine and lysine, or more than one anionic species, like tyrosine and aspartic
1342
zyxwvutsrqponmlkjihgfedcbaZYXWVUTSRQPONMLKJIHGFEDCBA
Ind. Eng. Chem. Res., Vol. 33, No.zyxwvutsrqponmlkjihgfedcbaZYXWVUTSRQPONMLKJIHGFEDCBA
5, 1994100
o h
enzyxwvutsrqponmlkjihgfedcbaZYXWVUTSRQPONMLKJIHGFEDCBA
I
40
zyxwvutsrqponmlkjihgfedcbaZYXWVUTSRQPONMLKJIHGFEDCBA
1
M
.-
0
1 2 3
zyxwvutsrqponmlkjihgfedcbaZYXWVUTSRQPONMLKJIHGFEDCBA
4 5zyxwvutsrqponmlkjihgfedcbaZYXWVUTSRQPONMLKJIHGFEDCBA
6 7 8 9 10PH
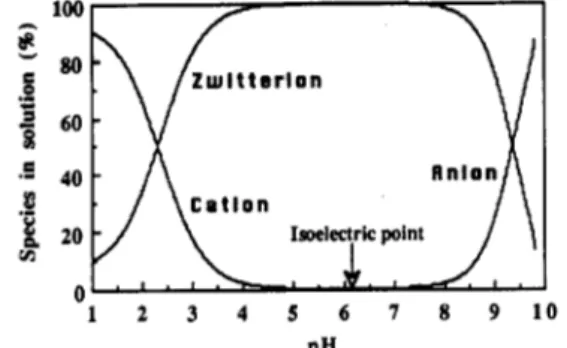
Figure 1. Percentage of the different glycine ionicepecies in aqueous
solution a t 298.15 K
zyxwvutsrqponmlkjihgfedcbaZYXWVUTSRQPONMLKJIHGFEDCBA
88 a function of pH.acid (Bohinski, 1987). However, in this study only molecules with two acid-base reactions were considered. The equilibrium constants for these reactions are given as follows:
K,
= aAAI (7)K, = aAA-aH+/aAAt (8)
K 2
= aAA+/aAA+aH+ (9) K, = ~ H + ~ o H - (10)ai = miy; (11)
where
yf is the molal unsymmetric activity coefficient, and mi
is the molality of species i. The equilibrium constant
K,
is in this work considered to be an adjustable parameter. The small influence of the difference in standard states between reaction 1 (system pressure) and reaction 2 (standard pressure) is therefore incorporated into K,. In eq 7 it is also assumed that we are in the presence of a pure solid.
As can be seen in Figure 1, in isoelectric solutions, a t which the isoelectric point is defined by PI = pH = (pK1
+
pK2)/2, neutral dipolar species are predominant, but for pH much higher than PI, the anionic aminoacid species become predominant, while cationic species are dominant a t values of pH much smaller than PI.From the above equations it is evident that for the successful representation of solubilities and their depen- dence with pH and temperature it is necessary to be able to represent accurately the activity coefficients of the different species in the solution. However, this is not an easy task. Besides the powerful electric fields surrounding the charged groups that give rise to important long-range interactions and in a certain way make amino acids and peptides behave as strong electrolytes (Cohn et al., 1934), the influence of the hydrocarbon chain must also be taken into account.
To represent these interactions, a semiempirical model is proposed. The model is based on the assumption that the excess Gibbs energy of the system is a linear combi- nation of two terms:
(12)
From eq 12 the molal scale unsymmetric activity coefficient for ionic species can be derived as
(13)
The combinatorial (yfvc) and residual (yt,R) terms for
*,DH
In 7; = In y;gc
+
In y;vR+
InzyxwvutsrqponmlkjihgfedcbaZYXWVUTSRQPONMLKJIHGFEDCBA
yishort-range interactions are calculated using the original UNIFAC method, with the correction in the combinatorial term for very dilute solutions (Kikic et al., 1980). Groups already available on UNIFAC VLE parameter tables (Gmehling et al., 1982; Macedo e t al., 1983; Tiegs et al., 1987; Hansen et al., 1991) have been used, and when necessary, new groups have been defined according to the group-contribution concept.
As
we used the unsymmetric convention and molality scale for the activity coefficients, some conversions had to be made. Thus, the calculation of activity coefficients a t infinite dilution by means of UNIFAC was necessary to convert calculated values from mean rational symmetric (7:) to mean rational unsym- metric activity coefficients (y;*):yf" = y;/7- (14)
Conversion between mole fraction scale (yfJ) and molal scale activity coefficients (yf) was made using an ex- pression derived by Robinson and Stokes (1965):
yfJ = y ; ( l + O.OOIMACmi)
where M A is the molecular weight of the solvent and the summation is to be made over all the solute species.
The Debye-Hackel approach presented in eq 13 as
yfiDH (Robinson and Stokes, 1965) was used to represent the long-range interaction forces. This term, expressed in eq 16, computes solution ionic strength (I) from the net charge of the species, and therefore, for a zwitterion this term is zero. In this case, no conversions were necessary.
where
I = 0 . 5 x m i z ?
A = 5.7664 X lo4 ~ S O . ~ / ( E T ) ~ . ~ (18)
(19)
a is the Debye-Huckel distance of closest approach of ions, t is the dielectric constant of the solvent, ds is the
density of the solvent,
T
is the absolute temperature in Kelvin, and z is the charge number of the ion.B = 1.590 X 10" ds0.5/(d71'2
Correlation and Prediction of Activity Coefficients
Experimental and Physical Data. Hutchens (1976) compiled the molality scale unsymmetric activity coef- ficient data of amino acids and small peptides in pure water a t 25 "C. The original measurements on osmotic coefficients and the subsequent conversion to activity Coefficients were made by Smithand Smith (1937,1940a,b), Hutchens et al. (19631, and Ellertonet al. (1964). Relevant information from the experimental data collected is shown in Table 1.
Dissociation reaction equilibrium constants K1 and
KZ
and their variation with the temperature have been measured by several authors. The data used in this work were found in the CRC Handbook of Chemistry and Physics (Izatt and Christensen, 1973) and King (1951). New UNIFAC Groups. As discussed earlier (Figure
1) the zwitterionic species are predominant in pure water. Thus, we have defined new charged groups to describe accurately the components in the solution. A new group
Ind. Eng. Chem. Res., Vol.
zyxwvutsrqponmlkjihgfedcbaZYXWVUTSRQPONMLKJIHGFEDCBA
33, No. 5, 1994 1343 Table 1. Overall Representation of Experimental Dataexperimental maximum
substance data points molality y* range
alaniie 7 1.86 1.005-1.045
a-aminobutyric acid 7 2.00 1.011-1.165
a-aminovaleric acid 5 0.65 1.022-1.072
glycine 10 3.11 0.960-0.738
hydroxyproline 7 2.00 1.000-1.026
proline 15 7.30 1.019-2.004
serine 11 4.00 0.951-0.603
threonine 7 2.00 0.9894.944
valine 3 0.50 1.030-1.076
alanylglycine 5 1.00 0.931-0.855
glycylalanine 5 1.00 0.935-0.855
glycylglycine 6 1.50 0.911-0.689
triglycine 2 0.30 0.851-0.804
Table 2. New UNIFAC Group Size
zyxwvutsrqponmlkjihgfedcbaZYXWVUTSRQPONMLKJIHGFEDCBA
Parametersalanylalanine 5 1.00 0.982-1.035
coo-
COO- 1.3013 1.224CNHa+ CHzNHa+ 1.3692 1.236
CHNH3+ 1.1417 0.924
CNHz+ CHzNHz+ 1.2070 0.936
co
co
0.7713 0.640Table 3. Groups of the Amino Acids and Peptides on the Zwitterionic Form
substance groups
alanine CH3, COO-, CHNH3+
a-aminovaleric acid CH3,2CH2, COO-, CHNHs+
glycine COO-, CHzNHs+
hydroxyproline
proline 2CH2, CH, COO-, CHzNHz+
serine CHz, OH, COO-, CHNHs+
threonine
alanylalanine alanylglycine glycylalanine
glycylglycine CHzNH, COO-, CHzNHa+, CO
triglycine
a-aminobutyric acid CH3, CHz, COO-, CHNH3+
CHz, 2CH, OH, COO-, CH2NHz+
CH3, CH, OH, COO-, CHNH3+
2CH3, CHNH, COO-, CHNHs+, CO CH3, CHzNH, COO-, CHNH3+, CO CH3, CHNH, COO-, CH2NHs+, CO
2CHzNH, COO-, CHzNH3+, 2 CO
valine 2CH3, CHZ, COO-, CHNH3+
the formulation of new groups, we used a similar strategy, as previously adopted for groups already available on UNIFAC tables, and tried to use those groups whenever possible. Table 2 summarizes the new groups and sub- groups defined as well as the UNIFAC size parameters, which were determined using Bondi area and volume parameters (Bondi, 1968).
In the calculation of activity coefficients, solution chemistry was explicitly taken into account, since further studies on the influence of pH on solubility requires the knowledge of y* for the anionic and cationic species. Unfortunately, the available data do not include these conditions, and to represent local interactions, an as- sumption had to be made: that UNIFAC groups which constitute the anionic and cationic species are the same as those of the zwitterion. The relevant groups of all amino acids and peptides (their zwitterionic form) studied are shown in Table 3.
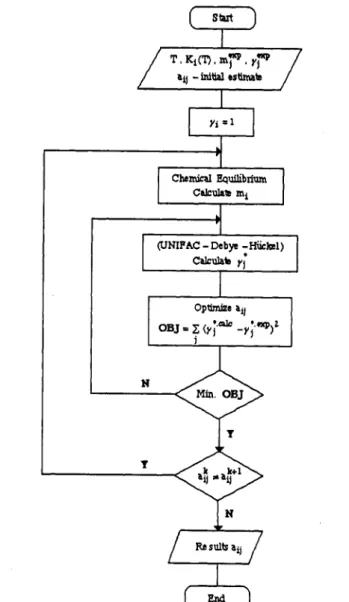
Parameter Estimation a n d Results. To estimate the model parameters, a modified Levenberg-Marquardt method (Levenberg, 1944; Marquardt, 1963) was used to minimize the following objective function:
where yb refers to the zwitterion activity coefficient and calc a n d exp mean calculated with the model and exper- imental, respectively.
a
y1zyxwvutsrqponmlkjihgfedcbaZYXWVUTSRQPONMLKJIHGFEDCBA
= 1(UNIFAC
-
D e b p -HiLkl)F
l
I
Optimize aii1
Rc sulb aij
Figure 2. Algorithm used in the minimization process.
In the process minimization, the distance of closest approach on the Debye-Hiickel theory was set equal to 4
A,
and only new UNIFAC interaction parameters were obtained. An algorithm of the method can be seen in Figure 2, where the different convergence criteria used are shown.Seventeen data points available from alanine and glycine (Hutchens, 1976) were used to estimate four energy parameters between the groups COO-, CNHs+, CH2, and HzO. The determination of the interaction parameters between the new above-mentioned groups and OH was carried out using data for serine (Hutchens, 1976). In this case, we concluded that the best results were obtained when the interaction parameters for OH/COO- and OH/ CNH3+ were set equal to the interaction parameters for COO-/OH and CNHs+/OH, respectively. Data for proline and hydroxyproline were also regressed together to esti- mate the parameters OH/CNHz+, CNHz+/CH2,
HzO/
CNH2+, and CNH2+/H20. The two last ones were set equal during the calculations. Finally, the minimization process applied on the available experimental data for alanyl- alanine and glycylalanine allowed the estimation of the group parameters H20/CO, CNH/CNH3+, CNH/CO, CNHs+/CNH, and CO/H20.All the other relevant parameters were fixed. They were
all given the same value (5000),
zyxwvutsrqponmlkjihgfedcbaZYXWVUTSRQPONMLKJIHGFEDCBA
because it turned out during1344
zyxwvutsrqponmlkjihgfedcbaZYXWVUTSRQPONMLKJIHGFEDCBA
Ind. Eng. Chem. Res., Vol.zyxwvutsrqponmlkjihgfedcbaZYXWVUTSRQPONMLKJIHGFEDCBA
33, No. 5, 1994zyxwvutsrqponmlkjihgfedcbaZYXWVUTSRQPONMLKJIHGFEDCBA
Table 4. Group Interaction Parameters (K)
CHz OH HzO CNH
coo-
CNHs+ CNH2+co
0.0 986.5" 131S0 255.7" 5000 5000 5000 5000
OH 156.4° 0.0 353.50 42.700 -577.0 170.6 -572.4 nab
CHz
HzO
coo-
5Ooo -577.0 -568.9 5000 0.0 5000 5000zyxwvutsrqponmlkjihgfedcbaZYXWVUTSRQPONMLKJIHGFEDCBA
5OooCNHs+ 5000 170.6 5000 -768.4 -2041 0.0 na 5000
co
5Ooo na -680.0 5000 5000 5000 na 0.0300.00 -229.1' 0.0 168.00 -1354 803.5 -114.3 93.03
CNH 65.33a -150.00 -448.2" 0.0
zyxwvutsrqponmlkjihgfedcbaZYXWVUTSRQPONMLKJIHGFEDCBA
5000 -335.9 na -1142CNHz+ -536.5 5000 -114.3 na 5000 na 0.0 na
Values available on UNIFAC VLE Tables (Tiegs et al., 1987). na: not available.
2.2 I
zyxwvutsrqponmlkjihgfedcbaZYXWVUTSRQPONMLKJIHGFEDCBA
Ie
0 2 4 ti 8
Amino Acid Molality
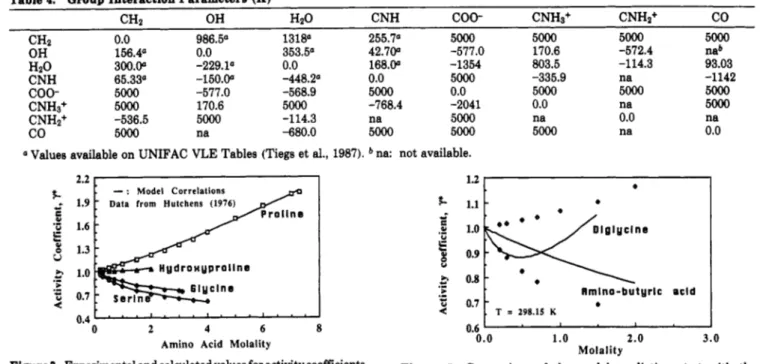
Figure 3. Experimental and calculated values for activity coefficients of amino acids in water at 298.15 K.
f
-
: Model Correlations e Data from Hutchens (1976)2 . 0
0.8" ' ' ' I ' ' ' " ' ' ' ' ' ' ' ' '
'
0.0 0.5 1.0 1 . 5
Molality
Figure 4. Experimental and calculated values for activity coefficients of alanine and some peptides in water at 298.15 K.
Table 4 presents the estimated parameters. In Figures 3 and 4 it is possible to observe the quality of the correlations. They are all of good quality. Table 5 summarizes some of the information of both correlation and prediction, and a comparison is given with the results of Chen et al. (1989) and Gupta and Heidemann (1990). The root mean square deviation (rmsd) values for corre- lation are quite satisfactory, and in the majority of the cases the deviations are even smaller than those calculated by Chen et al. (1989), who only correlated one amino acid or one peptide a t a time. The results of Gupta and Heidemann (1990) seem to deviate more than our results even though both works are based on the UNIFAC group- contribution method and have the same number of parameters regressed.
Table 5 also shows the infinite dilution activity coef- ficients that arise from the minimization procedure. Unfortunately, we did not find any experimental data to compare with the estimated values; however, they seem
to be quite reasonable.
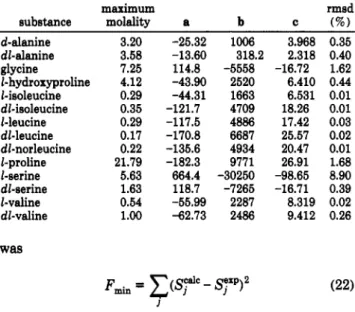
The prediction results require some attention: the rmsd values calculated are much higher than the ones obtained for correlation. Nevertheless, they are about the same order of magnitude as the values obtained by Gupta and Heidemann (1990). For the prediction of the activity coefficients of valine, aminobutyric acid, and aminovaleric acid an incorrect slope was calculated for all the cases, withy* decreasing with increasing molality, while the data
1.2
1
*f. 1.1
zyxwvutsrqponmlkjihgfedcbaZYXWVUTSRQPONMLKJIHGFEDCBA
c
b.-
.-
> flmlno-butyrlc acid5
0.7-
b, T = 298.15 K
0.6
0.0 1.0 2.0 3.0
Molality
Figure 5. Comparison of the model predictions (-) with the experimental activity coefficients: 0 , aminobutyric acid;
,
di- glycine. Experimental data: Hutchens (1976).show the opposite trend. Figure 5 shows, for aminobutyric acid and glycylglycine, the predicted curves of activity coefficients.
Interactions between methyl groups and the new charged groups are not important, since all parameters have high values. The three amino acids already mentioned are obtained from alanine by addition of methyl groups (see Table 3), and the introduction of CHdH20 interaction parameters is very important, suggesting the study of the effects of the addition of methyl groups on the activity coefficients of hypothetical mixtures of n-alkanes and water. Surprisingly, a deep decrease of y* with molality is observed. In some way, these results tend to show that the interaction parameters between CH2 and H2O (Tiegs et al., 1987) are not the best to represent the behavior of solutions of this kind. Moreover, difficulties arise in getting good correlations using amino acids with a long hydro- carbon chain, which support our point. However, as we want to maintain the group-contribution concept, no reevaluation of that pair of parameters was tried for our
specific case. The same observations are valid for the other predictions.
Temperature Dependence of the Solubilities
In this work the solubility data is represented by regressing the thermodynamic solubility constant of eq 7
in the form:
b
In
K,
= a+
T +
zyxwvutsrqponmlkjihgfedcbaZYXWVUTSRQPONMLKJIHGFEDCBA
c InT
where a, b, and c are parameters.
Hutchens (1976) compiled the solubilities of amino acids between 0 and 100 "C. However, original experimental data from Dalton and Schmidt (1933) and Dunn et al.
(1933) cover only the temperature range between 0 and 75
Ind. Eng. Chem. Res., Vol.
zyxwvutsrqponmlkjihgfedcbaZYXWVUTSRQPONMLKJIHGFEDCBA
33, No. 5,1994 1345Table 6. Relevant Information from Minimization and Comparisons between Different Approaches
substance
zyxwvutsrqponmlkjihgfedcbaZYXWVUTSRQPONMLKJIHGFEDCBA
y ' a d 298.15 K no. regressed parameters Chen et al. (1989) G u ~ t a and Heidemann (1990) this workalanine glycine hydroxyproline proline serine alanylalanine glycylalaniie a-aminobutyric acid a-aminovaleric acid threonine valine alanylglycine glycylglycine triglycine
0.85 4
1.67 4
0.02 3
0.03 3
2.20 2
0.85 5
0.88 5
2.74 10.19 5.68 13.48 0.19 0.41 0.06 h 600 t M 400
s
h-
.-
;
200-
v)
0 2
-
: Correlated.
A"..
.
Predicted>---
' 0 2 9 0 310 330 350 370
Temperature (K)
Figure6. Amino acid solubility in water: correlation and prediction curves. Comparison with experimental data from Dalton and Schmidt
(1933) and the extrapolated values from Hutchens (1976).
Table 6. Solubility Constants of Amino Acids in Water
maximum rmsd
substance molality a b c (%)
d-alanine dl-alanine glycine l-hydroxyproline l-isoleucine dl-isoleucine 1-leucine dl-leucine dl-norleucine 1-proline 1-serine dl-serine 2-valine dl-valine
W 8 9
3.20 3.58 7.25 4.12 0.29 0.35 0.29 0.17 0.22 21.79 5.63 1.63 0.54 1.00 -25.32 -13.60 114.8 -43.90 -44.31 -121.7 -117.5 -170.8 -135.6 -182.3 664.4 118.7 -55.99 -62.73 1006 -5558 2520 1663 4709 4886 6687 4934 9771 -30250 -7265 2287 2486 318.2 3.968 2.318 6.410 6.531 -16.72 18.26 17.42 25.57 20.47 26.91 -98.65 -16.71 8.319 9.412 0.35 0.40 1.62 0.44 0.01 0.01 0.03 0.02 0.01 1.68 8.90 0.39 0.02 0.26
with S being the solubility in g/kg of water.
The fitted parameters are listed in Table 6, and the quality of the regression for some amino acids can be seen in Figures 6 and 7. These figures also show the predicted solubilities with our model a t temperatures above 75 OC and the extrapolated solubilities from the experimental datagiven by Hutchens (1976). Some results related with those predictions are shown in Table 7. It is possible to verify big discrepancies between predicted and extra- polated values for glycine, dl-serine, and dl-valine a t 100 OC, but on average the errors are not large (<5.9% ). For glycine the model predicts a maximum solubility (Figure 6) while extrapolated values show linear increase in the solubility up to 100 OC. It would be nice to see what is the experimental curve in that zone.
0.04 2.07 0.36 1.30 2.80 2.04 2.44 0.32 0.70 4.47 2.92 3.25 0.67 8.97 4.20 0.06 3.01 3.32 17.34 13.78 12.15 80
_ .
.
Predictedb
-
6
6 0 -b
4 0 -M
.r
.
I-Leuclneh
-
.-
.-
v1 0.19 0.60 0.39 1.21 0.24 0.52 0.59 17.87 16.40 26.12 16.43 28.22 17.06 10.00 ~ ~~i70 2 9 0 310 330 350 370
Temperature (K)
Figure 7. Amino acid solubility in water: correlation and prediction curves. Comparison with experimental data from Dalton and Schmidt
(1933) and the extrapolated values from Hutchena (1976).
Table 7. Comparison between the Extrapolated (F) and Predicted Solubilities ( W e ) in a/ka of Water at 373.16 K
amino acid SO*
d-alanine 373.0
dl-alanine 440.4
glycine 671.7
dl-isoleucine 78.02
1-leucine 56.38
dl-leucine 42.06
dl-norleucine 52.29
&serine 322.4
dl-valine 188.1
a Error (%) = 100(Seh - Sdc)/Se".
I - hydroxyproline 706.9
2-proline 3355
S* 383.8 454.9 597.9 722.1 81.93 55.83 41.73 53.46 3409 363.0 227.2
errop ( % )
-2.92 -3.29 10.99 -2.15 -5.01 0.97 0.78 -2.24 -1.61 -12.59 -20.79
Although the results are good, some aspects deserve attention: (i) Extrapolations had to be made both on temperature and composition. The temperature range is 0-100 oC, while the UNIFAC parameters were estimated from experimental data a t 25 "C only. As regards composition, for almost all amino acids, maximum molality is now much higher than the maximum molality of experimental data on activity coefficients (Table 1). (ii) The model was used indifferently to d , I , and dl forms of amino acids, since UNIFAC does not differentiate optical isomers.
Finally, it is important to mention that the reaction equilibrium constants of eqs 8-10 were considered func- tions of temperature (King, 1951; Robinson and Stokes, 1965; Izatt and Christensen, 1973).
1346
zyxwvutsrqponmlkjihgfedcbaZYXWVUTSRQPONMLKJIHGFEDCBA
Ind. Eng. Chem. Res., Vol.zyxwvutsrqponmlkjihgfedcbaZYXWVUTSRQPONMLKJIHGFEDCBA
33, No. 5,1994Predicted
Experimental
-
-
5f
zyxwvutsrqponmlkjihgfedcbaZYXWVUTSRQPONMLKJIHGFEDCBA
3
M 26h
-
.-
-
.-
n
-
8
::
zyxwvutsrqponmlkjihgfedcbaZYXWVUTSRQPONMLKJIHGFEDCBA
3
Q)
.-
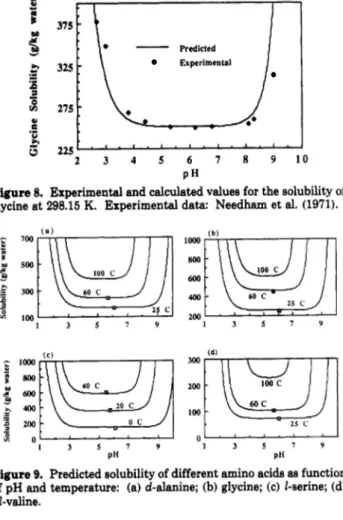
Figure 8. glycine at
IO0 c
300
2 c 100
1 3 5 7 9
0
-I 3 5 7 Y
PH
Figure 9. Predicted solubility of different amino acids aa function
of pH and temperature: (a) d-alanine; (b) glycine; (c) 1-serine; (d)
d 1-valine.
and the results from solubility correlation were used to estimate solubilities a t different conditions of pH.
In Figure 8 a comparison between solubilities of glycine a t 25 "C a t different pH values predicted by the model and from experimental data (Needham et al., 1971) is given. The quality of the predictions shown are better than expected: In the experimental work it was necessary to add a strong electrolyte (acid or basic) to fix the pH a t the required value, and of course the electrolyte gives rise to new important interactions between the molecules, as can be seen in the works of Schrier and Robinson (1974) and Briggs et al. (1974).
Figure 9 shows predicted curves of solubility as a function of pH a t different temperatures for some amino acids. They are similar to the experimental curves obtained by Dalton et al. (1930) for diiodotyrosine a t three temperatures, showing the same type of behavior as we change from one temperature to the other. It is also possible to identify the predicted minimum solubility a t the isoelectric point with the invariant solubility bands on both sides of it. The predicted bands a t 25 "C are inside the range of 2-3 pH units on either side of the isoelectric point, as indicated in the works of Needham et
al. (1971) and Zumstein and Rousseau (1989).
Conclusions
A new model combining chemical equilibria with a UNIFAC-Debye-Huckel approach to describe physical equilibria has been developed for the correlation and prediction of activity coefficients. New charged groups have been defined, taking into account the charges in the zwitterionic, the anionic, and the cationic species of amino acids. The results for correlation are in a very good
agreement with experimental data, while for predictions the model must be used with caution, since the average rmsd is large.
The model provides good results for the correlation of the solubility, and a comparison between calculated solubilities with the model and the extrapolated values from the experimental curve shows good agreement.
Since studies of pH influence on the solubility are extremely dependent on the correlation of solubilities, care must be taken a t temperatures higher than 75 "C. However, estimated bands of constant solubility a t dif- ferent temperatures seem to be very reasonable for all amino acids studied.
Finally, we want to stress a point already emphasized in this work the available data are scarce and old, which may introduce some doubts in the obtained results. Therefore, experimental work to verify and improve the results is most welcome.
Acknowledgment
The authors are very grateful to Professor Peter Rasmussen (Technical University of Denmark, Lyngby, Denmark) for many helpful discussions. We recognize with thanks the financial support of JNICT (Portugal), for a research grant to S.P.P.
Nomenclature
A = solvent
A = Debye-Hiickel parameter (mo14.s kgO.6)
AA = amino dcid or peptide
AA+ = amino acid or peptide cation
AA- = amino acid or peptide anion
AA* = zwitterion
a = solubility constant in eq 21
a = activity; UNIFAC binary interaction parameter ( K )
a = Debye-Htickel distance of closest approach of ions (m)
B = Debye-Hiickel parameter (mo14.6 kp0.6 m-9
b = solubility constant in eq 21, K
c = solubility constant in eq 21
F- = objective function (eq 22)
G*,E = unsymmetric excess Gibbs energy
Z = ionic strength (mol/kg of solvent)
K = thermodynamic chemical equilibrium constant
zyxwvutsrqponmlkjihgfedcbaZYXWVUTSRQPONMLKJIHGFEDCBA
KD = ratio of zwitterion to uncharged forms of amino acids
K, = ionic product of water
K , = thermodynamic solubility constant for zwitterion
k, = thermodynamic solubility constant for amino acid
M = molecular weight (g/mol) m = molality (mol/kg of solvent)
OBJ = objective function (eq 20)
Q = group area parameter
R = group volume parameter
S = solubility (g/kg of solvent)
s = solid phase
T = absolute temperature (K)
z = charge number of the ion
Greek Letters
y = activity coefficient
t = dielectric constant
Subscripts
DH = long-range contribution represented by Debye-Hiickel equation
i = component i; group i ; reaction i
j = data point
zyxwvutsrqponmlkjihgfedcbaZYXWVUTSRQPONMLKJIHGFEDCBA
j ; group jk = group k
Superscripts
C
zyxwvutsrqponmlkjihgfedcbaZYXWVUTSRQPONMLKJIHGFEDCBA
= combinatorial term from UNIFACcalc = calculated
DH = long-range contribution by Debye-Htickel equation
exp = experimental
est = extrapolated from experimental curve k = iteration
R = residual term from UNIFAC
zyxwvutsrqponmlkjihgfedcbaZYXWVUTSRQPONMLKJIHGFEDCBA
r = mean rational scale
*
= unsymmetric convention= infinite dilution
Literature Cited
Bohmski, R. C. Modern Concepts in Biochemistry, 5th ed.;
zyxwvutsrqponmlkjihgfedcbaZYXWVUTSRQPONMLKJIHGFEDCBA
Allynand Bacon: Newton, MA, 1987; Chapter 3.
Bondi, A. Physical Properties of
zyxwvutsrqponmlkjihgfedcbaZYXWVUTSRQPONMLKJIHGFEDCBA
Molecular Crystals, Liquids andGlasses; Wiley: New York, 1968; Chapter 14.
Briggs, C. C.; Lilley, T. H.; Rutherford, J.; Woodhead, S. The Activity of Calcium Chloride in Aqueous Solutions of Some Amino Acids
a t 25 "C.
zyxwvutsrqponmlkjihgfedcbaZYXWVUTSRQPONMLKJIHGFEDCBA
J . Solution Chem. 1974,3,649-658.Chen, C. C.; Zhu, Y.; Evans, L. B. Phase Partioning of Biomolecules: Solubilities of Amino Acids. Biotechnol. Prog. 1989,5, 111-118.
Cohn, E. J.; McMeekin, T. L.; Edsall, T. J.; Weare, J. H. Studies in the Physical Chemistry of Amino Acids, Peptides and Related Substances. 11. The solubility of a-Amino Acids in Water and in
Alcohol-Water Mutures. J. Am.
zyxwvutsrqponmlkjihgfedcbaZYXWVUTSRQPONMLKJIHGFEDCBA
Chem. SOC. 1934,56,2270-2282.Dalton, J. B.; Schmidt, C. L. A. The Solubilities of Certain Amino Acids in Water, the Densities of their Solutions a t Twenty Five Degrees, and the Calculated Heata of Solution and the Partial Molal Volumes. J. Biol. Chem. 1933, 103, 549-578.
Dalton, J. B.; Kirk, P. L.; Schmidt, C. L. A. The Apparent Diesociation Constanta of Diiodotyrosine, ita Heat of Solution, and ita Apparent Heat of Ionization. J . Biol. Chem. 1930,88,589.
Dunn, M. S.; Ross, F. J.; Read, L. S. The Solubility of the Amino Acids in Water. J. Biol. Chem. 1933, 103, 579-595.
Ellerton, H. D.; Reinfelds, G.; Mulcahy, D. E.; Dunlop, P. J. Activity, Density, and Relative Viscosity Data for Several Amino Acids, Lactamide, and Raffinose in Aqueous Solution a t 25 OC. J. Phys. Chem. 1964,68,396402.
Fredenslund, Aa.; Jones, R. L.; Prausnitz, J. M. Group-Contribution Estimation of Activity Coefficienta in Non Ideal Liquid Mixtures. AZChE J. 1975,21, 1086-1099.
Gmehling, J.; Rasmussen, P.; Fredenslund, Aa. Vapor-Liquid Equi- libria by UNIFAC Group Contribution. Revision and Extension
2. Znd. Eng. Chem. Process Des. Dev. 1982,21, 116127.
Greenstein, J. P.; Winitz, M. Chemistry of the Amino Acids; John Wiley & Sons: New York, 1961; Vol. 1, pp 447.
Gupta, R. B.; Heidemann, R. A. Solubility Models for Amino Acids and Antibiotics. AZChE J. 1990,36 (3), 333-341.
Hansen, H. K.; Rasmussen, P.; Fredenslund, Aa.; Schiller, M.; Gmehling, J. Vapor-Liquid Equilibria by UNIFAC Group Con- tribution. Revision and Extension 5. Znd. Eng. Chem. Res. 1991, 30,2352-2355.
Hutchens, J. 0. In Handbook of BiochemistryandMoleculur Biology, 3rd ed.; Fasman, G. D., Ed.; CRC Press: Cleveland, OH, 1976;
Hutchens, J. 0.; Figlio, K. M.; Granito, S. M. An Isopiestic Comparison Method for Activities. J. Biol. Chem. 1963,238, 1419-1422.
Izatt, R. M.; Christensen, J. J. In CRC Handbook of Chemistry and Physics, 53rd ed.; Weast, R. C., Ed.; The Chemical Rubber Co.: Cleveland, OH, 1973; Chapter J.
Kikic, I.; Alessi, P.; Rasmussen, P.; Fredenslund, Aa. On the Combinatorial Part of the UNIFAC and UNIQUAC Models. Can. J. Chem. Eng. 1980,58, 253-258.
Vol. 1, pp 104-125.
Ind. Eng. Chem. Res., Vol. 33, No. 5,1994 1347
King, E. J. The Ionization Constanta of Glycine and the Effect of
Sodium Chloride Upon its Second Ionization. J . Am. Chem. SOC.
zyxwvutsrqponmlkjihgfedcbaZYXWVUTSRQPONMLKJIHGFEDCBA
1951, 73,155-159.
Larsen, B. L.; Rasmussen, P.; Fredenslund, Aa. A Modified UNIFAC Group-Contribution Model for Prediction of Phase Equilibria and Heat of Mixing. Znd. Eng. Chem. Res. 1987,26, 2274-2286.
Levenberg, K. A Method for the Solution of Certain Non-Linear Problems in Least Squares. Q. Appl. Math. 1944,2, 164-168.
Macedo, E. A.; Weidlich, U.; Gmehling, J.; Rasmussen, P. Vapor- Liquid Equilibria by UNIFAC Group Contribution. Revision and Extension 3. Znd. Eng. Chem. Process Des. Dev. 1983,22, 676- 678.
Marquardt, D. W. An Algorithm for Least-Squares Estimation of Nonlinear Parameters. J. SOC. Znd. Appl. Math. 1963, 11,431.
Nam, K. K. Representation of the Solubility Behavior of Amino Acids in Water. AZChE J. 1988,34, 1257-1266.
Needham, T. E.; Paruta, A. N.; Gerraughty, R. J. Solubility of Amino Acids in Pure Solvent Systems. J. Pharm. Sci. 1971,60,565-567.
Orella, C. J.; Kirwan, D. J. Correlation of Amino Acid Solubilities in Aqueous Aliphatic Alcohol Solutions. Znd. Eng. Chem. Res. 1991, 30,1040-1045.
Pitzer, K. S. Electrolytes. From Dilute Solutions to Fused Salta. J.
Am. Chem. SOC. 1980,102,2902-2906.
Prausnitz, J. M. Biotechnology: A New Frontier for Molecular Thermodynamics. Fluid Phase Equilib. 1989,53, 439-451.
Renon, H.; Prausnitz, J. M. Local Compositions in Thermodynamic Excess Functions for Liquid Mixtures. AZChE J. 1968,14,135- 144.
Robinson, R. A,; Stokes, R. H. Electrolyte Solutions, revd ed.; Butterworth London, 1965; Chapter 2.
Schrier, E. E.; Robinson, R. A. Free Energy Relationships in Aqueous Amino Acid and Peptide Solutions Containing Sodium Chloride.
J. Solution Chem. 1974,3,493-501.
Smith, P. K.; Smith,E. R. B. ThermodynamicProperties of Solutions of Amino Acids and Related Substances. 11. The Activity of Aliphatic Amino Acids in Aqueous Solution a t Twenty Five Degrees. J. Biol. Chem. 1937,121,607-613.
Smith, P. K.; Smith, E. R. B. Thermodynamic Properties of Solutions of Amino Acids and Related Substances. V. The Activities of Some Hydroxy- and n-Methylaminohcids and Proline in Aqueous Solution a t Twenty Five Degrees. J. Biol. Chem. 1940a,132,57- 64.
Smith, P. K.; Smith, E. R. B. ThermodynamicProperties of Solutions of Amino Acids and Related Substances. VI. The Activities of Some Peptides in Aqueous Solution a t Twenty Five Degrees. J. Biol. Chem. 1940b, 135,273.
Tiegs, D.; Gmehling, J.; Rasmussen, P.; Fredenslund, Aa. Vapor- Liquid Equilibria by UNIFAC Group Contribution. Revision and Extension 4. Znd. Eng. Chem. Res. 1987,26,159-161.
Wilson, G. M. Vapol-Liquid Equilibrium. XI. A New Expression for the Excess Free Energy of Mixing. J. Am. Chem. SOC. 1964, 86,127-130.
Zumstein, R. C.; Rousseau, R. W. Solubility of 1-Isoleucine in and Recovery of 1-Isoleucine from Neutral and Acidic Aqueous Solutions. Znd. Eng. Chem. Res. 1989,28, 1226-1231.
Received for review September 20, 1993
Revised manuscript received January 21, 1994
Accepted February 1, 19940
@ Abstract published in Advance ACS Abstracts, March 15,