Rights perceived and practiced
Results of a survey carried out in Portugal as part of the project
“Domestic Work and Domestic Workers
Interdisciplinary and Comparative Perspectives”
Working Paper
[ISCTE-IUL – Dinâmia-CET]Pierre Guibentif
Contents:
Introduction...3
Structure of the tables ...3
A. Characteristics of the interviewees and of the context and nature of their activity (independent variables: Tables 0.1 and 0.2) ...6
a) One general variable: the place where the interview was conducted ...6
b) Main personal variables ...7
c) Main variables characterizing the activity ...9
B. The reality of domestic work (dependent variables)...12
a) Experiences of discomfort (Table 1.1)...13
b) Specific situations encountered (Table 1.2)...16
c) Global level of satisfaction (Table 1.3)...19
d) Work experiences of the interviewees – A general assessment...23
e) Practices against the law (Table 2.1) ...25
f) Relationship to the law (Table 3.1.)...30
C. Some tentative interpretations...34
D. Relevance of the survey’s results for legal empowerment strategies ...37
References...40
Annex 1: Typology of activities (Quick Cluster) ...41
Annex 2: Principal component analysis of the situations encountered...47
Tables ...55
Introduction
The following tables are designed to offer an overview on the data concerning Portugal gathered within the framework of a survey part of the Domestic Work and
Domestic Workers research project1. The analysis of these data should allow us to
develop interpretive hypotheses that could help us in reading another set of tables, based on a more limited number of questionnaires, concerning the other countries included in our research2.
The tables offer a view on the reality of domestic work, crossing data characterizing its main aspects – dependent variables – with data characterising its context, supposed though to have some impact on it – independent variables.
Tables 0.1 and 0.2 present the independent variables. In other words, they offer a more accurate notion of who interviewed people are, and for whom and in which general conditions they work (A). Tables 1.1 until 3.1 describe the behaviour of several dependent variables in relation to the independent variables previously introduced (B). The paper is concluded with a general assessment of our findings (C) and some thoughts on their relevance for empowerment policies addressing domestic workers, and in particular for the design of legal information that should be made available to them (D).
Structure of the tables
All tables are constructed according to the following rule: independent variables and their concrete values are always listed in rows. Dependent variables appear in
columns. The interpretation of the tables is than a result of the comparison between
the figures appearing in one same column, i.e.: a comparison between the impact, on a certain dependent variable, caused by the different possible values of an independent variable.
1
Project financed by the Fundação para a Ciência e a Tecnologia – FCT, reference PTDC/JUR/65622/2006. For more details on the topic of this project, see in particular Blétière (2008a), and Blétière (2008b). I thank António Velez for his support in the processing of data and production of tables, and Valdemar Ferreira for his support in the edition of this working paper. Detailed information on the contents of the database containing the results of the survey, as well as on the variables used for the production of the table is to be found in the document in the document Research Project Domestic Work – Guide to the SPSS Database / Projecto de investigação Trabalho Doméstico – Guia da Base de Dados em SPSS (Lisbon, Dinâmia-CET, 2011), available at Dinâmia-CET.
2
Brazil, India, Mozambique, United Kingdom. To be published in another Dinâmia Working Paper. Together with this one, it will offer a first version of a socio-legal analysis of our research results to be included, in a more compact formulation, in Guibentif et al. (forthcoming).
In order to facilitate the comparison, the tables only show percentages in almost all cases. The main numerical figures, concerning the independent variables, appear at the borders of tables 0.1 and 0.2 (column [A]; row [1]), as well as in the columns [A] of the following tables.
A total of 684 questionnaires were analysed. In principle, the sum of the figures corresponding to the possible values of each variable should equal this number. In fact, occasionally the completed questionnaires do not include the relevant answers; this obliges us to work with lower figures (for example: one questionnaire completed in Portugal does not include any answer on the question of the gender). In tables 1.1 until 3.1, percentages are in principle always calculated on the basis of all the 684 questionnaires.
There is an important difference between the construction procedure of tables 0.1. and 0.2 (introduction to the independent variables), and the one of tables 1.1 until 3.1 (analysis of the behaviour of dependent variables). The first two tables consist of a composition of complete sub-tables crossing all values of two of the variables under discussion. It means that all individual answers appear in the table. So it is always possible to sum the percentages in the rows of the sub-tables up to 100. The following tables 1.1 until 3.1 only show, in each of their columns, one column issued from the original tables: the one containing the most relevant answer, and from which the opposed answer(s) can in most cases be deduced. In these tables, obviously, the percentages reported cannot be summed. On the other hand, they may be compared across one same row, if it is the case (example: in table 1.2 a higher proportion of wage arrears [column E] than of discrimination case [column O], whatever the characteristics of the concerned person [in all rows]).
The following two fragments of tables 0.1 and 1.3-A illustrate these two construction procedures, as well as, actually, one of the many problems we encountered in the interpretation of our data. Table 0.1 shows that the younger our interviewees are, the more probable it is that they are immigrants. Table 1.3 – derived from, among others, the tables shown as examples 2-A and 2-B – reveals that the younger our interviewees are, the more probable it is for them to answer “not” or “not at all satisfied” when questioned on their general level of satisfaction, and “Yes” to the question “Would you change for another job?”. Not surprisingly, these two variables, general level of satisfaction and will to change for another job, have a similar behaviour.
The question raised by these two examples is to what extent the relationship between age and level of satisfaction is a consequence of the link between young age and status of immigrant. Indeed, nationality of interviewees proved to have a strong impact on many answers. This is why we include here a second complete set of tables, presenting only the answers of the Portuguese interviewees (456). As far as the impact of age on the level of global satisfaction is concerned, it is clearly confirmed by table 1.3-A (PP).
Example 1: Fragment of Table 0.1. Variables Nationality Categories [A] Total nr. of people per category [B] Brazil
[C] Eastern Europe [D] Africa (PALOP)
[E] Portuga l [F] Interviewees (Nr.) [1] 684 83 57 85 456 681 Interviewees (%)[2] 12,2 8,4 12,5 67,0 100 Age [13] until 30 120 21,0 13,4 19,3 46,2 100 [14] 31-40 159 18,4 12,7 12,0 57,0 100 [15] 41-50 209 8,6 6,7 11,0 73,7 100 [16] 51-60 143 7,0 4,2 9,2 79,6 100 [17] 61and more 48 2,1 2,1 10,4 85,4 100
Example 2-A: Fragment of Table 1.3-A
Questions [B] General level of satisfaction [D] Would you change for another job? Answers considered Not very satisfied/Not satisfied at all Yes [A]Total nr. of people per category
% of people giving these answers All interviewees [1] 684 8,8 64,1 Age [6] until 30 120 13,3 84,2 [7] 31-40 159 8,8 71,7 [8] 41-50 209 9,6 59,3 [9] 51-60 143 4,9 48,3 [10] 61and more 48 4,2 25,0
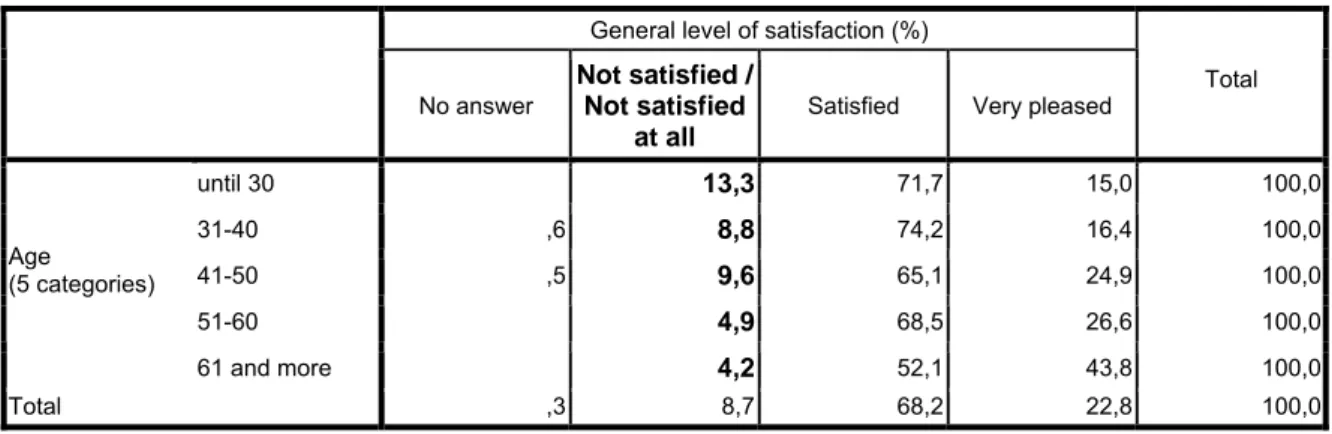
Example 2-B: Table from which column [B] of Table 1.3-A (example 2-A) is extracted (in bold)
General level of satisfaction (%)
No answer
Not satisfied / Not satisfied
at all
Satisfied Very pleased
Total until 30 13,3 71,7 15,0 100,0 31-40 ,6 8,8 74,2 16,4 100,0 41-50 ,5 9,6 65,1 24,9 100,0 51-60 4,9 68,5 26,6 100,0 Age (5 categories) 61 and more 4,2 52,1 43,8 100,0 Total ,3 8,7 68,2 22,8 100,0
Example 2-C: Table from which column [D] of Table 1.3-A (example 2-A) is extracted (in bold)
Would you change for another job? (%) No answer Yes No Total until 30 ,8 84,2 15,0 100,0 31-40 ,6 71,7 27,7 100,0 41-50 1,0 59,3 39,7 100,0 51-60 48,3 51,7 100,0 Age (5 categories) 61 and more 2,1 25,0 72,9 100,0 Total ,7 61,9 37,4 100,0
A. Characteristics of the interviewees and of the context and nature of their activity (independent variables: Tables 0.1 and 0.2)
a) One general variable: the place where the interview was conducted
Table 0.1 shows in the first place the characteristics of the interviewees according to the place where the interview was conducted, which we are in condition to presume to be – considering the geographical distances – the region where they work. The aim of this first analysis is not so much to draw conclusions about regional characteristics of domestic work in Portugal, but mainly to evaluate the quality of the collected data. Indeed, given the “snowball” technique used in the composition of the sample, we will possibly meet in each region groups of people with similar characteristics, not only because these characteristics would be an effect of regional features, but because the people who answered first the questionnaire indicated other people to interview with a similar personal profile. Therefore it was important to check if such regional effects of the survey procedure exist, and how strong they are. And if, at the same time, the data gathered in the different regions show, as a whole, sufficient variety, and if the differences between regions are likely, at least to some extent, to be linked
to general characteristics of them. An impact of the research procedure is more likely to occur where a lower number of questionnaires was applied, which is the case in Algarve (28), Alentejo (31) and Coimbra (44).
Differences in the proportions of immigrants are likely to be explained by the existence of numerous immigrant communities in the corresponding regions: comparatively high proportions of people from Africa in Lisbon, from Eastern Europe in the Algarve and, with lower figures, in Oporto, and from Brazil in Braga, Alentejo, and Oporto.
Differences in the representations of age categories may be more difficult to be explained by regional characteristics (comparatively, a very high proportion of older people in Algarve and Coimbra; high proportion of younger persons in Alentejo and Braga).
Level of schooling is clearly below the average in Alentejo, and comparatively high in Braga and Algarve.
b) Main personal variables
In the following rows, tables 0.1 and 0.2 present the population surveyed according to what may be named the main personal variables. Four of them are personal characteristics: nationality, age, gender and schooling.
Gender will only be taken into consideration in this first table. Indeed, in Portugal,
681 from 684 (99.7%) interviewees are women. Two men answered, one coming from Lisbon, the other from Oporto, the two main cities in the country. These figures allow us to consider the surveyed population as essentially female and not to insert in the following tables rows specially devoted to the variable gender.
Another variable is not taken into consideration in the table: the fact of being directly employed by private houselords, or by a company. Only six people belong to the second category. This very low proportion certainly corresponds to a currently low involvement of companies in this sector – but it will probably increase in the future – even if it is probably also an effect of other factors. People who work for companies may not belong to the same informal groups to which workers of private house lord belong. They also may be subject to a tighter organizational control by their employer, feeling less free to answer the questionnaire.
As far as their nationality is concerned, we were able to create four main categories: Brazil, Africa (PALOP – Portuguese-speaking African countries), Eastern Europe, and Portugal. Two thirds of the interviewees are Portuguese (456 / 67%); Africa and Brazil are represented by similar figures (85 and 83 / about 12% in both cases); Eastern Europe forms a slightly smaller group (57 / 8%).
Five age categories were differentiated (up to 30 / 31-40 / 41-50 / 51-60 / 61 and more), forming groups of comparable volume (between 120 and 209 / 18-23%), with
the exception of the smaller group of older workers (48 / 7%). The small number of workers below 20 (less than 30) and above 70 (about 10) did not justify the creation of separate categories.
Interviewees were distributed in six categories according the duration of their
schooling. A considerable proportion did spend only four years in school. But many
interviewees had a longer schooling time, even beyond 12 years.
A crucial variable is, for obvious sociological reasons, the socio-economic status of the employers of domestic workers. Their conception of home and intimacy will orient their choice at the moment of hiring the workers; their lifestyle will shape the working conditions of them, and so on. So it seems of utmost relevance to have data about them. However, the questionnaire is addressed to the domestic workers themselves. For ethical reasons, we did not ask them any questions about other people (apart from a few questions on their relationship to other people). On the other hand, answers given on questions about their work enable us to reconstruct, hypothetically at least, the social status of their employers. In a first step, an upper and a lower social level were differentiated from a presumable middle class, on the basis of three variables: number of bathrooms, number of domestic workers employed, and occupation rate of bedrooms. We considered as an indication of a socio-economic privileged position the combination of the three following criteria: three or more bathrooms, two or more employees, and a bedroom rate of occupation of one person or less per room. – At the other end of the social spectrum, we considered as an indicator of a modest socio-economic position the combination of two criteria: up to two bathrooms, and a bedroom rate of occupation above 1.25. In order to introduce some differentiation in the numerically important remaining middle class, we opted for one criterion that separates two quantitatively comparable sets, corresponding, at least as the analysis of the Portuguese data reveals, to quite different behaviours: the fact that the house does include, or does not include an office. This may be considered as an indication of a higher education level, and more professional autonomy. The use of these criteria leads us, in Portugal, to four categories which figures correspond to what might be expected in terms of demographic distribution according to the social stratification of Portuguese society. The number of domestic workers employed by people belonging to the upper level is comparatively small (32 / 5%), which corresponds to the general distribution of the population. The number of workers employed by people likely to be qualified as belonging to a lower socio-economic status is relatively small too (89 / 14%), a low figure that might be interpreted as due to the fact that people living under these socio-economic conditions hardly can afford to pay a domestic worker. The main part of the interviewees belong to what we might name the middle class (537 / 82%), with a majority of people – almost half of our sample – working in houses with office (317 / 48%), a smaller proportion (220 / 33%) in houses without office.
Crossing the four main personal variables now introduced (see tables 0.1 and 0.1-2 rows [9] to [21]) allows the following statements:
− Immigrants are comparatively younger than Portuguese workers. This can easily be explained, in the case of Brazil and Eastern Europe, by the fact that the immigration took place, in many cases, in recent years. People from African countries are slightly more numerous in older categories than the other two
categories of foreigners. Indeed, the migration flows from Africa started long before those from Brazil and Eastern Europe.
− People of upper social status employ comparatively more Portuguese domestic workers. As far as immigrants are concerned, we observe two quite different behaviours. On the one hand, Brazilians and people from African countries are more frequently employed by people belonging to a lower social level (modest homes, houses without office; about 14% in each of the four cases considered), less by people belonging to a higher level (well off; houses with office; about 10% in each of the four cases considered). On the other hand, people from Eastern Europe are more frequently employed by the upper categories (about 10%), less by the lower (about 6%). This difference could be due to the level of wages, or to the differences in the ability to deal with people speaking foreign languages. − People of upper socio-economic status seem to hire rather younger people; people
living in modest socio-economic conditions, older people.
− Level of schooling varies strongly according to the nationality. People from Eastern Europe are far above the average, which confirms the picture of the comparatively high level of education of the immigrants coming from these countries. Brazilians have also a rather high level of education. The level is lower among people from African countries, on the other hand. The distribution among the six categories here differentiated suggests that the average level is slightly higher than the one of Portuguese interviewees. The calculation of the corresponding means confirms this state of affairs: Eastern Europe: 13.7 years; Brazil: 9.5 years; African Countries: 6.5 years; Portugal: 6.1 years.
− There is a clear relationship between age and level of schooling. Younger people tend to have spent a significantly longer period of time at school, which is certainly is result of education policies implemented over the last decades.
c) Main variables characterizing the activity
In a first approach, three variables were considered: number of houses where people work at the same time; nature of their tasks; average duration of the employment
relationship. These three variables will be discussed here separately, as well as in
their relation to the above introduced personal variables. The general hypothesis is that personal characteristics of employees are likely to condition the way they organize their work, as far as they are in condition to do it; and that the social status of their employers is likely to influence the kind of work the employees have to perform, and under what conditions they work.
The relationship between the characteristics of the activities and the place of employment will not be discussed here. Some specific points shall be picked up later on in the present document.
A brief analysis of the number of houses where the interviewees currently work at the same time shows that about half of them only work in one house (291 / 44%); a large
majority works in two or more houses. The maximum number quoted by a domestic worker questioned in Portugal is actually 10.
Among the four groups of nationalities, workers from Eastern Europe seem to be far more likely to work in several houses at the same time (36% in 4 or more houses, up against an average of 17%); on the other hand, people from Africa, far more likely to work in only one house (58% against an average of 44%). Workers above 60 are more often employed in only one house (61% against an average of 44%); workers between 30 and 50 in several houses. People of upper socio-economic level tend to employ people that work exclusively for them (60% against an average of 44%). People with a higher level of schooling tend to work more frequently in several houses at the same time.
The most interesting data concerning the activity is its content. Our questionnaire includes a list of nineteen performed tasks. The answers given on the basis of this list (questions A12.1 to A12.19) were analysed per cluster analysis (see Annex 1), which led to the definition of six categories – six profiles of domestic workers:
− category 1: All tasks apart from caring for elderly, sick, or dependent people, i.e. including caring of children;
− category 2: Almost exclusively cleaning, i.e. all tasks relating to cleaning; no care of people, no shopping, no meals;
− category 3: Cleaning as well as caring of animal or plants; no caring of people, no meals, no shopping;
− category 4: All tasks apart from caring for children, i.e. including caring of elderly, sick or dependent people;
− category 5: All tasks, without significant exception (“all-rounders”);
− category 6: All tasks, except caring for people – children or dependent – i.e. cleaning, but also shopping and preparing of meals.
These six categories correspond to six groups of interviewees of comparable dimension. The largest group is the one of those having, among other tasks, to take car of animals or plants (150 / 22%); two other groups are smaller than the average: the people who, among other tasks, have to take care of dependent people (70 / 10%), and those who, apart from cleaning, while not having to care for people, have to prepare meals (88 / 13%).
As far as the relationship between these types of performed tasks and the nationalities is concerned, two maxima and three minima are worth to be mentioned. People from Eastern Europe seem to be hired for a job including caring of animals or plants (35%; average: 22%) more frequently than other nationalities. There also seems to be a relationship, even if less strong, between African nationalities and jobs including only cleaning activities (24%; average: 19%). On the other side, people from Eastern Europe seem to be far less frequently hired to take care of children (5%; average 17%; a sharp difference that could be explained by the employers’ desire of hiring in such cases a native Portuguese-speaking person). Portuguese people report less frequently
that they have to take care of dependent people (8%; compared with values above 14% for other nationalities). People from Eastern Europe seem not to have an appropriate profile for being hired as all-rounders (11%; average 19%), perhaps, again, because tasks of the all-rounders often include care of people, which requires good language skills.
Some relations seem also to exist between the nature of the tasks and the age. Two relations are quite easy to interpret: to take care of children, the preference seems to be given to workers between 30 and 40 (20%; average 17%); to take care of dependent persons, to workers between 50 and 60 (14%; average 10). Children are handed over to people who are about as old as their parents; older people are preferred to take care of dependents, even if in an age warranting sufficient physical fitness. Two relations are not so easy to interpret, even if they are worth a mention: people which activity includes the preparation of meals, not having to care for people, are more numerous among the oldest interviewees (21%; average 13%); all-rounders are preferably hired among the younger people (23%; average 19%).
Analysing the relationship between social status of employers and the nature of the tasks reveals three almost linear correlations. The higher the social status of employers, the more probable it is for the employee to have to take care of children (the proportion goes from 6 to 31%). Conversely, the lower the status, the more probable it is to find workers with dependent people in charge (0 to 26%). Admittedly, where kindergarten and schools exist, employers will require their employee to devote time to children only if there is a comparatively high income available to pay this additional working time. On the other hand, financial resources may allow families with a higher social standing to place dependent relatives in institutions, which is in Portugal a costly option. For less wealthy families, the contracting of a – preferably non Portuguese – carer is one of the few affordable options (as we saw, among the interviewees, immigrants are overrepresented in the category of the carers). There is no obvious explanation, however, for a third, statistically quite obvious, relation: the higher the social status, the higher the probability of hiring an “all-rounder”. One interpretation could be that families with sufficient financial resources try to hire a person they trust, under financially favourable conditions, to take over a particularly heavy and diverse workload.
Workers who have to care for dependent people have a slightly higher level of schooling. An important proportion of workers having among their tasks to take of animals and plants went to school for more than 12 years. This figure is due to the overrepresentation of people from Eastern Europe among workers with this activity profile.
A third variable characterizing the work is the average duration of the employment
relationship they had over their career. This duration was estimated on the basis of
three answers to the questionnaire: how long do they work in this type of activity (A; question A5); in how many houses have they worked since the beginning of their career (B; question A7); in how many houses do they work for the moment (C; question A10). The estimated average duration was calculated on the basis of the following formula: [Estimated average duration of employment relationship = A/B*C]. For the construction of the following tables (in other analytical operations we shall calculate means), five categories were distinguished: less than one year (72 /
11%), 1-3 years (160 / 25%), 3-5 years (133 / 21%), 5-10 years (155 / 24%), and more than 10 years (119 / 19%).
Logically, shorter durations are to be found among younger and immigrant people. As far as the socio-economic status of the employers is concerned, the most significant data is the shorter average duration in the case of people employed in middle class houses without office (clearly above the average in the 1-3 years category; clearly below the average in the More than 10 years category). Longer durations are to be observed in houses of lower socio-economic conditions, and in middle-class houses with office. Statistically noteworthy is the fact that houses of lower social category are clearly underrepresented, houses of the higher category overrepresented precisely in the category of medium duration (3-5 years; 15% and 27%, for an average of 21%). There seems to be a quite strong negative correlation between the average duration of employment relationship and the duration of schooling. The higher the level of schooling, the shorter the average duration of employment.
B. The reality of domestic work (dependent variables)
Tables 1.1 until 3.1 present the answers of the interviewees to the questions addressing their work experience, the problems they encountered, and the way they reacted to these problems. We start with those answers more immediately related to their life experience and less conditioned by official criteria of appreciation (Tables 1.1-1.3); in a second step, we analyse answers that allow us to detect signs of violations of the applicable official rules (Table 2.1), independently from the personal appreciation of the interviewees. Finally, we analyse the way they relate to the law and to official policies and measures, and what legal steps they have undertaken when it was the case (3.3). By adopting this order of discussion, we try to follow, as far as possible, a basic rule of socio-legal research that has been formulated in particular in the context of researches based on direct observation: not to let legal concepts shape / bias the perception of the researcher at the moment she/he gathers data on the field (Hawkins, 1984). The underlying hypothesis is that most of the time our visions of social reality are not shaped by legal categories, and that the use of such categories makes the researcher running the risk of developing a legalistic account of social reality, not paying adequate attention to the way the lay people construct the social world in which they participate.
Indeed, we are here working on answers given to a pre-formulated questionnaire. But this questionnaire was not formulated by jurists; and it places questions of legality after having tackled most of the relevant questions regarding the nature of the work, and the people’s appreciation towards this work. Several questions open up a rather broad scope of answers, and many open ended questions allowed the interviewees to give voice to their own perception of things.
In the last section of this document (D), after having tackled the more narrowly speaking legal aspect of domestic work, we shall proceed the other way round and, starting then with the law, ask how the law, and more precisely the law as concretely
practiced in context, is likely to be used – or better used – as a means of protection of domestic workers.
a) Experiences of discomfort (Table 1.1)
The questionnaire includes a set of questions inquiring the interviewees’ level of regarding several specific aspects of their work (D5). Part of these questions may be related to another set of questions, placed at the beginning, about the motives of leaving a house where they worked for some time. It makes sense to join the answers to these two questions: a motive for leaving a house may be presumed to be a motive of dissatisfaction. On a first level of analysis, the comparison between the two types of answers (dissatisfaction toward some aspect / motive of leaving a house) allows us to appreciate the consistency of our data. Indeed, the two types of variable behave in a similar way; and where we find differences, there also are plausible explanations for them. But the comparison also informs us about the attitude of people towards troublesome situations. One may leave, or tolerate. This second level of analysis will be discussed later on, in the context of the interviewees’ reactions towards the situations they face.
Four motives of dissatisfaction are considered. In decreasing order of the number of “not satisfied” answers, these motives are – insufficient salary (29% not satisfied), – amount of work (18%), – nature of the tasks (5%), – difficulties in the relations with other people in the house where they work. On this last point, we take advantage of the answers to three questions: quality of the relationship with employers (C4), quality of the relationship with colleagues (C8), and satisfaction with work environment. There were no answers “not satisfied” on the questions concerning the two concrete relationships; the proportion of people dissatisfied with the work environment is low (average of 2.2%). The proportions of answers “left house for this reason” are: – insufficient salary (29%), amount of work (16%), difficulties in the relations with other people (14%), nature of the task (7%).
The two main problems faced are, not surprisingly, low salaries and a heavy workload. The nature of the tasks is considered as a problem in a much more limited number of cases. This corresponds to information collected in the course of in-depth interviews carried out within the framework of this project: at several occasions, interviewees reported the pleasure they had in the nature of their work; in the pleasure they could have in looking at rooms or things they had neatly cleaned up.
More intriguing are the answers concerning relational problems. There are troubles of this nature, which is revealed by the proportion of cases in which they led people to leave their employers. However, when questioned about their level of satisfaction in the relationship with employers or with colleagues, interviewees never answer they are “not satisfied”. Signs of relational troubles, however, can be detected through the analysis of other answers. One question invites interviewees to apply different qualifications to the relationship to their employers (C3). One of these qualifications is “A relationship of conflict”. A very small number of interviewees accept it as appropriate (1.3%). As far as the relations with the colleagues are concerned, one data seems to be worth being considered: several people, who reported to work in a house
together with other employees, did not answer the question about the quality of the relationship with their colleagues (on a scale from “very good” to “very bad”). While this can be in some cases a simple failure in the completion of the questionnaire, it also could correspond to situations in which the interviewee refused to qualify this relationship, which may be considered as a sign of an uncomfortable relationship. The difference between the answers on motives for leaving a house, and the answers on the relationship’s quality, reveals most probably a strong norm of discretion toward what goes on in the house of employment, and of loyalty toward people in that house. An alternative explanation – people interviewed currently feel comfortable with other people in the house where they work, and former troubles were solved by leaving the houses where troubles were experienced – could explain a low number of “not satisfied” answers on these items, but not the complete absence of such answers. Both scales proposed in the questionnaire for the assessment of the relationship with employers and colleagues include a level “Reasonable”. This answer could obviously be used by a person wishing to avoid a negative answer, but in reality experiencing troubles. However, this is certainly not always the case. There are also people who use this level just to indicate a really “reasonable” quality of relationship, for example simply because the relationship is not too “personal”.
Considering from now on only the answers about the level of satisfaction, let us comment the possible impact of the nationality. The answers of Brazilians and people from African countries show a higher average level of dissatisfaction, those of people from Eastern Europe the lowest. The proportion of people from Eastern Europe “not satisfied” is the lowest on all items. The most notable difference concerns the amount of work (9%; average 18%). The proportion of “not satisfied” Portuguese workers is generally low too, with the exception of precisely this item, the amount of work, where they reach the highest score (19%). Brazilians are, more frequently than others, not satisfied with the salary (41%; average 30%); workers from African countries with the nature of the task (9%; average 5%).
Interviewees until 30 show the highest proportion of “not satisfied” answers on all items; interviewees above 60, the lowest. The scores of the three intermediate age categories somehow contradict this order. The younger (30-40) seem to be globally more satisfied than the older (50-60). A possible explanation of this behaviour could be the fact that, after a first period of deception, expectations are adapted to the job, while there still remain some perspectives of social mobility. Later on, while such perspectives were frustrated, or seem to become less probable, the level of dissatisfaction increases again. In later years, however, people become more tolerant again. Or their employers become less demanding, because they got old too, or else because they recognize that one should not address too heavy demands to older people.
The data here collected reveal a clear linear relationship between the workers’ level of satisfaction and their employers’ social status. But this relationship has two opposed directions. As far as salary, nature of the tasks, work environment, and quality of the relationship with the employers is concerned, the higher the status of employers, the
lower the proportion of dissatisfied answers. As far as the amount of work is
concerned, we observe a reverse trend: the higher the status, the higher this proportion.
There is no obvious relationship between the levels of satisfaction here discussed and the level of schooling.
There are considerable differences between the places of interview as far as the proportion of “not satisfied” answers is concerned. The highest proportion is to be observed in Alentejo; the lowest – only a few “not satisfied” answers – in Algarve. We find comparatively high scores in Braga and Oporto, and low scores in Coimbra and Lisbon.
The level of satisfaction in relation to the topic here considered – salary, amount of work, nature of tasks, relationship with other people – seems also to vary – even if in more modest proportions than in relation to the other independent variables here considered – according to the number of houses where the person works at the same time. Three levels may be distinguished: the highest number of “not satisfied” answers is reached by people working in only one house (except on the question of the salary, where the highest score is reached by those working in two houses); the lowest by those working in three or more houses; intermediate numbers by those working in two houses. A plausible explanation of this behaviour could be the following: if a person works in different houses, negative experiences suffered in one house may be compensated by the more rewarding ones made in other houses. People who work in several houses at the same time may also be in better condition to leave a house where serious problems were encountered, while she continues to work for other houses. Both explanations require some ability of the person to move from one house to another one, and also to combine properly different commitments. A person who works in three or more houses might be presumed to have such competences. Differences in the nature of the tasks seem to have a rather strong impact on the levels of satisfaction here under analysis. We find important differences between the average proportions: highest score for all-rounders, lowest for those who only work in cleaning activities. All-rounders do give, in a high proportion of cases, “not-satisfied” answers to almost all questions here considered. Higher proportions are attained by other categories in two cases: the nature of the tasks, in the case of those who have to take care of children; the relationship with employers, in the case of those who have to take care of dependent people. At the other end of the scale, let us note a remarkably low proportion of interviewees “not satisfied” with the nature of the tasks among those hired for cleaning and preparing meals, with no care of people; and the absence of answers “relationship of conflict with employers” in this same category, as well as in the category of people working in cleaning activities only.
The relationship between satisfaction on the items here considered and average duration of the employment relationship could be described in the following way: the highest scores are related to the shortest duration (less than one year). This figure may be interpreted in two distinct ways. On the one hand, there is – as we could see in the analysis of the independent variables – a higher proportion of young people in this category, and we could see that younger people tend to give more frequently “not satisfied” answers. On the other hand, short employment duration may indicate frequent troubles encountered. Even if these problems were somehow solved by leaving the house, they may impact on the job’s evaluation. Medium average durations (3-5 years) seem to correspond to somehow lower proportions of “not satisfied” answers. Perhaps we have here another sign of the positive impact of the
fact that a person is in condition to move from one house to another in order to optimize her working conditions.
b) Specific situations encountered (Table 1.2)
Interviewees were confronted with a set of fifteen problematic situations they could have encountered, and had to answer if “yes” or “no” they did experience such situations (question G4). A last question – “Other situations?” received almost no answers (two in Portugal), which indicates that the list of questions can be considered as appropriate.
In a first step, the answers were submitted to a principal component analysis (see Annex 2) in order to detect possible similarities in the behaviour of groups of these variables. This analysis led to the identification of four groups of situations: – (i) related basically to issues of money (benefits not paid; social security contributions not paid; unpaid overtime; wage arrears); – (ii) indicating excessive demands from the employers (denial of rest times; tasks demanded that were not originally agreed; obligation to perform a task against will; denial of vacations); – (iii) forms of violence (physical violence; sexual harassment; psychological violence; discrimination); – (iv) violations of basic legal rules protecting workers (personal documents taken away; prevented from joining social organization). One item proved to be difficult to include in one of these groups in particular: the fact that the domestic workers suffer lack of food. In the table, the situations were grouped according to these four categories, and average levels of responses were calculated in each of the four groups.
The general proportion of people having experienced the situations considered varies from almost 50% (unpaid overtime) to close to 1% (physical violence). The four groups differentiated correspond to four different levels. Issues of money can be considered as frequent (average of 39%). About one sixth of the interviewees have been confronted with excessive demands (around 15%, with the exception of the item “tasks demanded that where not originally agreed”, with a significantly higher proportion, similar to the first group: 35%). The category of the violence is more heterogeneous in terms of frequencies. It ranges from 13% (cases of discrimination) to 1,3% (physical violence). Cases of violations of basic workers’ rights are rare (around 1% of the interviewed population concerned).
Considering the answers received, we could make the following general assessment: domestic workers frequently meet problems related to the lack of payments from the part of their employers; serious excesses in their employers’ demands of are less frequent, even if they are faced by a significant proportion of interviewees. A comparable proportion faces problems of discrimination. Cases of violence and of gross violation of rights are relatively rare.
A crucial question is whether our sample allows us to generalize these proportions to the whole population of domestic workers in Portugal. The diversity of the situation captured by the questionnaire and the plausibility of other answers allows us to admit some correspondence between our figures and reality. However, as far as violence and gross violations of rights are concerned, we are allowed to presume that people who
suffer such situations had less probability to participate in the social networks that permit us to find our interviewees. At least on these questions, the proportion verified in our survey is most probably below the real level of frequency. This brings us to the following global picture: a world where the major problems concern money; where abuses from the part of employers exist but do not correspond to generalized practices; where violence exists, in a limited, but appreciable number of cases.
The frequency of the situations here considered varies strongly according to the nationality. Two groups can be formed: on the one hand, people from Brazil and Eastern Europe, with higher scores in the three main categories of situations; on the other hand, people form Portugal and from African countries, with lower scores. In the first group, the levels are comparable, with the following exceptions: people from Brazil suffer more frequently non payment of social security, denial of vacations, and physical violence; people from Eastern Europe, non payment of benefits, obligation of performing a task against their will, psychological violence. We do note that the two latter situations relate to the experience of psychological constraint. Among Portuguese workers, the proportion of people suffering the situations mentioned is considerably lower than in the other categories, except regarding the “tasks demanded originally not agreed”. The order of the countries in the fourth category – violation of rights – is different: here Brazil has a considerably higher score than all three other nationalities, and workers from African countries are more concerned than those from Eastern Europe. Generally, the proportion of “yes” answers of African workers is remarkably low, compared with the remaining immigrant population. We will have to come back to this difference.
The relationship between the frequency of the situations considered and the employers’ social status is not easy to describe, even if some quite visible relations exist. In general terms, with one only exception, people employed in houses of upper socio-economic conditions seem to be clearly less exposed to these situations than others. The exception is psychological violence, where the highest proportion of situations reported concerns this social category (20%, against about 10% in all other three categories). On the other hand, the lower the social status of employers, the more probable it is for workers to report physical violence and sexual harassment. The distribution of cases in the two first categories – issues of money and excessive demands – varies in a more limited measure according to the social status of employers. However, issues of money are slightly more frequent among people working in middle class houses without office, and excessive demands in middle class houses with or without office.
Rather surprisingly, people with the longest school career (more than 12 years) appear to be clearly more exposed to the situations here discussed than all other categories. This relates to the fact that Brazilians and people from Eastern Europe – also more exposed categories – are overrepresented in this category. But comparable figures are to be found in the table presenting only the scores of Portuguese citizens (1.2-C [PP]). One reason could be that people with this level of schooling are particularly well placed to identify such situations and willing to report them.
Similarly to what could be observed in terms of levels of satisfaction, the situations here considered are much more frequently reported in Alentejo – with the exception of those we named “excessive demands” – than in the other regions, less frequently in Algarve. Another place where the proportion of “yes” responses is particularly low is
Coimbra. Lisbon is clearly above the average in matters of money and of excessive demands. This is worth being noticed, since Lisbon hosts the major part of interviewees. Even a small difference to the mean value of a variable in the case of this city means a considerable difference to the other places.
The impact of the number of houses on the frequency of the reported situations varies considerably according to the groups of situations. In the case of issues of money, there seems to be a linear relationship: the higher the number of houses where someone works, the higher the probability of facing such issues. The relationship is less clear in the cases of excessive demands and violence. In the cases of excessive demands, there is an amazing proximity between the high scores of the two extreme cases – only one house / four or more houses. This could be explained as follows: at one extreme, an employer who knows to be the only employer of a domestic worker may demand more than it is appropriate, on the one hand because he/she assumes that no other commitments limit the worker’s availability, on the other hand, because he/she may calculate that the employee will estimate as difficult the search for other employers. At the other extreme, somebody working for many employers runs a higher risk of her different employers not having an overview on her commitments, therefore requiring her to do more than it is feasible, and simply a higher risk of not being able to maintain a sound management of her many commitments. Finally, cases of violence seem to be as probable in all categories. Indeed the causes of such cases seem to have little to do with the number of employers. The two possible factors here compensate each other: somebody working in many houses may run a higher risk of meeting an employer capable of violence toward the employee; on the other hand, he/she is also in better condition to switch to another employer at the first signs of probability of violence from the part of the employer.
Concerning the relationship between the probability of the situations considered and the activity profile of the domestic workers, four relations are worth being emphasized. Firstly, those workers hired for cleaning and taking care of plants and animals seem to be significantly more exposed to issues of money than the other categories (an average level of 50%, to be compared with a general average of 39%). Secondly, according to the figures gathered in the table, workers caring for a dependent person are much more exposed to forms of violence. In the category of excessive demands, there is no such a clear relationship dominating the picture, but – thirdly – all-rounders, and – fourthly – people having to care for dependent persons, attain indeed higher scores than the other categories.
The two latter relations may be explained simply by the nature of the activity. An “all-rounder” is per definitionem more exposed to face demands originally not envisaged, or to be obliged to do something she initially would have refused to do. A person who has to care for a dependent person is probably more exposed, given the constant demand of attention from the part of the dependent person, to have to renounce rest times or vacations. As far as the second relation is concerned, there is also an obvious explanation based on the nature of the tasks, which is confirmed by the table: to take care of a dependent person creates a high probability of situations likely to be qualified as “psychological violence” (17%, average: 10%).
Beyond this last point, the two relations mentioned first hardly can be explained by the nature of the work itself. Here other variables have to be considered. And there are indeed variables likely to explain these relations. Workers who have to care for
animals and plants are demanded in particular by middle class houses without office (table 0.1), and this is precisely the social category of employers to whom issues of money seem to be, statistically, stronger related. The relation between “carers” and “forms of violence” is more difficult to explain. But there are two possible “intermediate variables”. On the one hand, “carers” are more frequently demanded by houses of more modest socio-economic conditions, and forms of violence seem to be slightly more associated to this social status of employers than to others. On the other hand, “carers” are more frequently hired among Brazilians (table 0.2: 17% with this activity profile; average 10%). And Brazilians report more cases of violence than workers of other nationalities.
The frequency of the situations here discussed also varies according to the average duration of the employment relationships, even if not in a measure comparable to the impact of other independent variables. Interestingly, almost all situations are more frequently experienced where the duration of employment is between 1 and 3 years. The lowest figures are in many cases related to the longest (more than 10 years), and in some cases to the shortest durations. The only situation that differs from this pattern is the denial of rest times, where the highest figure corresponds to the longest and shortest employment durations. A plausible explanation of the more general behaviour – low figures at the extremes; highest figures related to the duration of 1-3 years – is that workers stay in the same houses for a very long time if they feel at least some comfort there. Conversely, where people stay only for very short periods in the same houses, there is little time left for the situations here considered to happen.
c) Global level of satisfaction (Table 1.3)
Several questions allow us to reconstruct the general image domestic workers have about domestic work, as well as their global satisfaction in the job. It seemed advisable to analyse the answers to these questions after those on the satisfaction on specific aspects, and on concrete specific situations encountered. Thus we will be in condition to appreciate, not only the general attitude toward this work, but also the way this attitude is constructed, on the basis of more specific experiences. In the framework of a research aiming at identifying the problems faced by domestic workers, in order to find ways to give them more instrumental means to cope with these problems, our first interest was to locate the cases of general dissatisfaction. The interviewees had to indicate their general level of satisfaction with their job on the following scale: “Very pleased” / “Satisfied” / “Not very satisfied” / “Not satisfied at all” (D6). The number of very negative answers is extremely low (5 answers; less than 1%). These few answers will not be analysed separately but merged with the answers “Not very satisfied” (8%; 55; both categories merged: 8,8%). This figure is similar to the proportion of cases likely to be qualified as violence (average proportion of 7,5%), discussed in the previous section. A plausible proximity: the number of workers openly reporting to be satisfied with their job corresponds in some extent to the number of people experiencing, or having experienced, very serious troubles with their employers.
In order to appreciate the consistency of the data, we compared the level of general satisfaction with the job with the answers to the different specific motives of (dis-)satisfaction (question D5, already discussed in section a). In this sense, we considered the cases of people declaring to be “not satisfied” with at least three of the six aspects listed in the questionnaire. 6% of the interviewees correspond to this criterion. In other words, the answers do focus, in most of the cases, on only one or two aspects. The behaviour of this recalculated variable is very similar to the one of the answers on the level of general satisfaction.
The level of general satisfaction measured by the question where it is addressed directly is fairly high. However, the answers to the question “Would you change for another job?” oblige us to mitigate the notion of a globally positive attitude of domestic workers towards their job: almost two thirds of the interviewees (62%) would like to change. Even if part of those who give this answer simply are pleased to change from time to time their occupation, whatever it is, there is probably a high proportion of people who want to change because they do not like the job. The proportion here encountered is actually significantly higher than the one of “not satisfied” answers on specific aspects (highest score for “not satisfied with the salary”: 29%), and higher than the proportion of people who saw themselves confronted with what we called in the previous section “issues of money” (39%). A simple interpretation of these figures is that the concrete material aspects of their job do not, as such, offer a sufficient explanation of the desire of domestic workers to change their job. One possible additional reason is the public image of this kind of work. Indeed, 55% of the interviewees answer “No” to the question “Is domestic work well regarded?”.
The questionnaire includes a set of questions aiming at reconstructing the interviewees’ image of domestic work3. Interviewees were confronted with a set of statements and had to tell us whether they considered them right or wrong. Three statements could be considered as corresponding to an image of the job linked to some degree of dissatisfaction: “a lonely/solitary work”; “a precarious work”; “A work involving some danger”. The proportion of approvals to the first two statements is comparable to the proportion of “No” answers to the question of the positive image of domestic work (59% and 52%). Not surprisingly, it is lower toward the statement “Domestic work is a dangerous work” (36%).
One more question (F6) deserves to be discussed in this section: “Remaining as a domestic worker, would you prefer (a) to work directly in private households? (b) to work in private households through a domestic cleaning company?” In addition to these alternative answers, they were invited to justify their preference. Interestingly enough, this open-ended question triggered a huge number of substantial responses (and this after about one hour of the questionnaire’s application), revealing a particular interest for this issue from the part of the workers interviewed. As already mentioned, only a very few number of interviewees do work for cleaning companies (6; 1%). Among the others, who currently work directly in private households, an overwhelming majority (89%) prefers to continue working under these conditions. Even so, a significant number would like to switch to a cleaning company (10%). This
3
For a specific analysis of this aspect, see the chapter of the book in preparation drafted by Vanessa Blétière.
answer may have quite different meanings, but it seems legitimate to admit that it indicates a certain level of dissatisfaction with the current state of affairs.
The crossing of the variables now introduced with the interviewees’ nationality leads to several interesting findings. There are differences in the general level of satisfaction. The highest proportions of “not satisfied” answers are to be found among workers of Eastern Europe (12,3%), the lowest among Portuguese (7,9%) and Brazilians (8,4%). People from African countries are in between these two levels (10,6%). Workers from Brazil and from Eastern Europe do give the highest number of “Yes” answers when questioned if they would like to change for another job (77 and 75%, average 62%). This confirms what we learned from the study of recent migrations in Europe. Domestic work is an opportunity for migrant women to enter the labour market via one of its least formalized sectors, being the prospect of those migrants who engage in this activity to switch as soon as possible to a more qualified one. At the other end of the scale, the lowest proportion of people interested in changing is to be found among Portuguese workers (57%). People from Eastern Europe are less than others inclined to consider domestic work as dangerous (25%; average 36%), Brazilians are the most inclined to consider it as solitary (63%; average 52%). Among other less noticeable differences, workers from African countries are proportionally more numerous to perceive a negative public image of the profession, than it is the case for other nationalities (59%, average 55%). On the other hand, there is a huge difference between the answers of workers from African countries and those of other interviewees regarding the issue of cleaning companies. African workers are far more numerous to indicate a preference to be employed by a company (22%, average 10%).
There seems to be quite a strong correlation between the general level of satisfaction and the interviewees’ age: the younger, the higher the probability of answers indicating dissatisfaction, desire to change for another job, and perception of a negative public image of the profession. Younger persons are also more interested than others to be employed by companies (20%, average 10%). As far as representations of the job are concerned, there is a clear cross-cutting difference between the oldest category (60 and older) and the others in the level of acceptance of the statements proposed. While a majority of interviewees of the other age categories consider as true that domestic work is precarious and lonely (with only one quasi exception: 48% of people between 41 and 50 consider it as a lonely job), only a minority of older people adhere to those statements (38% / 35%).
The impact of the employer’s social status appears to be weaker than the one of age or nationality of interviewees. People working in middle class houses without office are slightly more inclined than others to consider themselves as “not satisfied” with their job. A similar difference is to be found in the answers on the questions “Would you change for another job?” and “Domestic work, a precarious work?” On the same variables, the lowest scores are related to people employed in houses of upper social status. A linear relationship exists between the employer’s social status and the perceived public image of domestic work. The higher the employer’s status, the more probable it is to receive a “No” answer on the question “Is domestic work well regarded?” (63%, average 55%; proportion at the other end of the scale: 49%).
The correlation between the variables here discussed and the level of schooling is strong. People with higher level of schooling report more frequently than others general dissatisfaction, desire to change the job and so on.
The general level of satisfaction varies according to the place of the interview. Highest scores are to be found in Braga; lower ones in Coimbra. Nobody answered “not satisfied” in Algarve. The highest proportion of people who want to change for another work, and who consider that domestic work is not well regarded, concerns Alentejo; the lowest scores on these two questions are to be found, again, in the Algarve and in Coimbra.
There is no clear relationship between the discussed variables and the number of houses where a person works. One remarkable figure, however: a quite low proportion of not satisfied persons among those who work in two houses (4,8%, average 8.8%). The highest proportion is to be found among those who work in only one house (11,7%). This confirms the hypothesis that people who work for different employers have better conditions to take advantage of this kind of professional activity, even if the difference between the categories “working in two houses” – lowest level of global dissatisfaction – and “working in three houses” – lowest level of dissatisfaction with specific aspects – remains to be explained.
The activity profile seems to cause important differences in the general level of satisfaction. Less satisfied are those who have to take care of children (12,3% of “not satisfied [at all]”, average 8,8%); more satisfied those who have to take care of animals or plants (6,7%), and all-rounders (7%). Those who have to take care of dependent persons are less prone to change to another job (54%, average 62%), and have a more positive notion of the public image of domestic work (47%, average 55%). The highest proportion of people considering that domestic work is not well regarded is to be found among domestic workers in charge with animals and plants. In the same category, we also have the lowest responses to the questions “domestic work: a dangerous work?” and “Would you prefer to work for a cleaning company?” The highest proportion of “Yes” answers to this last question is to be found among workers hired only for cleaning. Not surprisingly, a higher proportion of workers hired only for cleaning, and of those hired for cleaning, as well as to take care of animals and plants, accept the statement “domestic work is a solitary work”. All other activity profiles include tasks to be performed in direct personal contact with people. There is a strong linear correlation between the level of general satisfaction and the will to change for another job, on the one hand, and the average duration of employment, on the other. The shorter this duration, the higher the proportion of people “not satisfied”, and the higher the proportion of people desiring to change. On the long run, so it seems, a relationship of trust with employers is likely to counter-balance the discomfort domestic workers feel toward their occupation. However, we should not forget here the probable impact of nationality. Portuguese workers are far more likely to work since 10 years or more for the same employers. As it appeared here, Portuguese workers tend to give less frequently answers corresponding to feelings of dissatisfaction.
d) Work experiences of the interviewees – A general assessment
It is now time to attempt a summary comparison between the three tables analysed up to now: concrete motives of (dis)satisfaction, situations encountered, and general level of (dis)satisfaction. Four variables deserve a special comment.
As far as age is concerned, three types of impact may be distinguished. The impact on the variables indicating the general level of satisfaction is strong, and in several cases linear. The impact on the level of satisfaction regarding more concrete aspects is less visible. The impact on the probability of being confronted with certain situations is weaker, clearly visible only in the case of discriminations. A possible interpretation of this general assessment is the following. Age might have an influence on what happens concretely to people, but this influence is weak, and concerns specifically certain types of situations. On the other hand, the general appreciation of our own life or work conditions depends heavily on a set of subjective criteria that are likely to depend on the age (the older the more tolerant towards deceptions) or on the generation to which we belong (the expectations of comfort are presumably higher among people grown up in recent decades than among those who were exposed to the more demanding life conditions in the first years after World War II). Between these two types of impact – low on concrete situations; high on the general feeling of satisfaction – we may expect an intermediate level of impact on the appreciation of concrete aspect of the work situation. The concrete problems (salary, amount of work, type of tasks, and so on) are to a limited extent related to the age, but the relationship is neither necessary nor linear, and the criteria of appreciation, since they address a specific aspect of reality, are less related to general dispositions of the person concerned toward her social environment. This interpretation also could be applied to the impact of the level of schooling.
The impact of nationality is much more complex and difficult to interpret. Generally, Portuguese workers seem to meet fewer difficulties, and to be more satisfied, in general as well as in particular terms, with their life conditions. This confirms the notion according to which non nationals are socially more vulnerable than nationals. The other three groups of nationalities here considered show three quite different statistical behaviours. Let us, for the moment, describe them. A tentative interpretation of the differences will be attempted later on in this document.
− Brazilians are frequently confronted with problematic situations; they frequently
qualify themselves as “not satisfied” in relation to specific aspects of their work,
and they frequently indicate they would like to change for another job. But their
level of general satisfaction is comparatively high.
− Workers from Eastern Europe are exposed to problematic situation in a measure
to a large extent comparable to Brazilians. But, on the one hand, they seem to be more satisfied with specific aspects of their job, and, on the other hand, their level of general satisfaction is comparatively low.
− Finally, people from African countries seem to find themselves less frequently
confronted with problematic situations. But they are less satisfied with specific aspects, in particular with the nature of tasks and with the relationship with the
employers, and show a fairly high proportion of persons “not satisfied” in
general terms with their work.
The employer’s social status has on many variables a rather unpredictable impact. However, three comments can be formulated. Generally, people working in houses of higher social standing seem to work under better conditions, and to be more satisfied with their job, in general, and as far as particular aspects are concerned. In contrast to this general profile, under some specific aspects, people employed in such houses seem to experience particularly adverse conditions. This is the case in all circumstances where the – hypothetically huge – difference of social status between employee and employer plays a role: rich employers are frequently considered as having a negative image of domestic work, their attitudes are frequently experienced as discrimination; they are in condition to require a heavy amount of work.
One correspondence is worth being emphasized: people working in middle class houses without office report a slightly lower level of general satisfaction, and more frequently the desire to change for another job. It is in the same category that we find more people dissatisfied with their salary, and facing issues of money (unpaid benefits, etc.). Finally, this other correspondence: the comparatively highest proportion of conflicts with employers is to be found in houses of modest social condition. It is also in these houses that, according to our figures, more cases of physical violence are reported. This correspondence cannot be ignored, since the differences, compared with other categories of employers, are in both cases considerable. But it has to be interpreted very carefully. Admittedly, issues of conflict and violence are more likely to be explicitly referred to in certain social milieux, while there are elsewhere stronger norms preventing people from speaking about such issues, especially when they concern the house where one lives or works.
Concerning the number of houses where a person works, we have to notice that people working in two houses experience less frequently adverse situations (apart from issues of money), and answer more frequently that they are more satisfied in general terms. However, the proportion of “not satisfied” answers on specific aspects is comparatively high.
A last comment concerns the activity profile. Here we shall limit ourselves to emphasize the important difference in the impact of this variable on the situations encountered, on the one hand, and on the feelings of satisfaction, on the other. The activity profile is a variable of a special kind. Firstly, we may question to what extent it is legitimate to admit sharp differences between categories. Secondly, we have to recognize that it strongly depends on other variables here included in the analysis. First of all, the employer’s status, then the age of the employee; and, beyond these more obvious relationships, prejudice regarding nationalities, consideration of language skills, local cultural norms, etc. If we globally assess this set of variables likely to condition the activity profile, variables related to the person of the worker appear to be less important than variables related to the employers and to the context of the house. This explains the differences between tables 1.1 and 1.3 on the one hand, and table 1.2 on the other. The variables characterizing the context have, through the activities that they condition, a somehow patterned impact on the objective aspects of domestic work, i.e. on the situations encountered. Their impact on the personality of the domestic worker, which conditions the levels of satisfaction, is