I
DOMINGOS MARIA LISBOA DE LIMA
OGANDO DOS SANTOS
Licenciado em Engenharia e Gestão Industrial
Lean Performance Measures in a
Supply Chain
Identifying Lean supply chain measures: a case study in the WPC industry
Dissertação para obtenção do Grau de Mestre em
Engenharia e Gestão Industrial
Orientadora: Maria Rosário Cabrita, Professora Doutora,
FCT/UNL
Júri:
Presidente: Prof. Doutor Rogério Salema Puga Leal Arguente: Prof. Doutor António Carlos Bárbara Grilo Vogal: Prof. Doutora Maria do Rosário de Meireles Ferreira Cabrita
III Author: Domingos Ogando dos Santos
Title: Lean Performance Measures in a Supply Chain
Institution: Faculdade de Ciências e Tecnologia da Universidade Nova de Lisboa
Place (local): Lisboa
Year: 2013
Address: DEMI – FCT – UNL, Quinta da Torre, 2829-516 Caparica, Portugal
Copyrights: Domingos Ogando dos Santos, Faculdade de Ciências e Tecnologia da Universidade Nova de Lisboa, Universidade Nova de Lisboa
I
ACKNOWLEDGEMENTS
This dissertation’s execution and conclusion would have been impossible to accomplish without support from various entities.
I would like to thank Professora Maria do Rosário Cabrito for her guidance throughout this study. I owe sincere and earnest thankfulness to Dra. Maria Duarte for her bibliographical skills and patience.
I would like to show my gratitude to the Tecnodeck staff for the opportunity to study the product. Special thanks to Mr. José Santos, his patience and availability to clarify matters regarding the product and the company.
I am indebted and thankful to my family for their support throughout this long ordeal.
III
ABSTRACT
In the existing global economic context it is crucial that companies understand the importance of the supply chain, so that they can maintain their respective competitive advantage. Several of the supply chain’s approaches consider the customer and the definition of value as key features.
One easily associates the Lean philosophy to supply chains, with its basis of continuous improvement and elimination of waste. Companies which employ this philosophy begin with lean thinking, which highlights the customer and the definition of value. Therefore it is vital that companies identify what constitutes added value to the customer.
Thus we arrive at the reasons which have led to the creation of this dissertation. The motivation concerns the small amount of data found upon reviewing the existing literature of the application of Lean philosophy to the Wood-Plastic Composite Industry (WPC). Consequently the study’s main goal is the identification of Lean performance measures.
This dissertation contains concepts of Lean philosophy and strategy to provide background for its practical part, after which, we explain the applied methodology: identification of the performance measures, application of strategy analysis tools, the development of a survey and its statistical treatment and finally interviews to management.
The results of the surveys have provided results which have helped identify the most important categories: time and flexibility; and the most relevant performance measures. The interviews’ results provided input on management’s knowledge and expectations of Lean, and the discovery of possible areas for improvement.
The major conclusion of this study is the importance given to Lean performance measures in the WPC industry’s context, which can help in the implementation of Lean.
Keywords: Lean philosophy, lean performance measures, lean manufacturing, wood plastic
V
RESUMO
No contexto económico global existente é de grande importância que as empresas percebam a importância da cadeia de abastecimento, para que estas mantenham a sua vantagem competitiva. Várias metodologias para cadeias de abastecimento consideram o cliente e a definição de valor como aspetos fundamentais.
É fácil associar a filosofia Lean a cadeias de abastecimento, com base na melhoria contínua e eliminação de desperdício. As empresas que utilizam esta filosofia começam pelo pensamento
lean, que destaca o cliente e a definição de valor. Logo é importante que as empresas
identifiquem o que constitui valor para o cliente.
Assim chegamos às razões que levaram à escrita desta dissertação. A motivação prende-se com a quantidade reduzida de dados encontrados aquando a revisão da literatura existente da aplicação da filosofia Lean na indústria de materiais em compósito madeira-termoplástico (WPC). Consequentemente, o objetivo principal do estudo é a identificação de indicadores Lean.
Esta dissertação contém conceitos da filosofia lean e de estratégia para facultar o conhecimento para a parte prática. Abordamos de seguida a metodologia aplicada: identificação dos indicadores, aplicação das ferramentas de análise estratégica, elaboração do instrumento de medição e o seu tratamento estatístico e finalmente entrevistas com a gestão de topo.
Os resultados dos questionários ajudaram a identificar as categorias mais importantes, no caso o tempo e flexibilidade e os indicadores mais relevantes. Os resultados das entrevistas, por seu turno, fornecem o input do conhecimento e expectativas do Lean que a gestão de topo
tem, e a descoberta de áreas com oportunidades de melhoria.
A principal conclusão deste estudo é a importância atribuída aos indicadores lean no contexto da indústria de materiais em compósito madeira-termoplástico, que pode ajudar na implementação do lean.
Palavras-chave: Filosofia lean, indicadores lean, manufactura lean, Indústria de materiais em
VII
INDEX
Acknowledgements ...I Abstract ... III Resumo ... V Index ...VII Figure index ... IX Table index ... XI Abbreviations ... XIII
1. Introduction...1
1.1. Framework and Motivation ...1
1.2. Objectives ...2
1.3. Dissertation structure ...2
2. Literature Review ...5
2.1. Introduction ...5
2.2. Strategic Planning...5
2.2.1. SWOT Analysis ...6
2.2.2. PEST Analysis ...8
2.2.3. BCG Matrix ...9
2.2.4. Porter’s Five Forces... 10
2.2.5. Porter’s Generic Strategies ... 12
2.2.6. Balanced Scorecard (BSc) ... 14
2.3. Lean Philosophy ... 16
2.3.1. Lean Thinking ... 19
2.3.2. Waste ... 20
2.3.3. Creation of Value... 21
2.3.4. Flow ... 22
2.3.5. Lean tools/practices and techniques ... 22
2.4. Supply-chain ... 23
2.5. Lean & Supply-Chain Paradigm ... 24
2.5.1. Definition and objectives ... 24
2.5.2. Features ... 25
2.5.3. Implementation... 25
2.5.4. Lean Distribution ... 26
2.6. Lean performance measures ... 27
3. Methodology ... 37
3.1. Validity ... 39
VIII
3.3. Procedures... 40
4. Results and Discussion of the Case Study ... 45
4.1. Characterization of the case study ... 45
4.1.1. Definition, Features and Manufacturing process ... 45
4.1.2. Market and Clients... 48
4.1.3. Strategic objectives ... 48
4.2. Performance analysis... 49
4.2.1. SWOT Analysis ... 49
4.2.2. PEST Analysis ... 52
4.2.3. BCG Matrix ... 59
4.2.4. Porter’s Five Forces... 60
4.2.5. Balanced Scorecard Analysis ... 64
4.3. Lean Performance Measures ... 68
4.4. Survey Results ... 72
4.4.1. Survey Results Commentaries ... 74
4.4.2. Survey Results Statistical Treatment ... 86
4.5. Interview Results ... 98
4.6. Improvement opportunities ... 99
4.7. Strategy formulation ... 102
5. Conclusions ... 105
6. Bibliography ... 107
IX
FIGURE INDEX
Figure 2.1 – SWOT analysis...7
Figure 2.2 – SWOT/TOWS Matrix ...7
Figure 2.3 – Pest Analysis...8
Figure 2.4 – BCG Matrix ...9
Figure 2.5 - Porter's Five Forces Model ... 11
Figure 2.6 – Balanced Scorecard... 15
Figure 2.7 – BSc measures’ drivers ... 16
Figure 2.8 – The seven types of waste ... 21
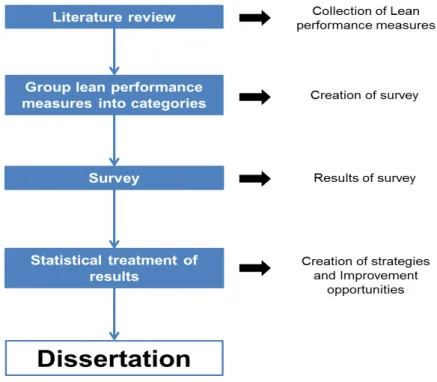
Figure 3.1 – Methodology of dissertation ... 40
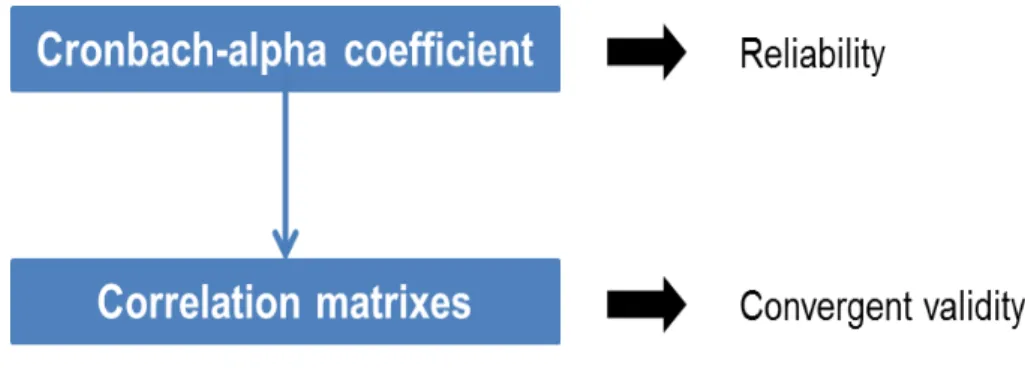
Figure 3.2 – Statistical treatment ... 43
Figure 3.3 – Dissertation results ... 44
Figure 4.1 – “Tecnodeck ALU Panel” ... 47
Figure 4.2 – Italy’s GDP Growth Rate ... 54
Figure 4.3 – Portugal GDP Growth Rate ... 56
Figure 4.4 – Belgium GDP ... 58
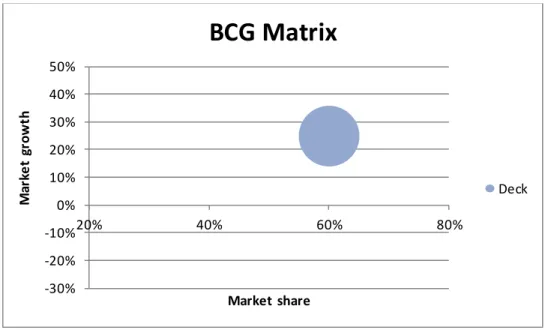
Figure 4.5 – BCG Matrix of Portugal ... 60
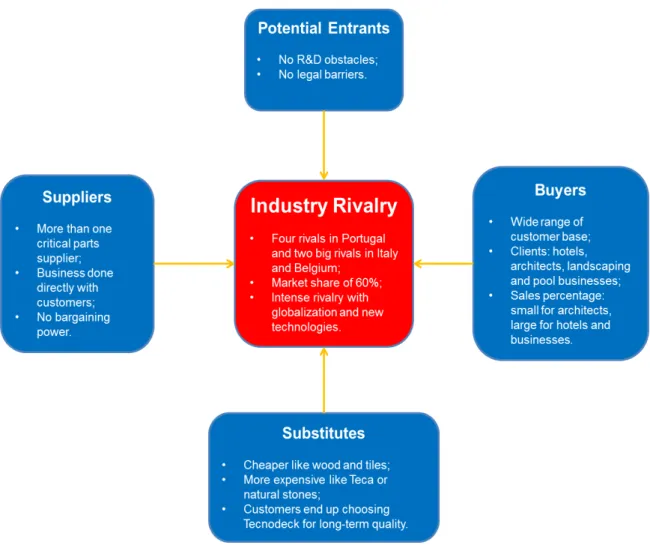
Figure 4.6 – Porter's Five Forces in the WPC industry... 63
Figure 4.7 – BSc applied to Portugal ... 64
Figure 4.8 – Strategic Map of BSc applied to Portugal ... 66
Figure 4.9 – Users’ Age ... 74
Figure 4.10 – Users’ Gender ... 74
Figure 4.11 – Item 4 Order flow time in higher demand season ... 78
Figure 4.12 – Item 5 Order flow time in smaller demand season ... 78
Figure 4.13 – Item 6 Order flow time in higher demand season ... 79
Figure 4.14 – Item 7 Order flow time in smaller demand season ... 79
Figure 4.15 – Comparison analysis of Five Categories ... 81
Figure 4.16 – Comparison analysis of Quality items ... 81
Figure 4.17 – Comparison analysis of Flexibility items... 82
Figure 4.18 – Comparison analysis of Cost items ... 83
Figure 4.19 – Comparison analysis of Time items ... 83
XI
TABLE INDEX
Table 2.1 – Porter’s Generic Strategies... 12
Table 2.2 – Lean attributes ... 17
Table 2.3 – Selected measures ... 28
Table 2.4 – Performance measures related to operational space near lean manufacturing ... 29
Table 2.5 – Performance measures related to lean manufacturing ... 30
Table 2.6 – Lean manufacturing indicators of zero-value activities elimination ... 33
Table 2.7 – Lean manufacturing indicators of continuous improvement ... 33
Table 2. 8 – Lean manufacturing indicators of multifunctional teams ... 33
Table 2.9 – Lean manufacturing indicators of JIT production and delivery ... 34
Table 2.10 – Lean manufacturing indicators of supplier’s integration ... 34
Table 2.11 – Lean manufacturing indicators of flexible information system ... 34
Table 2.12 – Five improvement dimensions' indicators ... 35
Table 4.1 – Tecnodeck’s SWOT analysis diagram ... 49
Table 4.2 – Performance measures table with corresponding authors ... 68
Table 4.3 – Performance Measure Categorization ... 71
Table 4.4 – Questions, Performance measures and Codes ... 72
Table 4.5 – Mean, Standard deviation, Lower and Upper bounds ... 75
Table 4.6 – Items, Item’s values, Means, Lower and Upper bounds and Commentaries ... 76
Table 4.7 – Summary of % Standardized Mean Sum by Category ... 80
Table 4.8 – Highest and lowest scored items of each Category ... 84
Table 4.9 – Top 10 items ... 85
Table 4.10 – Cronbach-alpha Coefficient ... 87
Table 4.11 – Alpha if Item Deleted ... 88
Table 4.12 – Correlation matrix of all items ... 90
Table 4.13 – Quality items correlation ... 92
Table 4.14 – Flexibility items correlations ... 93
Table 4.15 – Cost items correlations ... 94
Table 4.16 – Time items correlations ... 95
Table 4.17 – Critical activities items correlations ... 96
Table 4.18 – Summary of correlations of items per category ... 96
Table 4.19 – Convergent validity of the five categories ... 97
XIII
ABBREVIATIONS
BSc – Balanced Scorecard BU – Business Unit
GDP - Gross Domestic Product JIT – Just-in-Time
SC – Supply Chain
1
1. INTRODUCTION
1.1. Framework and Motivation
In the global economic context it is of the utmost importance that companies understand the influence of the supply chain and its continuous improvement, for maintaining their competitive advantage. There exist several approaches for supply chain philosophies and all these share some features, but it is vital that they recognize the customer and the definition of value in the supply chain.
One easily associates Lean philosophy to supply chains, with its basis of continuous improvement and elimination of waste, this is a popular approach. Companies who employ this philosophy begin with lean thinking, which has great emphasis on the customer, the definition of value and the creation of value. Thus the lean thinking process is essential for companies and is very important in the existing economic situation due to its ability to optimize a company’s processes.
As such, it is important that companies identify what constitutes value to the customer, so that they may create the necessary processes to accomplish added-value and thus even surpass the customer’s expectations. The identification of value is crucial for companies to achieve success. Because if this is not done than lean’s objectives of waste removal and continuous improvement cannot be accomplished.
Considering the application of lean to a supply chain, it is fundamental that companies correctly assess and/or evaluate their performance. In order to accurately measure performance it is very useful to establish a set of measures, designated as performance measures. When these are applied to the lean philosophy, it is fundamental to identify the correct lean performance measures for each situation. As lean contemplates several aspects, it is essential to specify performance measures.
It is crucial that companies improve themselves in order to gain competitive advantage over rivals and present the most attractive offers of services or products to their existing and potential clients, in the existing economic climate. Thus, every company should have the ability to understand its competition and the competitive forces that affect its success. A few key points that should be considered when performing these analyses are: flexibility of resources, product differentiation and choosing the best suppliers; for these can be vital strategies in the pursuit of gaining competitiveness in competitive markets. As such, companies have to assure their customers that their order gets delivered when they want it, how they want it and where they want it. This has to be done while maintaining profit and considering resource planning; but always bearing in mind the customer’s satisfaction and goodwill.
2 is a small amount of data regarding the application of lean in the Wood plastic composite industry and so we have tried to further develop this study.
In order to discover if there are possibilities for improvement, a case study of a company (Tecnodeck) that operates in the WPC industry has been done. Its results are discussed in order to create new strategies, together with the applied performance analysis tools.
1.2. Objectives
After presenting our motivation to write this dissertation, we have to choose which direction to take, which can be accomplished by setting the objectives. The goal of this dissertation is the identification of lean performance measures in a supply chain and based on the literature revision, potential performance measures will be identified.
Considering the dissertation’s goal we can present the main question that the dissertation will try to answer. “How does the wood-plastic composite industry value the identified lean performance measures?” We will try to explain this through the case study’s company evaluation of the identified performance measures.
Several strategic analysis tools will also be employed in order to give a clearer picture of the company’s strengths and weaknesses, and to provide a basis for the creation of future strategies. The analysis tools that will be employed are: SWOT analysis, PEST analysis, BCG Matrix, Porter’s Five Forces and Balanced Scorecard.
A survey will be created to measure the users input regarding the identified performance measures. With these results, strategies can be devised to explore opportunities and gain competitiveness. Employee suggestions, which can help discover underrated or overrated performance measures, will also be taken into account.
1.3. Dissertation structure
In order to provide a framework for the motivation and objectives of this dissertation, it is important to correctly structure it. This dissertation has been structured in the following manner:
Chapter 1 contains the introduction and objectives, where the motivation and scientific interest of this dissertation are presented.
3 Chapter 3 explains the methodology used in this work. Theoretical concepts and methods concerning the case study are explored in the scope of this situation. Surveys were created and delivered to the company in order to gain knowledge of the importance employees give to the lean performance measures.
Chapter 4 is dedicated to the Discussion of the case study. Firstly we explore the five strategic analysis tools; secondly we comment upon the survey’s results and their statistical treatment; thirdly we have the results of the interviews with management and finally we create the strategies for each of the three countries based upon Porter’s generic strategies, results from the survey and interviews with management.
Chapter 5 relates to the conclusions based upon the results of the performance analysis tools, surveys and interviews.
5
2. LITERATURE REVIEW
2.1. Introduction
In this chapter we shall introduce the major theoretical concepts that will help provide a background to the required knowledge of the practical part of this dissertation. Firstly, we present concepts containing several strategic analysis tools: SWOT, PEST, BCG, Porter’s Five Forces and Porter’s generic strategies and the Balanced Scorecard. Secondly we present concepts related to lean philosophy and its features. Thirdly, we present concepts related to the supply chain and the lean & supply chain paradigm. Finally we present concepts related to lean performance measures and clarify this definition. Because when performing the literature revision, we found different terms that relate to the same concept.
These concepts will be aided by figures or tables when necessary, in order to facilitate user comprehension. This chapter can serve as a knowledge platform for the practical part.
We will begin by discussing strategic planning, which is a foundation in the process of developing a strategy.
2.2. Strategic Planning
It is vital for a company to attain success and success can be achieved if the company has an edge over its rivals, be it in product or service; for this allows a company to stay in business and thrive. This edge has to be taken into consideration when developing a strategy; the strategy must make full use of the advantage the company possesses. With a strategy in place, a company will have an advantage over its rivals and thus ensure that it continues to operate. The result of using a company’s advantage in the creation of a strategy is entitled by some as competitive advantage. Competitive advantage happens when a company achieves one of two possible advantages: cost advantage or differentiation advantage; this allows a company to have a competitive advantage over its rivals. The first advantage occurs when the company delivers the same product/benefits as its rivals but at a lower cost. And the second advantage occurs when a company delivers product/benefits that surpass that of its rivals. By having competitive advantage, a company is able to create superior value for its clients and thus potentially earn bigger profits. These are considered positional advantages, as they describe a company’s position in its industry as a leader, in one of the two advantages.
6 success factors, Porter’s diamond, Treacy and Wiersema’s value disciplines and/or the GE/ McKinsey matrix; we have decided to apply the following tools: four strategic tools regarding the industry’s environment (SWOT, PEST, BCG Matrix and Porter’s Five Forces) and one strategic tool regarding the company’s strategy (Balanced Scorecard).
2.2.1. SWOT Analysis
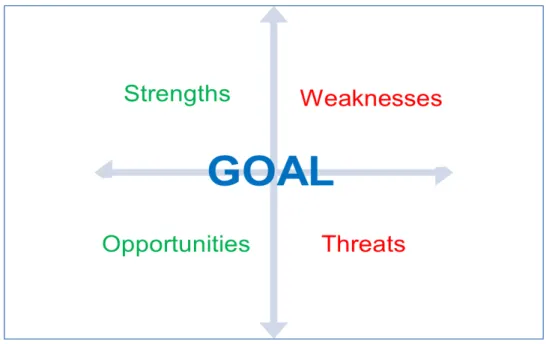
The first strategic tool analyzed is the SWOT (Strengths, Weaknesses, Opportunities, Threats)
analysis since it evaluates the environment where a company operates. It is essential that companies discover about their environment in order to achieve success. We will analyze strategic tools related to the company’s environment first and only after this can we successfully analyze the company’s strategy.
SWOT analysis is one of the most popular strategic tools due to its factors analysis of strengths, weaknesses, opportunities and threats of the environment.
Strengths and weaknesses belong to the internal feature of the environment and show the existing situation of the company. While opportunities and threats belong to the external feature of the environment and show if there are changes in the environment that can affect the company.
The four factors are now described in greater detail:
Strengths – factors that allow the accomplishment of a company’s objectives. Strengths are very important to achieve and maintain success, and thus should be maximized;
Weaknesses – factors that stop a company from accomplishing its objectives. Weaknesses decrease the probabilities of a company’s success and growth, and so they should be minimized and eliminated. A plan to fight weaknesses is vital for the company’s success; Opportunities – factors that a company can benefit from. Companies can gain competitive
advantage through opportunities as long as they can capitalize when these present themselves;
Threats – factor that jeopardize the company’s profit. Threats can be related to weaknesses and are not controllable.
SWOT is thus an important tool when analyzing a company’s strategic positioning and its environment and it allows a company to find out:
What it does better than its rivals; What rivals do better;
7 Figure 2.1 – SWOT analysis
The combination of the four factors showed in Figure 2.1 help devise strategies for a company, as depicted in Figure 2.2.
Figure 2.2 – SWOT/TOWS Matrix
8 constantly adopt the most profitable strategy. The strategies with the mixed factors are shown in Figure 2.2 above and are further described below:
S-O strategies, search for opportunities that are a good match to the company’s strengths; W-O strategies, try to overcome weaknesses to search for opportunities;
S-T strategies, try to identify a way that the company’s strengths can reduce vulnerability to threats;
W-T strategies, try to develop a preventive action for weaknesses, so that these don’t increase the risk of threats.
2.2.2. PEST Analysis
After discussing the SWOT analysis and its evaluation of the company’s environment, it is useful to apply another analysis to the environment to cover eventual gaps.
PEST (Political, Economic, Social, Technological) analysis is a tool that can be used by
companies to get a clearer picture of the environment they work in. It does this by analysing four factors: Political, Economic, Social and Technological (PEST).
9 Each of the four factors is now described:
Political factors contain official regulations and legal issues that define the rules under which the company works;
Economic factors show how buying power of clients is affected and how a company operates and makes decisions;
Social factors show how client’s requirements are affected and the size of potential markets. They contain demographic and cultural aspects of the external environment that can reveal trends;
Technological factors show how to lower barriers to entry and influence outsourcing decisions.
The PEST analysis tool should thus be performed for each country the company operates in or has an interest.
2.2.3. BCG Matrix
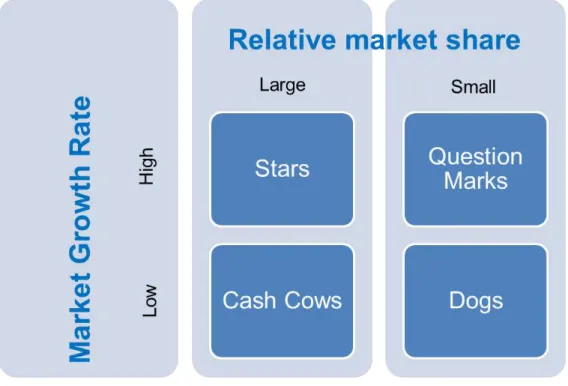
The BCG matrix is another strategic tool that allows a company to evaluate the market it operates in. It is a tool used to discuss resource distribution between strategic business units. It considers that a company’s business units can be divided and classified into four categories based on the combination of market growth and market share; the BCG matrix considers that market growth is related to industry attractiveness and market share is related to competitive advantage (Mercer, 1993 apud Jayantha & De Silva, 2011).
10 Figure 2.4 considers that an increase in market share results in an increase in generating money and that a growing market needs investment to increase capacity and requires money to do so. We will now define each of the four situations shown in Figure 2.4 above:
Cash Cow – is a business unit (BU) that has a large market share and low growth rate. This BU requires little investment and generates capital that can be invested in other BU’s. A cash cow can provide the capital to change Question Marks into Stars;
Dog – is a business unit (BU) that has a small market share and low growth rate. Although this BU doesn’t need much capital, it uses capital that can be better invested elsewhere. If a Dog doesn’t have a strategic objective, then it should be divested if there is a small probability of gaining market share;
Question Mark – is a business unit (BU) that has a small market share and high-growth rate. Question Marks require large resources to gain market share. It is unknown if a Question Mark will achieve success and become a Star or fail and become a Dog because of its large expenses;
Star – is a business unit (BU) that has a high-growth rate and large market share. Stars may generate capital but also require capital to reinvest in order to maintain their leadership. A Star may become a Cash Cow if it achieves success once the industry matures. Companies should always have Stars that can eventually become Cash Cows in order to secure capital for the future.
2.2.4. Porter’s Five Forces
We now come upon the fourth analysis related to the company’s environment and market, which hopefully complements the previous three.
11
Figure 2.5 - Porter's Five Forces Model
Rivalry
Rivalry is a result of companies that operate in the same industry, because companies will always do their best to gain competitive advantage over one another. In order to gain competitive advantage a company can do the following: change processes, improve product differentiation, use different means of distribution and/or explore supplier relationships. Thus one can say that companies can be in two general situations regarding the industry they operate in. Industries can have multiple companies with small market shares or they can have few companies with larger market shares. Therefore, although it is important that a company gains an advantage over its rivals, it still has to contend with the intensity of rivalry.
Substitutes (Threat of Substitutes)
The threat of substitutes relates to products with the same purpose, but which belong to different industries. A substitute product can affect price and demand; as demand varies due to more products being available, a close substitute product can affect price by making it more difficult to raise prices.
Buyers (Buyer Power)
It is the power that clients can have over the industry. If it is high, then the client has a strong bargaining power and can argue prices. This is an unusual situation.
Suppliers (Supplier Power)
12
Potential Entrants (Threat of Mobility)
Competition increases when new companies enter the industry; they often face some obstacles upon entering, designated as barriers to entry. Barriers to entry, which are a useful tool when considering increasing a company’s competitive advantage, can decrease the number of new companies and thus keep the profit level for existing companies. There are also barriers to exit, which are similar to barriers of entry because they make it difficult for a company to leave the market and so it must stay and compete.
Porter’s five forces is a good tool to analyze a company’s competing environment.
2.2.5. Porter’s Generic Strategies
It is important to know how to create a strategy for a company. For this it is useful to consider basic strategies such as Porter’s generic strategies for example, which can be used to help bridge the environment analysis tools (SWOT, PEST, BCG, Porter’s five forces) and the strategy assessment analysis tools such as the Balanced Scorecard. There are also other basic strategies which we can consider, such as Treacy and Wiersema’s strategies (Product Leadership, Operation Excellence and Customer Intimacy) that are more focused on the customer, by having a customer relationship factor. But considering that Porter’s generic strategies are more market-oriented we have chosen these as the basis to develop our strategies in the practical part of the dissertation (Treacy, 1995).
Therefore Porter’s generic strategies will be defined and discussed in this sub-chapter.
Porter argues that a company’s strengths can be: cost advantage or differentiation. These strengths can be applied in a broad or narrow scope, which generates three generic strategies: cost leadership, differentiation and focus. These strategies aren’t dependent on the company or the industry. The three strategies are presented below in Table 2.1 (Porter, 1999).
Table 2.1 –Porter’s Generic Strategies
(Porter, 1999)
Target Scope
Advantage
Low Cost Product Distinctiveness
13
Cost leadership strategy
The first strategy is the cost leadership strategy and it can be applied to a company that is a low cost manufacturer. The company can sell products at prices below the average industry prices in order to increase market share or the company can sell products at the industry’s prices that will result in higher profits than its rivals.
Companies may reach these cost advantages by: improving process efficiency, having single access to lower cost raw materials and/or optimizing their outsourcing.
This strategy has risks and one of them is when other companies surpass the company in the technology aspect, therefore eliminating the company’s competitive advantage (Porter, 1999).
Differentiation strategy
The second strategy is differentiation and it requires the development of a product or service that offers the clients distinctive or unique attributes, which are valued by clients. Clients recognize these attributes as being better or different from what rival companies offer. This unique attribute may let the company charge a higher price for its product or service. Consequently, this can help save extra costs that the attribute may incur in the product or service’s price.
This strategy contains certain risks, such as: rivals copying the company’s products and change in customer trends (Porter, 1999).
Focus strategy
The third strategy is the focus strategy. This strategy aims to narrow segments of the market, where it tries to achieve a cost advantage strategy or differentiation strategy. The focus strategy is based upon the principle that the needs of the group are better served if a company is only focused on one segment. Companies that adopt this strategy usually have a loyal customer base, which hinders potential rivals. Although because of the narrow focus, companies that adopt this strategy will have less bargaining power with suppliers.
This strategy also has it risks, some of which are: imitation and variations in target segments (Porter, 1999).
14
2.2.6. Balanced Scorecard (BSc)
Only after successfully explaining the previous strategic analysis tools related to the company’s environment and Porter’s generic strategies that help bridge the two different types of analysis, can we discuss the Balanced Scorecard tool. The purpose of the BSc is to evaluate the company’s strategy because only after examining the environment and creating a basis for the company’s strategy can we effectively concentrate on analyzing and shaping the company’s strategy.
“The balanced scorecard is a strategic performance management system that links performance to strategy using a multi-dimensional set of financial and non-financial performance measures. It focuses on better understanding the causal relationships and links within organizations and the levers that can be pulled to improve corporate governance.” (Dye, 2003 apud Punniyamoorthy & Murali, 2008)
The BSc tool was created by Kaplan & Norton (1996, pp.30-31) and is used by managers to analyze a company’s performance. It is a tool based upon a group of performance measures divided into four perspectives: financial, customer, internal processes and learning and growth. According to these authors the Balanced Scorecard expresses the vision and strategy of a business unit into objectives and measures in four separate perspectives:
The 1st perspective - Financial - shows the company as it wants to be regarded by its shareholders;
The 2nd perspective - Customer - shows how the company wants to be regarded by its customers;
The 3rd perspective - Internal Business processes - describes the processes which the company must excel at to satisfy its customers and shareholders;
15
Figure 2.6 – Balanced Scorecard
Available at: (http://www.valuebasedmanagement.net/images/figure_bsc.jpg)
The BSc can be used to (Idem. Ibidem):
Explain and gain consensus about strategy; Find and align goals to strategy (Norreklit, 2000);
Link strategic objectives to long-term targets and annual budgets; Obtain feedback to improve strategy;
Communicate the strategy to the whole organization.
16
Figure 2.7 – BSc measures’ drivers
Observing Figure 2.7 it is fundamental to properly define causal relationships between measures of the four perspectives when creating a BSc. It is important to know that financial measures can report about past performance and non-financial measures can be the drivers of future performance and value creation (Kaplan & Norton, 1996, pp.8).
2.3. Lean Philosophy
After discussing strategic planning and strategic analysis tools related to the company’s environment and strategy, we will now start to discuss the Lean philosophy. Since it is the study’s objective to identify lean performance measures in the wood-plastic composite industry and the importance the industry gives to these performance measures (sub-chapters 4.3 and 4.4).
In a broader perspective, the lean philosophy relates to strategic planning in respect that lean itself is a strategy. Companies can apply lean in order to obtain better performance results and to eliminate any possible actions, plans or activities that contribute to the decrease of the company’s performance results.
17 lean is able to eliminate waste in actions, plans or activities. As eliminating waste is lean philosophy’s main objective (see definition below).
Because of the two explanations we have provided, we have chosen to integrate lean philosophy in the strategic planning chapter as lean will be applied to the wood-plastic composite industry. We will try to define the lean philosophy, its major components and enumerate lean’s advantages, disadvantages and tools/practices/techniques.
“Leanness means developing a value stream to eliminate all waste, including time, and to ensure a level schedule.” (Naim & Gosling, 2011)
Lean’s goal is to add value to the product/service by eliminating waste. Waste is eliminated by targeting activities that do not add value. These activities can use/spend resources unnecessarily and will thus increase the product’s price. Therefore it is very important to correctly identify all activities. While identifying activities it is important to stress out that although an activity may not be adding value to the product/service, it can be important to the manufacturing process and so it is wrong to eliminate it.
(Dües et al., 2013) enumerates a list of Lean attributes. These are presented in Table 2.2.
Table 2.2 – Lean attributes Source: (Dües et al., 2013)
Attribute
Lean Paradigm
General Purpose
Maximize profits by reducing costsFocus
Focus on cost reduction and increased flexibility through continuous elimination of waste and non-value adding activities across the Supply ChainCustomers
Economic customer driven by costsCustomer Satisfaction Satisfying customers by reducing costs and lead times Organizational Structure Static organizational structure with few levels of hierarchy allowing empowerment of employees
Supply Chain
Lead Time Reducing lead times if it doesn't increase cost
Relationship with Suppliers
and Customers
Close, collaborative, reciprocal, long-term relationships with few selected suppliers;
Demand information is shared across the supply chain; Create a network of suppliers to build common
understanding and learning about waste reduction and operational efficiency in the delivery of existing products and services.
Product Design
Maximize performance and minimize cost18 Manufacturing Maintain high average usage rate;
Use JIT practices, “pulling” products based on demand.
Inventory Generates high turnover and minimizes inventory throughout the supply chain to decrease costs and free up assets
Transport
Minimizing material handling during manufacturing encourages frequent small deliveries of supplies and finished products
End-of-life
Consideration ends with sale of product;
No concern for impact of product usage or end-of-life recovery.
Business Results
Business Results Quality, cost, delivery, customer satisfaction and profitability KPI (key performance
indicators) Cost and service level Dominant Costs Physical costs
Tools
Principal Tools Value Stream Mapping(VSM)
Waste Reduction Techniques
Seven wastes: overproduction, waiting, transportation, inappropriate processing, defective parts and rejects, unnecessary inventory and unnecessary motion.
Tools/Practices Value Stream Mapping, inventory minimization, higher resources usage rate, dissemination of information across the supply chain, JIT, 5S, shorter lead times.
A few attributes from Table 2.2 that we considered important for this dissertation regarding customers, inventory and lead times, are explained below:
The Lean customer is driven and satisfied with cost and lead time reduction; Keeping excessive inventory represents extra cost and thus a risk to the company;
Decreasing transportation lead times to create supply chains that are more responsive and decreasing the overall need for transportation.
19 quality, Just-in-time delivery, reduced inventories, increase of labor productivity, decrease of space usage and decrease in manufacturing costs.
Although Lean has several benefits, one gap has been pointed out. It concerns variability in the supply chain, as orders can change without notice there is the possibility that supplier fails to deliver the correct quantity at the right time or place with perfect quality. Lean has a lack of adequate responses to cope with this kind of problem (Womack et al., 1990 apud Shah & Ward,
2007).
Upon reviewing the Lean philosophy, it is important to discuss in greater detail Lean’s aspects: Lean Thinking, Waste, Creation of Value, Flow and Lean tools/ techniques. In order to understand the scope of the lean philosophy.
2.3.1. Lean Thinking
“The dynamic, knowledge-driven, and customer-focused process through which all people in a defined enterprise continuously eliminate waste with the goal of creating value.” (Sun, 2011)
It is important to understand how the process of applying Lean to a product or service starts, this process begins with lean thinking.
The concept of lean thinking starts with the client and the definition of value. When a manufacturing process is able to deliver value to the client, then that is where Lean Thinking may begin being applied. Lean Thinking can be applied to process industries (industries where the main production processes happen continuously or occur on a batch of materials that is indistinguishable) and to the specific manufacturing processes belonging to these industries. In order for a company to be truly Lean it needs to guarantee the flow of value across its supply chain and this begins with waste elimination. Waste can be reduced or eliminated from various manufacturing processes, which have been previously identified as non-value adding activities. If it is the company’s objective to implement Lean, then this process can be easier when considering a method developed by Melton (2005):
Record existing process performance – how it is done; Define value and remove waste;
Detect unwanted effects and identify their root cause in order to determine the real problem; Fix problems and redesign their processes;
Test and prove that value is being delivered to the customer.
20 Review the value chain for certain customers;
Review processes (business and manufacturing) with the help of cross-functional teams, which have the power to change processes;
Always search for waste, checking regularly that value is delivered to customers and controlling the flow.
Lean thinking is vital after companies have taken the first step to implement Lean philosophy and try to improve their processes. It is important to consider the resistance to change of workers. Because Lean thinking seeks to know how things are done and why, this usually bothers workers and goes against lethargy found in most companies. But the increase in efficiency and profits are proof to convince workers sceptical about Lean (Melton, 2005).
After discussing the process of lean thinking we shall now discuss one of lean thinking’s applications, waste removal and more importantly what is waste.
2.3.2. Waste
“Any activity in a process which does not add value to the customer is called ‘waste’. Sometimes the waste is a necessary part of the process and adds value to the company and this cannot be eliminated, e.g., financial controls .” (Melton, 2005)
Waste removal is an essential component of the Lean philosophy and so it is very important correctly identifying what constitutes as waste. After which, waste removal processes can be applied.
Melton mentions that it is vital that waste be eliminated, but to discover how it is done is also very important, because waste can be eliminated and happen again if its origin is not eliminated. But one has to take into consideration that sometimes waste is a necessary part of the process and so it cannot be eliminated, which has been stated previously.
At an early stage the identification of waste in processes is easy and has the possibility of large savings. But as processes improve, waste reduction becomes incremental. Therefore it is very important to always question what to do because that is a good first step to stop creating waste. There are several techniques and tools one can use to identify and classify waste, such as the three MU’s and the seven causes of waste.
The three MU’s approach to identifying waste is based upon matching the manufacturing capacity to production (Amaro & Pinto, 2007):
o Muda (waste) – capacity exceeds production;
21 o Muri (irrationality) – production larger than capacity.
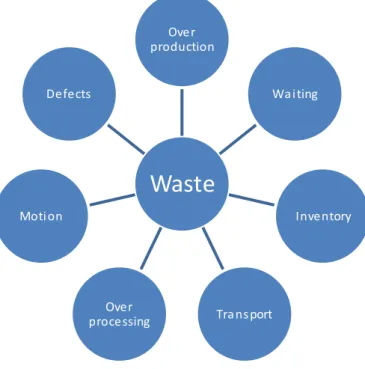
The second method, known as seven causes of waste consists of (Melton, 2005):
Figure 2.8 – The seven types of waste Source: (Melton, 2005)
In order to eliminate waste, it is good to create a process diagram to understand the location of the inventory holding sites, and to improve or eliminate travelling routes.
The potential gain with the elimination of waste is significant. However it is necessary to be aware of activities which don’t create value but are necessary; these should be minimized to decrease their influence. Finally it is important not to lose focus of the creation of value while eliminating waste (Amaro & Pinto, 2007).
After identifying what constitutes waste to a company, it is easier to identify which activities are adding value to the company’s product. So we arrive upon value, its creation and identification processes that are crucial when understanding what features the customer desires and values most. We will try to explain this in the following sub-chapter.
2.3.3. Creation of Value
“The creation of value is defined by any activity which converts the product or service into an added value to the client.” (Amaro & Pinto, 2007)
As stated before a company needs a product/service that sets it apart from its industry rivals. By having a product/service that has attributes the customer values above other
Waste
Over production
Wa i ting
Inve ntory
Tra ns port Over
processing Moti on
22 products/services, the company is able to attain competitive advantage. Creation of value is a crucial component of the lean philosophy.
The same authors state that value can be defined as a combination of processes and operations that must be done in the best possible way to deliver a product/service, with the best quality, at the lowest cost and at the right moment.
A company gains competitive advantage when it has one or more value creating activities, thereby offering the customer more value for its product/service than its rivals. Superior value can be created through lower cost or superior benefits of the product/service the client acquires. Because clients will choose a product/service with superior value ahead of others.
After explaining the definition of Value in the Supply Chain, it has to be stated that value is a critical component to Lean. In the Lean approach, value can be defined as ever-changing from customer to customer and therein lays the essence of value identification. As customer’s requirements are always different and if one doesn’t identify what the customer requires then Lean can’t be properly applied. So, one of the first steps is to identify value and define value propositions for the customers (Melton, 2005).
Regarding Melton’s identification of value, Ciarniene & Vienazindiene (2012) state that it is important to find the answer to the following questions:
1. What do customers desire? 2. When and how do they want it?
3. What mix of features, capabilities, availability and price will be favored by the customer? When considering added-value, one is always reminded of how this value is transmitted along the supply chain. This happens through the flow of production and consequently the flow of value throughout the processes that make up the supply chain.
2.3.4. Flow
Flow is a difficult concept to understand. In a simple manner it can be said that Flow is the opposite of mass production systems. It is because of the lack of flow that large warehouses exist to store inventory, which results in unnecessary maintenance and space expenses. To understand flow it is important to understand the notion of value stream. Value stream is the connection of activities that deliver value to the customer and bridge functional and organizational areas. In order for companies to be truly Lean, they have to guarantee the flow of value (Melton, 2005).
After discussing Lean’s features, it is important to know how these can be applied in companies. For this we will present the tools, practices and techniques that Lean makes use of.
23 There are several Lean tools, practices and techniques that a company may employ when applying Lean. Some of these techniques are listed below (Melton, 2005; Ray et al., 2006):
Kanban – visual signal that aids production flow by pulling the product through the
manufacturing process as the client’s orders come in;
5 S’s – visual housekeeping technique system which gives control back to the shop-floor (5 S’s meaning: Sort, straighten/stabilize, shine/sweep/system cleaning, standardize and sustain);
Visual control – method of measuring performance at shop floor level that is visual and owned by the operator team;
Poke yoke – error proofing mechanism;
SMED (single minute exchange of dies) – changeover reduction technique;
Cellular manufacturing – makes the product batches as small as possible (Ray et al., 2006); Total Productive Maintenance (TPM) – comprises total effectiveness, total preventive
maintenance and total participation;
Value Stream mapping – process that tracks the product from its origin to the finish.
One of Lean’s most important techniques is level scheduling also known as Heijunk a. Level scheduling consists in eliminating waste through production planning, by analysing orders’ historical data and their variability to ensure long term continuous flow.
Another important Lean technique is Just-in-Time production (JIT). JIT’s main objective is to manufacture the required quantity at the moment the customer orders it. By doing this, JIT allows for: the reduction of costs, decrease of lead and setup times, reduction of queues and lot sizes.
After discussing Lean philosophy, we have to consider the supply chain every company has , because the supply chain plays a tremendous part when companies want to achieve success. If the supply chain’s components are not working properly it will be very hard for the company to be successful. We will discuss the supply chain’s importance and how it can be related to the Lean philosophy.
2.4. Supply-chain
“A supply chain is defined as a set of three or more entities (organizations or individuals) directly involved in the upstream and downstream flows of products, services, finances, and/ or information from a source to a customer.” (Mentzer et al., 2001)
24 company’s strategy and two of its main uses are: to align strategic objectives to long-term targets and budgets and to communicate the company’s strategy to its workers. If this is accomplished then it is a great step towards the company’s success.
Every manufacturing company that has a supply chain must have one that runs smoothly, efficiently and quickly, so that it can manufacture incoming orders flawlessly.
Christopher regards the supply chain as a network of organizations, from supply to distribution, connected by different processes or activities that create value for the end-customer (Christopher, 1992 apud Mentzer et al., 2001).
During the 80’s and 90’s several companies discovered that it was necessary to improve their supply chain and not just the internal performance of the organization. Thus Supply Chain Management (SCM) became an important strategic component of competition in the existing economy (Behrouzi & Wong, 2011).
Kisperska-Moron & de Haan (2011) argue that supply chains compete in markets because of trends like decreasing a product’s lifetime and product propagation in markets. All of the supply chain’s elements must work towards the common goal of satisfying a customer’s ever-changing demands. These demands can change according to the product’s life cycle or customer’s trends and so supply chains should adapt their strategies in order to keep their customers and gain new ones.
We have to consider the relationship between supply chain and Lean, as this interaction will provide a company with greater possibilities of achieving success through operational accomplishment.
2.5. Lean & Supply-Chain Paradigm
2.5.1. Definition and objectives
It is vital that lean philosophy and supply chain merge into a single entity without problems or delays. This would be an improvement. The supply chain will benefit from Lean’s relentless methods that eliminate waste, create value and seek improvement opportunities.
25 characteristics change; it is of the utmost importance that companies are aware of these changes.
Summarizing, the Lean supply chain paradigm is an approach based upon cost and time reduction, in order to improve effectiveness. The goal of the paradigm is to optimize all processes belonging to the supply chain, by identifying simplifications, decreasing waste and minimizing activities that do not create value (Duarte & Machado, 2010).
2.5.2. Features
After defining the paradigm and discovering its objectives, it is important to know how Lean differs from the usual supply chain strategies. We list a few differences of Lean supply chain’s features (Pinto, 2010):
Quick to respond to market variability and customer’s demands; Emphasis on synchronizing collaboration across the supply chain;
Quick to adapt to new challenges and opportunities provided by unpredictable markets; Focus on eliminating all types of waste across the supply chain and guiding supply chain
processes to create value.
As seen above there are several major differences but we have considered two differences between Lean supply chain approach and typical supply chain’s strategies that are very important and merit further discussion.
In typical supply chain strategies, forecast is based on product purchase to minimize all costs, while Lean seeks to create flexible procedures that are able to respond to any change in customer’s needs. Lean’s approach is not perfect because of forecast error, which requires constant update through the analysis of the continuous flow of sold stock (Coleman & McGowan, 2010). Any delay or problem that affects flow is worth studying for possible improvement opportunities.
Another difference between both approaches, is that the supply chain model has a cost saving perspective on manufacturing and delivering a product/service to a customer, while Lean focuses on value and waste that exist along the supply chain (Behrouzi & Wong, 2011).
Although both approaches share many features, their goals are very different and herein lays the advantage of the lean supply chain.
2.5.3. Implementation
26 To understand that lean thinking is a continuous improvement process focused on
eliminating waste and creating value to the end-customer;
To identify and understand the effect’s root-cause not its symptoms;
To investigate why products aren’t flowing consistently and in a more predictable manner in the supply chain;
To position the inventory in the correct distribution centers. The right stock in the wrong location will result in unnecessary displacements and extra time and costs;
To analyze the supply chain as a whole and to measure its performance continuously; To create a multidisciplinary team to move forward with the implementation, which has the
support of management;
To assess the possibilities of standardizing without compromising order personalization by customers;
To recognize outsourcing’s feasibility as a facilitator when responding to changes and demands of the market;
To collaborate with suppliers and clients, trying to establish beneficial long-term relationships.
As can be seen in the list above, lean has several actions that a company must undertake in order to fully apply the philosophy to its supply chain. It is not an easy process but the benefits outweigh the disadvantages considerably.
2.5.4. Lean Distribution
“Lean Distribution breaks the forecast accuracy barrier to improving customer service and profit with flawless execution of simplified operating processes .” (Zylstra, 2005)
In the existing economic situation it has become increasingly difficult to forecast demand, as such cost reductions are harder to execute and with a growing competition, finding a location with the lowest manufacturing costs is crucial for global distributors. Lean distribution can be the correct approach to solve these problems based on its simplicity, flexibility and market orientation.
Lean’s tools and techniques are applied to: simplify and increase the speed of the flow of materials, decrease the number of mistakes, eliminate unnecessary handling of inventory, maximize facility usage and improve inventory management. This can be done to help distribution companies operate at maximum efficiency, surpass the customer’s expectation and increase profitability.
We now present benefits of lean distribution according to Reichhart & Holweg (2007):
27 Decrease of model change-over timesby decreasing timings of product discontinuation;
Reduction of delivery lead times for specific customer orders; Increase of revenue per unit;
Increase of customer satisfaction and brand image.
Although lean distribution can have high implementation costs, these can be overlooked by the profits made in the long term.
The brief reference to lean distribution is very important when considering unique situations, which will be explained in Chapter 4 and the conclusions of this dissertation. This approach is very appealing for manufacturing and distribution companies and thus it is worthy of consideration in the discussion of this dissertation.
2.6. Lean performance measures
As stated before, companies should assess their existing performance measures and this can be done through the application of performance measures. If we consider the application of the lean philosophy to an industry or company, than the performance measures used should be related to lean. Also, as Lean is based upon continuous improvement, it is important to identify and have performance measures to evaluate this component.
Performance measures are crucial to judge and evaluate if corrective actions are working out by comparing past performance with the existing one. This type of evaluation should be done monthly, weekly if possible and employees should have access to some of this data, because this helps the continuous improvement process. The result of performance analysis is better information, which a company can use to base its decisions upon.
In the literature review we discovered across several authors that many terms were used for the same purpose. We find it is necessary to dispel any doubts regarding performance measures synonyms. In order to help solve this problem we present the three most used terms discovered, when collecting data about performance measures. According to Ragland (1995) the terms can mean:
Measure – determines or analyzes through comparison to a standard. It can be a standard or unit of measurement;
Metric – quantifies a measure of a certain attribute that a system, component or process has. It is a calculated or combined indicator based upon two or more measures;
Indicator – measures values against a baseline or expected results.
28 because they lead an organization on its path of lean transformation. Lean metrics consist of visible performance measures, targeted improvement, team reward and recognition (Feld, 2001
apud Khadem, Ali, & Seifoddini, 2008).
In order to obtain lean performance measures that can be used for the goal of this dissertation, we have reviewed performance measures of five different authors. This will be the groundwork for the selection of lean performance measures to be included in the survey used for the case study (sub-chapter 4.4).
Firstly Behrouzi & Wong (2011) who identified 148 performance measures through their analysis of various literatures. After they reviewed the literature, a panel of experts selected and filtered the most important and Lean-related measures resulting in 28 measures. The following characteristics were considered for the selection process:
Accessibility; Measurability;
Alignment of supply chain strategies and company goals;
Importance and relationship to lean components (waste elimination, JIT and flexibility); Mix of supplier, manufacturer and client related measures;
Financial and non-financial measures.
The 28 measures selected, which are related to lean are presented in Table 2.3:
Table 2.3 – Selected measures Source: (Behrouzi & Wong, 2011)
1 Supplier rejection rate 15 Percentage of reworks
2 Percentage of standardized processes 16 Manufacturing cost per unit (repeated by Gurumurthy) 3 Labor value added productivity 17 Supplier volume flexibility
4 Customer delivery lead time (repeated by Gurumurthy) 18 Supplier product-mix flexibility 5 Percentage of total value-added time (repeated by Gurumurthy) 19 On-time delivery by suppliers 6 Setup, unscheduled and idle time 20
Warranty costs (repeated by Gurumurthy)
7 Average freight cost per unit 21 Defect rates of production 8
On-time delivery to customers
(repeated by Gurumurthy) 22 Cost of energy
9 Customer complaints 23 Perfect order fulfillment by suppliers
10 Customer rejection rate 24
Supplier delivery lead time (repeated by Gurumurthy)
11 Total inventory 25 On-time production
29 After computing values, the authors divided the 28 measures into four categories: quality, cost, flexibility and reliability.
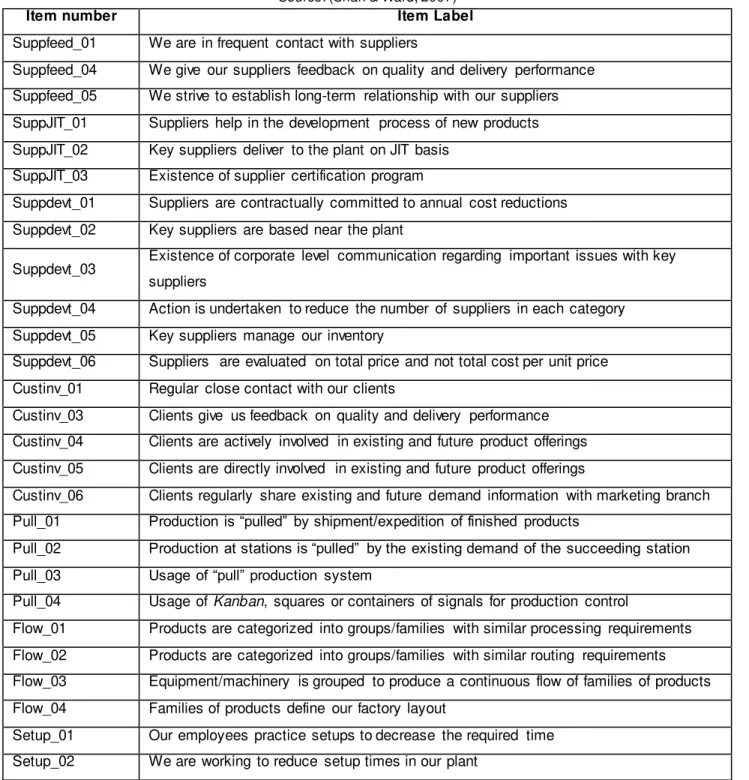
Shah & Ward (2007) identified 48 practices/tools related to the environment close to where lean manufacturing happens. Seven practices were eliminated in a filtration process phase, resulting in a total of 42 practices, which were divided into ten categories. The practices/tools and according categories are presented below in Table 2.4:
Table 2.4 – Performance measures related to operational space near lean manufacturing
Source: (Shah & Ward, 2007)
Item number Item Label
Suppfeed_01 We are in frequent contact with suppliers
Suppfeed_04 We give our suppliers feedback on quality and delivery performance Suppfeed_05 We strive to establish long-term relationship with our suppliers SuppJIT_01 Suppliers help in the development process of new products SuppJIT_02 Key suppliers deliver to the plant on JIT basis
SuppJIT_03 Existence of supplier certification program
Suppdevt_01 Suppliers are contractually committed to annual cost reductions Suppdevt_02 Key suppliers are based near the plant
Suppdevt_03 Existence of corporate level communication regarding important issues with key suppliers
Suppdevt_04 Action is undertaken to reduce the number of suppliers in each category Suppdevt_05 Key suppliers manage our inventory
Suppdevt_06 Suppliers are evaluated on total price and not total cost per unit price Custinv_01 Regular close contact with our clients
Custinv_03 Clients give us feedback on quality and delivery performance Custinv_04 Clients are actively involved in existing and future product offerings Custinv_05 Clients are directly involved in existing and future product offerings
Custinv_06 Clients regularly share existing and future demand information with marketing branch Pull_01 Production is “pulled” by shipment/expedition of finished products
Pull_02 Production at stations is “pulled” by the existing demand of the succeeding station Pull_03 Usage of “pull” production system
Pull_04 Usage of Kanban, squares or containers of signals for production control
Flow_01 Products are categorized into groups/families with similar processing requirements Flow_02 Products are categorized into groups/families with similar routing requirements Flow_03 Equipment/machinery is grouped to produce a continuous flow of families of products Flow_04 Families of products define our factory layout