I
Diogo Rendeiro Figueira
Licenciado em Bioquímica
Valorization of agro-industrial waste
through chemical and microbiological
approaches
Dissertação para obtenção do Grau de Mestre em Biotecnologia
Orientadora: Professora Doutora Susana Filipe
Barreiros, FCT-UNL & LAQV
Coorientadora: Professora Doutora Madalena Salema
Oom, ISCSEM & UCIBIO
Presidente: Professora Doutora Ana Cecília Afonso Roque, FCT-UNL
Arguente: Professora Doutora Ana Luísa Almaça da Cruz Fernando, FCT-UNL
Vogal: Professora Doutora Susana Filipe Barreiros, FCT-UNL
III
Diogo Rendeiro Figueira
Licenciado em Bioquímica
Valorization of agro-industrial waste through chemical
and microbiological approaches
Dissertação para obtenção do Grau de Mestre em Biotecnologia
Orientadora: Professora Doutora Susana Filipe Barreiros,
FCT-UNL & LAQV
Coorientadora: Professora Doutora Madalena Salema
Oom, ISCSEM & UCIBIO
Presidente: Professora Doutora Ana Cecília Afonso Roque, FCT-UNL
Arguente: Professora Doutora Ana Luísa Almaça da Cruz Fernando, FCT-UNL
Vogal: Professora Doutora Susana Filipe Barreiros, FCT-UNL
V
Copyright
Valorization of agro-industrial wastes through chemical and microbiological
approaches.
Copyright © 2017 Diogo Rendeiro Figueira e Faculdade de Ciências e Tecnologia -
Universidade Nova de Lisboa
VII
Acknowledgments
Gostaria de agradecer à professora Susana Barreiros por me ter aceite nesta dissertação de mestrado e por “faire confiance a moi”, por ter tido paciência para me ensinar, pelo acompanhamento na parte da hidrólise enzimática e na hidrólise com a SBW, por me ter ajudado exaustivamente na correção da tese, e por se ter preocupado comigo quando estive menos bem. Gostaria de agradecer também à professora Madalena Oom pelo acompanhamento inicial que me deu na parte da microbiologia, pela ajuda e rigor que me foi transmitindo e por me ter ajudado com a correção da tese.
Gostaria de agradecer ao Bruno Pedras por me ter acompanhado ao longo do meu percurso no lab 427, em concreto, por me ter ajudado na parte da caraterização química do GP e da hidrólise com a SBW, e na análise de alguns resultados.
Quero agradecer também ao professor Pedro Simões, ao Doutor Alexandre Paiva, à Doutora Rita Craveiro e à Francisca Mano por, em conjunto com a professora Susana, me terem recebido tão bem no laboratório 427. E claro, quero agradecer aos meus colegas, à Liane Menezes, à Patrícia Freitas, à Mónica, à Carolina, à Ana, e a todas as restantes pessoas do laboratório, pelo companheirismo e vivências ao longo deste ano.
Gostaria de agradecer também ao professor Jorge Parola, ao João Avó, ao Tiago Moreira, do grupo de Fotoquímica do DQ, por me terem permitido utilizar o espectrómetro de fluorescência e me terem ensinado a utilizar o aparelho. Do Laboratório de Análises, gostaria de agradecer à Cecília Bonifácio por me ter ajudado com a centrifuga e com o liofilizador; ao Nuno Costa por me ter analisado algumas amostras de HPLC e à Carla Rodrigues por me ter analisado as amostras por análise elementar. Do laboratório 305 do DCV, à Cláudia e à Carla, por me terem ajudado quando tinha dúvidas em alguns procedimentos na área da Microbiologia.
IX
Resumo
O principal objetivo desta tese foi a utilização do bagaço de uva (GP) como fonte de hidratos de carbono para o crescimento de leveduras e posterior produção de lípidos, e de carotenóides, conseguindo assim a valorização de um resíduo agroindustrial muito importante. Para esse efeito, a tecnologia de água subcrítica (SBW) foi utilizada como um tratamento para superar a resiliência da matriz lignocelulósica do GP e despolimerizá-la em estruturas mais elementares. Foram realizadas algumas experiências de crescimento de estirpes de levedura no extrato de GP resultante do licor rico em hidratos de carbono gerado durante o tratamento com SBW, em condições propícias à acumulação de lípidos e produção de carotenóides.
As experiências de extração / hidrólise com SBW foram realizadas a uma pressão constante de 70 bar, com um caudal de água de 10 mL / min e temperaturas máximas entre 190 ° C e 240 ° C. Foram utilizados dois programas de temperatura, nomeadamente um em que a temperatura foi aumentada continuamente para a temperatura alvo, e outro consistindo numa série de passos, cada passo consistindo numa rampa seguida de um patamar, visando o fracionamento de GP em extratáveis (patamar a 130 ºC), constituintes da hemicelulose (patamar a 190 ºC) e glucose ou gluco-oligossacarídeos provenientes da celulose (patamar a 240 ºC).
Os melhores resultados foram obtidos num ensaio por patamares atingindo 240 ºC. Nessas condições, a eficiência de extração / hidrólise do tratamento SBW de GP foi de 71% em peso, levando a um rendimento de extrato de GP de 31% em peso e um rendimento de hidratos de carbono de 27% em peso. O último valor corresponde a uma recuperação de aproximadamente 84% da quantidade total de hidratos de carbono (solúveis e estruturais) de GP, o que indica que a hidrólise da celulose ocorreu até certo ponto. Da quantidade total de hidratos de carbono medida no extrato de GP, aproximadamente 80% estavam na forma de oligossacarídeos. Os monossacarídeos mais abundantes no extrato de GP foram glucose e frutose, que existem no GP como hidratos de carbono solúveis, seguidos de arabinose, xilose e galactose, da hemicelulose.
Visando a hidrólise dos oligossacarídeos nos licores produzidos pelo tratamento SBW, o Viscozyme, um complexo enzimático que exibe atividade de celulase e hemicelulase, foi imobilizado em micropartículas de quitosano ativadas com glutaraldeído. O rendimento da imobilização enzimática foi de aproximadamente 79% e a enzima manteve cerca de 75%dae sua atividade específica, conforme determinado na hidrólise de um substrato modelo (arabinogalactano). Verificou-se que a hidrólise enzimática do GP e do resíduo de GP que fica no reator após o tratamento com SBW era muito lenta. A hidrólise enzimática do extrato de GP foi também efetuada, mas a análise por HPLC não foi conclusiva.
X de lípidos, quer no meio de controlo (9.6 g/L de biomassa, dos quais 5.3 g/L eram lípidos) contendo glucose como fonte de carbono, quer no meio com extrato de GP (0.9 g/L de biomassa, dos quais 0.2 g/L eram lípidos) contendo hidratos de carbono numa quantidade igual à da glucose no meio de controlo. A levedura R. babjevae atingiu o teor mais elevado de carotenóides (6.3 mg carotenóides / g peso seco) no meio de controlo com glucose.
Termos-chave: carotenóides, hidratos de carbono, hidrólise com água subcrítica, hidrólise
XI
Abstract
The main objective of this thesis was to use grape pomace (GP) as a source of carbohydrates for yeast growth and subsequent production of lipids, or carotenoids, thereby achieving the valorization of a very important agro-industrial residue. To that effect, subcritical water (SBW) technology was used as a treatment to overcome the resilience of the GP lignocellulosic matrix, and depolymerize it into more elementary structures. Experiments were conducted on the growth of yeast strains on the GP extract resulting from the carbohydrate-rich liquor generated during SBW treatment, under conditions conducive to lipid accumulation and carotenoid production.
SBW extraction / hydrolysis experiments were carried out at a constant pressure of 70 bar, a water flow rate of 10 mL/min, and maximum temperatures between 190°C and 240 °C. Two temperature programs were used, namely one in which temperature was increased continuously to the target temperature, and another consisting of a series of steps, each step consisting of a ramp followed by a plateau, aiming at the fractionation of GP into extractives (plateau at 130 ºC), hemicellulose constituents (plateau at 190 ºC), and glucose or gluco-oligosaccharides from cellulose (plateau at 240 ºC).
The best results were obtained in a plateau-type assay reaching 240 ºC. At these conditions, the extraction / hydrolysis efficiency of the SBW treatment of GP was 71 wt.%, leading to a yield of GP extract of 31 wt.%, and a yield of carbohydrates of 27 wt.%. The latter value corresponds to a recovery of approximately 84% of the total amount of carbohydrates (both soluble and structural) of GP, which indicates that the hydrolysis of cellulose occurred to some extent. Of the total amount of carbohydrates measured in the GP extract, approximately 80% were in the form of oligosaccharides. The most abundant monosaccharides in GP extract were glucose and fructose, which exist in GP as soluble carbohydrates, followed by arabinose, xylose and galactose, from hemicellulose.
With a view to breaking down the oligosaccharides in the liquors produced in the SBW treatment, Viscozyme, an enzyme complex exhibiting cellulase and hemicellulase activity, was immobilized on glutaraldehyde-activated chitosan microparticles. The yield of enzyme immobilization was approximately 79%, and the enzyme kept about 75% of its specific activity, as determined in the hydrolysis of a model substrate (arabinogalactan). The enzymatic hydrolysis of GP and GP residue left in the reactor after SBW treatment was found to be very slow. That of GP extract was carried out but HPLC analysis was inconclusive.
GP extract was used as carbon source for the growth of two oleaginous yeasts:
Rhodotorula babjevae, and Lipomyces starkeyi. A comparative analysis of biomass and lipid
XII containing carbohydrates in an amount identical to that of glucose in the control medium. R.
babjevae produced the highest carotenoid content, reaching 6.3 mg carotenoids / g cell dry weight
in control assays with glucose.
Key-words: grape pomace, subcritical water hydrolysis, carbohydrates, oleaginous yeasts, lipids,
XIII
Table of Contents
1 State of the art ...19
1.1. Biorefinery & Biotechnology ...19
1.2. From agro-industrial waste to added-value residues ...20
1.2.1. Lignocellulosic biomass ...20
1.3. Grapes And Grape pomace ...22
1.3.1. Grapes ...22
1.3.2. Grape Pomace ...23
1.4. Biomass hydrolysis ...24
1.4.1. Subcritical water ...25
1.5. Enzymatic hydrolysis ...27
1.5.1. Cellulase and hemicellulase ...27
1.6. Oleaginous Yeasts & Lipid Biosynthesis...30
1.6.1. Oleaginous Yeasts ...30
1.6.2. Lipid Biosynthesis Pathway ...31
1.6.3. Single cell oil ...33
1.6.4. Carotenoids ...33
1.6.5. Biomass hydrolysates as carbon source for yeast growth ...34
1.7. Thesis outline ...34
2 Materials and Methods ...37
2.1. Chemical Characterization of Grape Pomace and derived material ...37
2.1.1. Grape pomace and GP powder ...37
2.1.2. Protein determination ...37
2.1.3. Ash determination ...37
2.1.4. Carbohydrates and Lipid content ...37
2.2. Hot Compressed Water Hydrolysis ...39
2.2.1. Hot-Compressed Water Apparatus and Reaction Conditions ...39
2.2.2. Extraction/hydrolysis efficiency, Yield in GP extract, and Carbohydrate quantification ...40
2.3. Enzymatic Hydrolysis...41
2.3.1. Preparation and Activation of Chitosan Particles ...41
2.3.2. Enzyme Immobilization ...41
2.3.3. Arabinogalactan as a Model Substrate for Enzymatic Hydrolysis ...42
2.3.4. Lignocellulosic Biomass Saccharification ...42
2.4. Outline of the Progression of Biomass Fractionation ...43
2.5. Yeasts Growth medium, Inoculum & Cells Growth ...45
2.5.1. Growth Medium ...45
XIV
2.5.3. Optical Density ...46
2.5.4. Dry Weights ...46
2.5.5. Collecting Cells ...46
2.6. Yeasts Lipid Production ...46
2.6.1. Analysis of lipid by Fluorimetry ...46
2.6.2. Quantification of Lipid by Gravimetry ...47
2.6.3. Carotenoids Characterization by UV-Vis Spectrophotometry ...47
3 Results and Discussion ...49
3.1. Grape Pomace Chemical Characterization...49
3.2. SBW Extraction / Hydrolysis ...50
3.2.1. Process Efficiency and Yield of GP Extract ...50
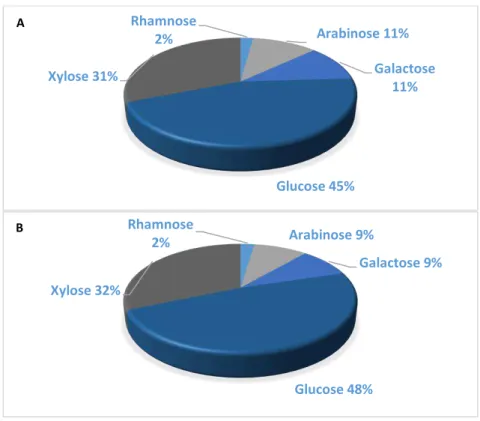
3.2.2. Yield of Carbohydrates and Sugar Profile ...55
3.3. Enzymatic Hydrolysis...61
3.3.1. Yield of Immobilization of Viscozyme on Glutaraldehyde-activated Chitosan ...61
3.3.2. Hydrolysis of a model substrate with free and immobilized enzyme ...61
3.3.3. Hydrolysis of gp material with free Enzyme ...62
3.4. Oleaginous Yeasts ...64
3.4.1. pH Effect on R. babjevae Growth and Lipid Production, using Glucose as Carbon source 64 3.4.2. Growth and Lipid Production by R. babjevae, R. mucilaginosa and L. starkeyi using Glucose as Carbon-source ...67
3.4.3. Growth and Lipid Production by R. babjevae and L. starkeyi using GP Extract as Carbon-Source ...72
4 Conclusions ...75
5 Future Work...77
References ...79
XV
List of Figures
XVII
List of Tables
XVIII
List of Abbreviations
DW – dry weight
GC – gas chromatography
GP – grape pomace
GP-SBW – grape pomace hydrolyzed by hot compressed water
GP-SBWR – grape pomace remaining in the reactor after hydrolysis with hot compressed water
HCW – hot compressed water
HPLC – high performance liquid chromatography
HTW – high temperature water
LCM – lignocellulosic material
NR – Nile Red
OD – optical density
SBW – subcritical water
SCO – single cell oil
SPS – scintillation per second
19
1 STATE OF THE ART
1.1. BIOREFINERY & BIOTECHNOLOGY
A biorefinery is an integral unit that can accept various biological nonfood feedstocks and convert them into a range of useful products, including chemicals, energy, and materials (Fig.1.1).
The first stage of an integrated biorefinery is the extraction of valuable primary and/or secondary metabolites. Primary metabolites include carbohydrates, proteins, and lipids. Secondary metabolites, which unlike primary metabolites are not required for normal growth and development of the species that produce them, include alkaloids, steroids and phenolic compounds.
Biorefining can provide a sustainable approach to valuable products while improving biomass processing economics, as well as environmental footprint.
Figure 1.1 The biorefinery concept: from biomass to valuable products (adapted from reference 1).
The transition to a knowledge-based bio-economy is the prevalent vision among European countries. Supporting the ambition of achieving bio-based economic development is the increased utilization of industrial biotechnology. 2
Industrial biotechnology, or white biotechnology, refers to the use of living cells or enzymes to create industrial products that are easily degradable, require less energy to manufacture, create less waste during production, and sometimes perform better than products created using conventional methods.
20 Combined green biotechnology and white biotechnology will play a crucial role in this century to produce feedstock chemicals and fuels derived from biomass. This requires efficient breakdown and conversion of lignocellulosic material, which remains as one of the biggest handicaps currently holding back the development of successful biomass-based biorefineries that can dethrone traditional petroleum refineries.1
The biorefinery approach can lead to the production of green and sustainable chemical products with less negative impact on the environment,3 as well as foster regional development and a fairer
distribution of economic benefits than the actual model.
1.2. FROM AGRO-INDUSTRIAL WASTE TO ADDED-VALUE RESIDUES
Food production is wasteful. From crop residues, through processing (where substantial losses occur), to sale and consumption, approximately one-third of the food produced is thrown away.1
Waste substances can be viewed as secondary resources in the wrong place.4 Agro-industrial
wastes are generated during the industrial processing of agricultural products. These wastes are produced in great amounts throughout the year, and are the most abundant renewable resources on the planet.5 Agro-industrial wastes such as grape pomace, apple pomace, sugarcane bagasse,
wheat bran, rice bran, corn cob and wheat straw, are cheap and abundantly available natural carbon sources.
Such wastes can be used as low-cost substrates to produce added-value compounds. Moreover, most of the agro-industrial wastes contain molecules that may cause damage to the environment when discharged without prior treatment.5 Thus it is crucial to reutilize these wastes and mine
them for added-value, and to prevent their disposal to the environment and consequences therefrom.
The annual growth of plant-derived biomass is estimated to be 118×109 tons per year on a dry
matter basis. The lignocellulosic biomass materials are abundant, cheap and renewable.
1.2.1. L
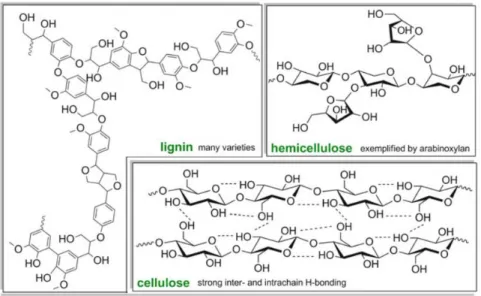
IGNOCELLULOSIC BIOMASSLignocellulose (Fig.1.2) is a renewable organic material and is the major structural component of all plants.5 Lignocellulose consists of three major components: cellulose,
21 Figure 1.2 Lignocellulose and its
constituents (adapted from reference 6).
Cellulose (Fig. 1.2) is the major constituent of all plants and the most abundant organic molecule on earth. It is a linear polymer of D-glucose units, connected by β-1,4-glycosidic bonds.7 It is thus
a homopolysaccharide.
Hemicellulose (Fig. 1.2) is a heteropolysaccharide formed by pentoses (mainly xylose and arabinose), hexoses (mainly mannose, less of glucose and galactose), and sugar acids.7
Cellulose and hemicellulose are bound together by lignin.4 Lignin (Fig. 1.2 - 1.3), which is the
22 Figure 1.3 The general chemical structure of the major biomass components.
The valorization of lignocellulosic materials is highly desirable because their constituents originate compounds that have high potential and commercial value. Such is the case of glucose, a preferred carbon source for microorganism growth, xylitol, furfural or xylo-oligosaccharides from hemicellulose that can be used as a low glycemic sweetener, a platform chemical, or prebiotics, respectively, and adhesives, or high-quality carbon fibers, obtained from lignin.8
Other important biomass constituents, although appearing in comparatively minor amounts, are phenolic compounds with antioxidant and antimicrobial activity, with applications in the pharmaceutical and food industries.9 Other added-value compounds appear further down the
value chain of biomass constituents. Examples include biofuels, such as bioethanol, lipids and carotenoids, which can be produced by microorganisms grown on biomass-derived carbohydrates.
1.3. GRAPES AND GRAPE POMACE
1.3.1. G
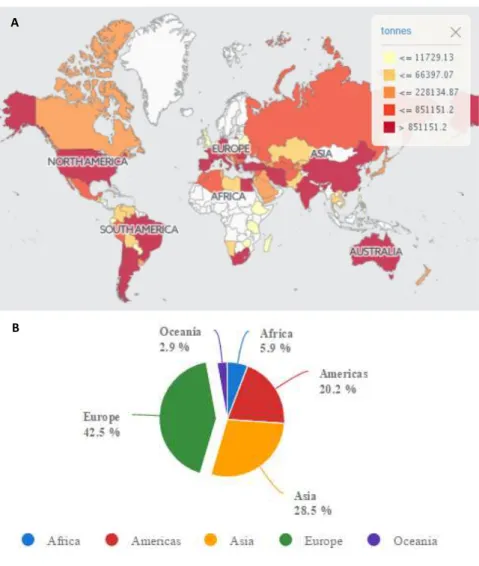
RAPESAccording with FAO (Food and Agriculture Organization of the United Nations), grape crops are one of the main extensive agro-economic activities in the world. An average of 67.5 million tons of grapes were produced annually between 2000 and 2014 (Fig. 1.4).
23 Figure 1.4 Worldwide production of grapes (A). Europe is the main world grape
producer followed by Asia and America (B) (content taken from reference 10).
1.3.2. G
RAPEP
OMACEGrape by-products are produced in massive quantities, especially by the winemaking industry. During wine production, approximately 25% of the grape weight ends up as the by-product/waste designated as ‘pomace’ (Fig. 1.5).11 This pomace comprises stalks (30%), seeds
(30%) and skin and pulp (40%).12 Basically, grape pomace is the residue that remains after
pressing grapes for obtaining juice. A
24 Figure 1.5 Red grape pomace.
Grape pomace has a water content between 60% - 80%.13 Its composition varies widely,
especially depending on the type of wine produced. For example, white wine grape pomace has a high content of soluble, immediately available glucose and fructose, because it does not suffer fermentation. These monosaccharides are abundant in grapes at the time of harvest. On the other hand, fermented, red wine grape pomace, has a low amount of soluble carbohydrates, and a high amount of structural ones. The composition of red wine grape pomace varies according to the type of grape, indicative values being approximately 5% soluble carbohydrates, 30% cellulose, 15% hemicellulose, 30% lignin, 10% protein and 10% lipids.14 The disposal of grape pomace is a
problem for the wine industry, because it represents thousands of tons, and if not treated, grape pomace can create various environmental threats, from surface and ground water pollution to fetid odors that attract insects (due to composting), pests, and can easily spread diseases.15
Composting is a natural process whereby organic material suffers aerobic microbial decomposition, originating a rich soil known as compost. Organic compounds are broken down into natural elements, such as carbon and nitrogen. The high C:N ratio provides nutrients for the microbes to survive and continue degradation.11 When the purpose is the valorization of grape
pomace, composting must thus be avoided, and this is usually accomplished by freezing to prevent microbial proliferation.
1.4. BIOMASS HYDROLYSIS
Lignocellulose has become a major target for biofuel and chemical feedstock production. Nonetheless, the lignocellulosic matrix is a very resilient material. To access its structural constituents, its complex, polymeric structure, must be disrupted.
25 mechanical action to break down hemicellulose and transform lignin, increasing the accessibility of cellulose. Water is a cheap, non-toxic, non-flammable, non-explosive, sustainable solvent. But vaporizing water into steam requires a high amount of energy.7
Through acid hydrolysis, cellulose and hemicellulose are hydrolyzed to sugar monomers. Although acid hydrolysis is a common method to characterize lignocellulosic biomass, it generates a high environmental load, and causes corrosion problems.
Development of a lignocellulose pretreatment featuring moderate reaction conditions is highly desired. One alternative to the methods outlined above is hydrothermal hydrolysis, also referred to as hot compressed water hydrolysis, or subcritical water hydrolysis. As in steam explosion, only water is used, but in this case water is not vaporized and hence the energy involved is much lower. Also the process can be carried out without additives.16
1.4.1.
SUBCRITICAL WATER
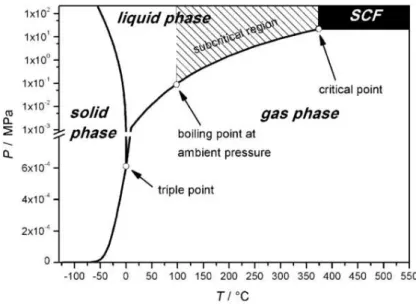
Supercritical fluids are substances at pressures and temperatures above their critical values (Figure 1.6). When the fluid reaches the supercritical region, it exhibits simultaneously a set of gas-like and liquid-like properties.
A low viscosity, high diffusivity and almost no surface tension17 are properties that
supercritical fluids share with common gases, which facilitate the permeation of solid matrices and improve mass transfer rates. But a main characteristic of supercritical fluids, which is at the root of their utility as solvents, is a density/solvent strength similar to that of liquids. Also, this parameter is easily adjustable close to the critical point, which allows the fractionation of mixtures of different solutes.
26 Figure 1.6 Water phase diagram, indicating the subcritical region
below the critical point and above the vaporization curve (content taken from reference 18).
Generally, solid, liquid, and gaseous products are formed at all temperatures when using water. However, the extent of the respective main product formation shifts from solid (at low temperature), to liquid (medium temperature), to gaseous (at high temperature) products.18
Table 1.1 Prevailing hydrothermal biomass conversion processes (content taken from reference 18).
Process Temperature window (°C)
Hydrothermal carbonization 100-200 Hydrothermal liquefaction 200-350 (5 – 28 MPa) Hydrothermal gasification 350-750
Subcritical water (SBW) has a set of very interesting properties for biomass pretreatment. It features different behavior compared to water at ambient conditions due to the dramatic changes in physical properties, namely dielectric constant and ionic product.
The dielectric constant of SBW (water polarity) decreases abruptly with temperature, due to hydrogen bond dissociation. Hence, the solubility of ionic molecules decreases, while the solubility of hydrophobic molecules increases. This enables the extraction of compounds that are normally extracted with organic solvents.
Ionic strength is another water property that changes pronouncedly. The ionic product of SBW at 250 ºC is nearly three orders of magnitude higher than for ambient liquid water. 19 This leads to
an increase in H+ and OH- concentrations, making water a more reactive medium. Water behaves
as a reagent as well as a solvent.18 This property makes subcritical water an ideal reaction
27 Also using SBW, large-chain carbohydrates can be broken down into simpler structures, such as oligomers or even di- and mono-saccharides. The rate of hydrolysis varies between different carbohydrates, hemicelluloses and starch being hydrolyzed much faster than cellulose due to the crystallinity of the latter.21
SBW is being extensively researched and developed as a technology for converting lignocellulosic matrices into fuels and added-value products, as well as for converting protein-rich wastes into amino acids.4,22 A large amount of waste biomass has water contents of over 95%,
whose elimination is extremely energy-intensive and thus costly. Hence there is increased interest in SBW as an alternative to other biomass pretreatment techniques.
SBW has lower viscosity and surface tension than water at ambient temperature, which increases mass transfer rates from solid matrices.9
SBW hydrolysis has been applied to a few agricultural and food industry residues, relevant examples including corn stalks and stover, sugarcane bagasse, rice bran, grape pomace, pressed palm fiber and coconut husk.23 SBW hydrolysis is a clean technology and a fast hydrolysis method
applicable to lignocellulosic biomass as a pretreatment step. As mentioned earlier, the simple sugars that can be obtained from the cellulose and hemicellulose fractions of lignocellulosic materials can be used as substrate to produce bioethanol or other precursors of bio-products.24
Another possible product could be lipids, produced by yeasts grown on these simple sugars, as it will be developed further in chapter 1.6.
1.5. ENZYMATIC HYDROLYSIS
One of the most important roles of enzymes as natural biocatalysts is their ability to increase the rate of almost all chemical reactions within a cell, without themselves being permanently altered or consumed in the reactions. Enzymes work under mild reaction conditions, and are selective, avoiding the generation of by-products.
To use lignocellulosic residues as substrates, for example, for yeast growth and the production of industrially important products, it is necessary that the polysaccharides cellulose and hemicellulose be converted into simple sugars that can be assimilated by the microorganisms, through hydrolysis and consequent breaking down of glycosidic bonds.
1.5.1.
CELLULASE AND HEMICELLULASE
28 The conversion of cellulose to glucose units is most commonly made with cellulases, which do not generate degradation products from glucose, unlike what happens when using alternative hydrolysis treatments.
Much effort has been made to develop cellulosic bioethanol, directed towards making hydrolysis faster, at a more favorable and less costly enzyme:substrate ratio.
Hemicellulase is a term used to define a variety of enzymes that hydrolyze hemicellulose structures, such as xylan, arabinan, arabinogalactan. A common example of a hemicellulase is xylanase that hydrolyses xylan.
Together, cellulases and hemicellulases can hydrolyze the polysaccharides of lignocellulose, originating monosaccharides that can be assimilated by microorganisms to produce compounds of interest.
However, the lignocellulosic matrix is too complex to be hydrolyzed directly, and efficiently, with enzymes. A pretreatment is required, to increase enzyme accessibility and allow enzyme action.
1.5.2.
ENZYME IMMOBILIZATION
To make enzyme application in biotechnological processes more favorable, different methods for cost reduction have been put in practice, such as immobilization. Enzyme immobilization consists in physically confining enzymes in a certain region of space, usually resorting to a material acting as support, with retention of catalytic activity and enhanced stability, allowing repeated, continuous use, and easy recovery.
Basically, immobilization methods can be divided into two general classes: physical and chemical methods. Physical methods are characterized by noncovalent interactions, such as hydrogen bonds, hydrophobic interactions, van der Waals forces, ionic interaction of the enzyme within the support material, or mechanical constraint of enzyme within the support. In chemical methods, formation of covalent bonds achieved through ether, thioether, amide or carbamate bonds between the enzyme and support material are involved.25
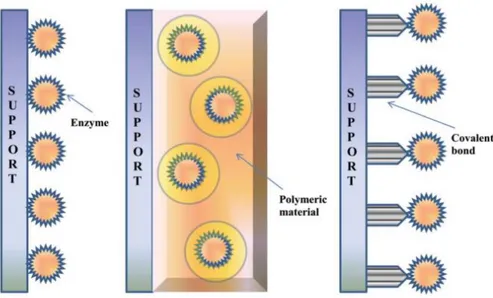
29 Figure 1.7 Schematics of the three most common enzyme immobilization
techniques: (A) physical adsorption, (B) entrapment and (C) covalent attachment / cross-linking (content taken from reference 25).
Adsorption consists on enzyme immobilization either at the external surface of a support, or within pores in the support. The support or carrier is commonly mineral, such as a zeolite, or modified sepharose, or an ion exchange resin. There is no permanent bond formation between carrier and the enzyme in this method. Only weak bonds stabilize enzyme-support interactions, which may lead to enzyme leaching. When the enzyme is adsorbed within pores of the support, internal diffusion limitations may exist.
Covalent bonding involves the formation of strong, directional bonds, between the chemical groups on the enzyme and the chemical groups on the support. Hydroxyl and amino groups of support or enzyme form covalent bonds more easily. Carriers commonly used in this method are carbohydrates, such as cellulose, or Eupegit® (copolymer of methacrylamide). One advantage of
covalent bonding is the strong linkage of enzyme to the support, but one disadvantage is the chemical modification of the enzyme that can lead to the loss of its functional conformation.
Through entrapment the enzyme is physically restrained inside a porous matrix. Bonds involved in stabilizing the enzyme in the matrix may be covalent or noncovalent. The pore size of the matrix is adjusted to prevent the loss of the enzyme, through manipulation of experimental parameters. Commonly used matrixes are polyacrylamide gels, cellulose triacetate, agar, gelatin, carrageenan, alginate, and silica, as in sol-gel. Again, leaching of the enzyme may occur, as well as diffusion limitations. Enzymes can also be entrapped within micelles, formed by using a surfactant.
30 method is that the reagents used in cross-linking may denature or structurally modify the enzyme, leading to the loss of catalytic activity.
1.6. OLEAGINOUS YEASTS & LIPID BIOSYNTHESIS
1.6.1. O
LEAGINOUSY
EASTSThe growth of oleaginous yeast on lignocellulosic biomass is being exploited as an effective option for lipid accumulation and generation of microbial oil.26 Oleaginous yeasts are
usually non-pathogenic, and known to accumulate lipids up to 40% of their total dry weight. Under starvation conditions, oil production can exceed 70% of cell dry weight.27
The ability to grow on a broad spectrum of carbon sources, such as grape pomace agricultural waste, makes oleaginous yeasts economically interesting. They can be used as microbial factories to produce various compounds with industrial utility.
Approximately 1500 species of yeast belonging to over 100 genera have been described so far.28
Among the huge number of species that have been described, only about 30 are able to accumulate more than 25% of their dry weight as lipids.29 These include Lipomyces starkeyi,
Yarrowia lypolytica, Rhodoturula glutinis, Rhodotorula toruloides, Cryptococcus curvatus,
Trichosporon fermentans, Rhodotorula mucilaginosa, and Rhodotorula babjevae.
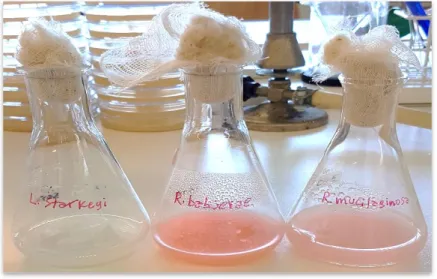
Rhodotorula babjevae, Rhodotorula mucilaginosa and Lipomyces starkeyi were used for lipid
production in this thesis (Fig. 1.8).
Figure 1.8 Oleaginous yeast species used in the study. From the left to the right: L. starkeyi, R. babjevae and R. mucilaginosa.
31 Lipids are found mainly in the form of neutral lipids, glycolipids, phospholipids and free fatty acids. The fractions of neutral lipids, in general, accounts for more than 90% of total lipids.30 The classes
of lipids present, as well as the ratio of membrane lipid to storage lipid, vary among species and strains, culture conditions, such as pH and carbon-source concentration, and culture growth phase.31
A screening of lipid production by over sixty yeast strains, with analysis of fatty acids proportion and profile, showed that the major fatty acids represented were oleic (18:1ω9), palmitic (16:0), stearic (18:0), and linoleic (18:2ω6) acids, with minor contributions from lignoceric acid (24:0), palmitoleic (16:1ω9), behenic acid (22:0), myristic acid (14:0), α-linolenic (18:3ω3), and arachidic acids (20:0). Other fatty acids were observed in trace amounts.31
1.6.2. L
IPIDB
IOSYNTHESISP
ATHWAYIn oleaginous yeasts, the initiation of TAG accumulation (Fig. 1.9) often occurs under nitrogen-depletion conditions. Upon nutrient limitation, the carbon-source is diverted from energy production, via the tricarboxylic acid cycle (TCA), to TAG synthesis.
32 Figure 1.9 Biochemistry of triacylglycerol (TAG) accumulation in oleaginous yeast (Probst et al., 2015). Abbreviations: endoplasmic reticulum (ER), tricarboxylic acid (TCA), isocitrate dehydrogenase (ICDH), malic enzyme (ME), fatty acid synthase (FAZ), acetyl-CoA carboxylase (ACCase), glycerol-3-phosphate acyltransferase (GPAT), lysophosphatidic acid acyltransferase (LPAAT), phosphatidate phosphatase (PAP), diacylglycerol acyltransferase (DGAT) (content taken from reference 32).
The general mechanism of lipid accumulation in oleaginous yeast has not yet been fully clarified. Examination of enzymatic activity33 and comparative genomics34 suggest that ATP:citrate lyase
(ACL) may play a role in directing excess carbon to be stored as lipids, rather than carbohydrates, in oleaginous yeasts.
Lipid accumulation is prompted by a nutrient limitation combined with an excess of carbon. Lipids can be accumulated within the cell in two different ways35, namely de novo synthesis and ex novo
synthesis. In the former, lipid accumulation is induced by depletion of an essential nutrient in the culture medium, such as nitrogen. In this case, lipid accumulation reaches a peak in the early stationary phase, when the growth medium is nitrogen-depleted, but there is still excess carbon source in the medium.36 In ex novo synthesis, lipid accumulation occurs simultaneously with cell
growth, being completely independent of the nitrogen deprivation in the growth medium.
33
1.6.3. S
INGLE CELL OILSingle cell oil (SCO) is a designation that applies to neutral lipids accumulated by oleaginous microorganisms (yeast, fungi, microalgae) 32
Microorganisms can use organic carbon to produce SCO more efficiently, with higher productivity, than the best producing oil crops. SCO from oleaginous yeast may serve as a renewable source of edible oil, as well as an intermediate “building block” for oleochemicals, such as fuels (for example, biodiesel38), soaps, plastics, paints, detergents, textiles, rubber, surfactants, lubricants,
additives for the food and cosmetic industry, and many other chemicals.30
The cost of yeast SCO has been estimated as 2.9 €/kg, excluding feedstock costs, or 4.7€/kg, including the cost of glucose as a feedstock.13 Use of low cost waste and by-product streams,
such as those from an integrated biorefinery, will be needed for yeast SCO to be competitive with other commodity type oils. In this respect, grape pomace is a good candidate to be used as a carbon-source material to produce SCO.
1.6.4. C
AROTENOIDSCarotenoids are pigments whose biological effects in humans are related to their antioxidant activity. The most common carotenoids include carotenes, such as α- and β-carotene, lutein and astaxanthin, which are thought to have beneficial effects on eye and vision, and lycopene, a known food coloring found in tomatoes.
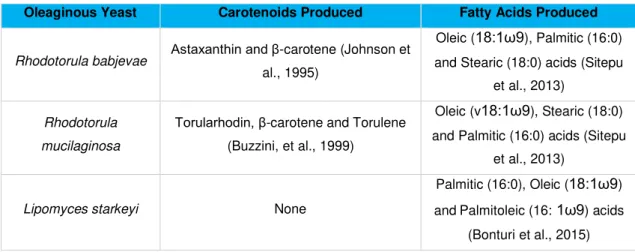
The production of carotenoids by oleaginous yeast varies between species, and is affected by medium constituents and environmental conditions. The yeasts studied in this thesis have the potential to be used in the industrial production of the fatty acids and carotenoids indicated in Table 1.2. Torularhodin, β-carotene and torulene have provitamin-A activity.37
Table 1.2 Dominant carotenoids and fatty acids produced by the oleaginous yeasts used in this study. Oleaginous Yeast Carotenoids Produced Fatty Acids Produced
Rhodotorula babjevae Astaxanthin and β-carotene (Johnson et
al., 1995)
Oleic (18:1ω9), Palmitic (16:0) and Stearic (18:0) acids (Sitepu
et al., 2013)
Rhodotorula mucilaginosa
Torularhodin, β-carotene and Torulene (Buzzini, et al., 1999)
Oleic (v18:1ω9), Stearic (18:0) and Palmitic (16:0) acids (Sitepu
et al., 2013)
Lipomyces starkeyi None
Palmitic (16:0), Oleic (18:1ω9) andPalmitoleic (16:1ω9) acids
34
1.6.5. B
IOMASS HYDROLYSATES AS CARBON SOURCE FOR YEAST GROWTHValuable chemicals, including oligosaccharides, monosaccharides, and secondary decomposition products such as 5-hydroxymethyl-furfural (5-HMF) and 2-furaldehyde, have been produced by hydrothermal degradation of various natural polysaccharides such as cellulose, hemicellulose, starch, guar gum, and polygalacturonic acid.16 These natural polysaccharides can
be obtained from corn stalks and stover, sugarcane bagasse, rice bran, grape pomace, pressed palm fiber and coconut husk, among others.23
Using hydrolysates for microbial oil production could reduce the cost of SCO production, which is critical to the success of industrial scale-up.38-40 In the natural environment, yeast species have a
broad set of carbon sources (e.g., polyols, alcohols, organic acids and amino acids) that can support their growth, but preferentially they metabolize sugars. The metabolism of different carbon sources, such as the sugar monomers glucose, fructose, galactose or mannose, and disaccharides, such as maltose or sucrose, as well as ethanol or acetate, is widely studyed.39
Examples of oleaginous yeasts that can grow on a wide variety of monosaccharides and some disaccharides include R. babjevae and R. mucilaginosa, shown to be able to grow in medium supplemented with glucose, xylose, galactose, arabinose, fructose, sucrose, maltose or cellobiose as carbon-sources.40 The oleaginous yeast Lipomyces starkeyi also utilizes diverse
carbon sources including glucose, xylose, glycerol.26
An important aspect is also the sensitivity of yeast species to the presence of inhibitors in the hydrolysates used for the conversion of carbohydrates to lipids. These inhibitors can not only inhibit the growth of the oleaginous species, but also lead to a decrease in cellular lipid content.41
1.7. THESIS OUTLINE
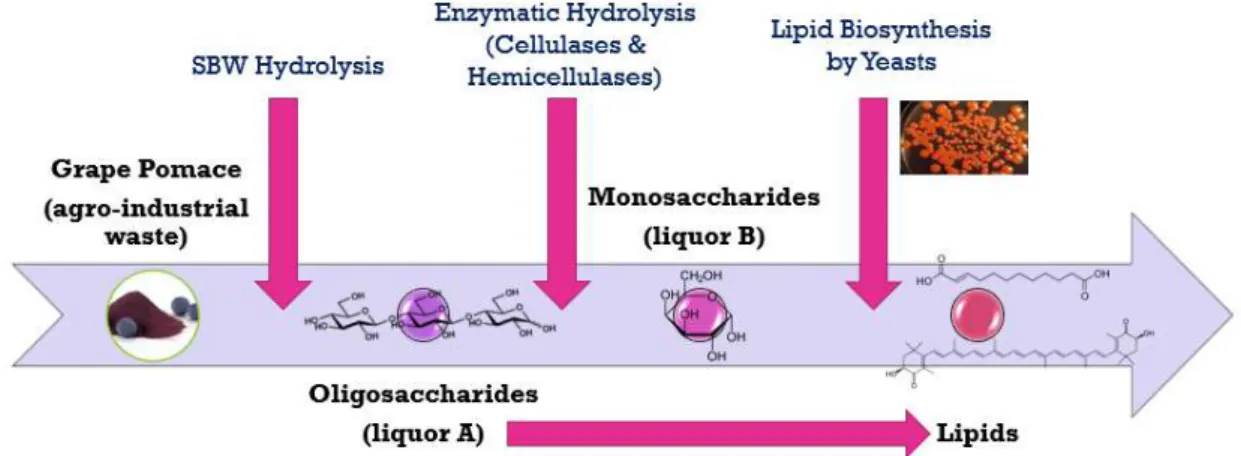
The main goal of this thesis is to use grape pomace as a source of carbohydrates for yeast growth and the production of lipids, and carotenoids.
Towards that end, grape pomace was submitted to SBW hydrolysis as a pretreatment to depolymerize the lignocellulosic structure and obtain a liquor (liquor A), consisting mainly of oligosaccharides. Experiments were conducted on the growth of yeast strains on the GP extract resulting from this liquor, under conditions conducive to lipid accumulation, and formation of carotenoids (Fig. 1.10).
37
2 MATERIALS AND METHODS
2.1. CHEMICAL
CHARACTERIZATION OF
GRAPE
POMACE AND DERIVED
MATERIAL
2.1.1. G
RAPE POMACE ANDGP
POWDERRed wine grape pomace was supplied by a Portuguese wine producer. Grapes were destemmed before pressing. Grape pomace (GP) from grapes pressed on a given day was delivered the following day. It was immediately put in plastic bags and placed in the freezer, where it was kept refrigerated at -20 ºC.
A comparative analysis was made on the method of drying GP, namely lyophilization (freeze drying), or oven drying. In the first assay, GP was taken from the freezer, immersed in liquid nitrogen and lyophilized under vacuum for 48 h in a lyophilizer (CHRIST ALPHA 1-4, Braun Biotec International). In the second assay, GP was heated at 60 ºC in an oven, for 48 h. In both cases, dried GP was allowed to reach room temperature, milled to ca. 2 mm, and the water content of each residue was determined gravimetrically, by measuring its mass before and after drying overnight in an oven at 105 ºC.
When not in use, GP powder was kept refrigerated at -20 ºC.
2.1.2. P
ROTEIN DETERMINATIONThe nitrogen content of GP powder was determined by elementary analysis performed at Laboratório de Análises, REQUIMTE-LAQV. To determine protein content, a nitrogen-to-protein conversion factor of 6.25 was used.
2.1.3. A
SH DETERMINATIONTo determine ash content, 0.10 g of GP powder were weighed in a glass filter in a porcelain crucible, and placed in a muffle at 550 ºC. The crucible was removed after 6 h and placed in a desiccator, overnight, to cool down, after which ash content was determined by gravimetry.
2.1.4. C
ARBOHYDRATES ANDL
IPID CONTENT38 agreement.
For soluble carbohydrate analysis, the defatted GP powder (0.80 g) was extracted with 40 mL of a (80:20, v/v) ethanol:water solution, in an ultrasonic bath, for 15 minutes, at room temperature. The extraction was finished by centrifugation (10000 rpm, for 10 min, at 4 °C). The process was repeated three times. The three supernatants were combined and ethanol was evaporated at 50 °C, under vacuum, in a rotary evaporator. The remaining solution was diluted with 80 mL of water and then analyzed by UV-Vis spectrophotometry – colorimetric method, described in section 2.1.5 – to quantify soluble carbohydrates. It was also analyzed by HPLC (high performance liquid chromatography). The remaining residue – defatted GP powder without soluble carbohydrates – was dried at 40 °C overnight.
To hydrolyze the insoluble structural carbohydrates, 3 mL of 72% (w/w) H2SO4 were added to
0.30 g of the remaining residue. The mixture was incubated in a water bath at 30 °C, under stirring, for 1 hour. After that, the mixture was diluted to 4% (w/w) by adding 84 mL of water, and incubated at 121 °C in a silicone bath, under stirring, for 1 hour. The mixture was then filtered in porcelain filters, and the supernatant analyzed by UV-Vis spectrophotometry – colorimetric method described in section 2.1.5 – to quantify the sugar monomers resulting from structural carbohydrates. It was also analyzed by HPLC.
The solid remaining after acid hydrolysis was washed with water, dried at 105 ºC overnight, and weighed. Its ash and nitrogen contents were determined as stated above. The amount of Klason lignin was obtained by subtracting resistant protein and acid insoluble ash from the weight of dry residue.
2.1.5. C
OLORIMETRICM
ETHOD FORC
ARBOHYDRATEA
NALYSISThis method (phenol-sulphuric) is used to quantify the reducing sugar content of the sugar-rich liquors, using a calibration curve built with D(+)-glucose monohydrate (SIGMA Aldrich) solutions. These were prepared from a 1 g/L stock solution, with concentrations of 0.25, 0.1, 0.05, 0.025 and 0.005 g/L in milli-Q water. The control was milli-Q water.
To 500 µL of either a standard solution or sugar-rich liquor were added 1.5 mL of H2SO4 (Carlo
Erba Reagents, 96%) and 300 µL of a 5% (w/v) aqueous solution of phenol (Sigma Aldrich, 99-100%). The resulting mixtures were well stirred. After incubation for 5 min at 90 ºC in an Accu BlockTM Digital Dry Bath, the mixtures are well stirred, and cooled to room temperature by immersion in a water bath. Absorbance was measured at 490 nm with a DU®800
39
2.1.6. HPLC
M
ETHOD FORC
ARBOHYDRATEA
NALYSISThe HPLC technique was used to identify and quantify sugars (monosaccharides, such as glucose, fructose, galactose, arabinose, mannose, rhamnose, and xylose) in GP-derived liquors and extracts. All the analyses were performed at Laboratório de Análises, LAQV-REQUIMTE, with a Dionex ICS-3000 system, with electrochemical detection, using a 4x50 mm Thermo BioLC Dionex AminoTrap pre-column and a 4x250 mm Thermo Dionex CarboPac SA10 column, at a constant temperature of 40 ºC. A 1 mM NaOH solution was used as mobile phase, at a constant flow rate of 1.2 mL/min. Calibration curves were built for the monosaccharides (25, 50, 75, 100, 150, and 250 ppm).
Alternatively, HPLC analyses were performed with a Dionex P580 system, using a differential refractometer LKB, model 2142, and an Aminex HPX-87P column (BIORAD), at a constant temperature of 65 ºC. Sterile water was used as mobile phase, at a constant flow rate of 0.6 mL/min. Calibration curves were built for the monosaccharides, covering the range of concentrations required, and peak integration and analysis were made automatically using the Chromeleon data acquisition software.
2.2. HOT COMPRESSED WATER HYDROLYSIS
2.2.1. H
OT-C
OMPRESSEDW
ATERA
PPARATUS ANDR
EACTIONC
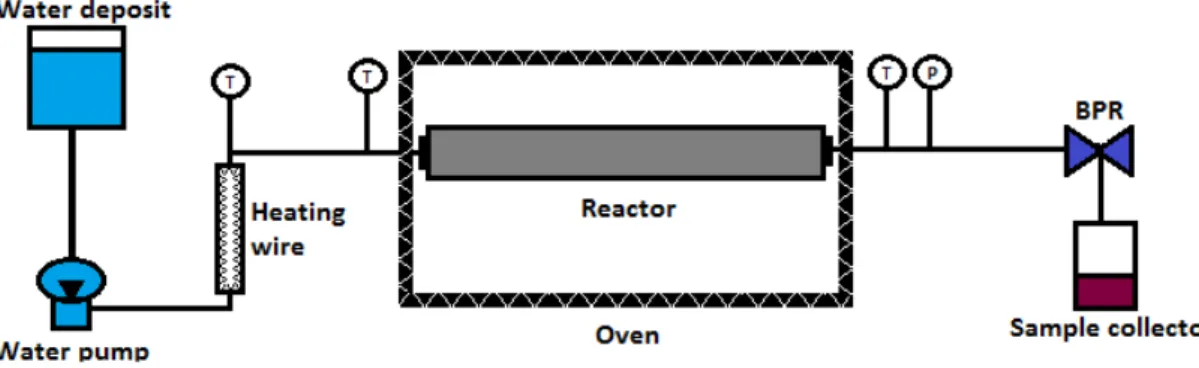
ONDITIONSA high pressure, high temperature, semi-continuous reactor (Fig. 2.1) was used to extract / hydrolyze GP using SBW.
The body of the reactor is of stainless steel, and it is 51 cm long, having a 5 cm external diameter and a 2.6 cm internal diameter.
Figure 2.1 Schematic representation of the subcritical water (SBW) semi-continuous experimental set-up. P – pressure regulator (manometer); T - temperature regulator (thermocouple); BPR - back pressure regulator.
40 Preparative pump 1800) through a high-pressure tube connected to the reactor, filled with GP powder and glass spheres, to avoid compacting the GP bed. The reactor is placed inside an oven with temperature control.
After passing through the reactor, water goes through a filter, on to the sample collector for further analysis. Water temperature and pressure are monitored before and after the reactor. The pressure of the system is controlled by a Back-Pressure Regulator (BPR, Tescom Europe®, 26-1000).
In all the assays, pressure was kept constant at 70 bar, and four target temperatures were used: 190, 200, 220 and 240 ºC. The water flow rate was kept constant at 10 mL/min.
To initiate an experiment, the water pump is turned on with the selected flow rate, and the BPR is set for 70 bar. When pressure reaches this value, the water heating wire and the oven are turned on, and sample collection (in common Schott flasks) begins.
Two different types of SBW extraction/hydrolysis assays were performed. In the first ones, temperature increased continuously to the target temperature. The initial sample was collected until the temperature of the water exiting the reactor reached 50 ºC, the second sample as the water outlet stream temperature varied from 50 to 130 ºC, and the third sample as the water temperature varied from 130 to the maximum temperature chosen for that assay. From then on, temperature was kept constant for 30 minutes and the final sample was collected.
In the second ones, referred to as plateau assays, the temperature program established a series of two or three steps, with each step consisting of a ramp followed by a plateau. For example, in the assay targeted at 240 ºC, six samples were collected. One sample was collected in each of the three temperature ramps, as the temperature of the water exiting the reactor varied from ambient to 130 ºC, from 130 to 190 ºC, and from 190 to 240 ºC. One sample was also collected in each of the three plateaus, as temperature was kept constant, for 30 minutes, at 130 ºC, at 190 ºC, and finally at 240 ºC.42
Samples – liquors – were stored at -20ºC.
2.2.2. E
XTRACTION/
HYDROLYSIS EFFICIENCY,
Y
IELD INGP
EXTRACT,
ANDC
ARBOHYDRATE QUANTIFICATIONEach liquor sample was used for sugar quantification based on the colorimetric method. Also sugar monomer quantification was performed, using HPLC. For this purpose, a 5 mL sample from each liquor collected was lyophilized to obtain GP extract. The amount of GP extract generated in each assay allowed the calculation of the yield in GP extract.
41 degree of SBW extraction/hydrolysis. The residue was also characterized with the methodology described in chapter 2.1, and analyzed for its content in lipids, carbohydrates, lignin and protein.
The GP extract was submitted to a one-step (instead of a two-step) acid hydrolysis, a softer hydrolysis.43
After analyzing each liquor sample separately, all the samples collected throughout the whole SBW assay were mixed together and lyophilized. The extract obtained was stored at -20 ºC. The liquor containing the most carbohydrates was used for yeast growth.
2.3. ENZYMATIC HYDROLYSIS
2.3.1. P
REPARATION ANDA
CTIVATION OFC
HITOSANP
ARTICLESA (2% w/v) chitosan solution was prepared by dissolving 500 mg of chitosan (SIGMA-ALDRICH, ref: 448869) in 0.35 M acetic acid (25 mL). The solution was stirred for 5 hours without heating and placed for 20 minutes in an ultrasound bath to remove bubbles. The chitosan solution was added dropwise, with a syringe, to 100 mL of an alkaline coagulation solution composed by 1 M sodium hydroxide and ethanol (26% v/v), under gentle stirring (60 rpm), to obtain particles with approximately 2 mm diameter. The chitosan particles were washed with distilled water until neutrality.
Chitosan activation was achieved by incubation of the chitosan particles in 100 mL of a glutaraldehyde solution (4% v/v) prepared in 0.1 M sodium phosphate buffer at pH 7.0. Incubation was performed at room temperature, during 3 hours, in an orbital shaker at 120 rpm. An erlenmeyer was used to obtain a greater contact area between the particles and the solution. The activated support was exhaustively washed with 50 mM sodium acetate buffer at pH 5.,5 to remove excess glutaraldehyde.44, 45
2.3.2. E
NZYMEI
MMOBILIZATIONChitosan particles were incubated with an enzyme solution prepared by dissolving 125
μL of enzymatic solution (SIGMA-ALDRICH Viscozyme® L) in 100 mL of a 50 mM sodium acetate buffer at pH 5.5, and incubating with the chitosan particles for 3 hours at room temperature, under gentle stirring. The immobilized enzyme was washed with 50 mM sodium acetate buffer, pH 5.5, and washed over again with a 1 M sodium chloride and ethylene glycol (30% v/v) solution, to remove unbound, ionically and hydrophobically bound enzyme molecules. The washing liquids were collected to quantify protein by the Lowry method.44,45,46
42 to 1 μmol glucose/min. Viscozyme has approximately 7 wt.% enzyme and 23 wt.% sucrose as stabilizer. It has a density of 1.21 g/mL, yielding an activity of approximately 0.121 FBG/L. 44,47
2.3.3. A
RABINOGALACTAN AS AM
ODELS
UBSTRATE FORE
NZYMATICH
YDROLYSISEnzyme immobilization was tested with a model substrate, arabinogalactan (SIGMA-ALDRICH, ref: 10830). Both free and immobilized Viscozyme were tested for arabinogalactan hydrolysis, following the method below.
In a 15 mL vial, to a 150 mg sample of arabinogalactan were added 5 mL of 0.1 M sodium citrate buffer, pH 4.8, 20 μL of sodium azide 10% (v/v), 5 mL distilled water, and 75 μL of Viscozyme. The enzyme solution was always added last since the reaction is initiated by the addition of enzyme. In the assay with the immobilized enzyme, 250 mg of the activated support, with a bound amount of enzyme calculated to be equivalent to the free enzyme present in 75 μL of Viscozyme solution was used.
The contents of each vial were brought to 50 ºC by warming in the orbital shaker under stirring at 160 rpm. The vials were closed tightly and placed in a scintillation vial rack suitable for the shaking incubator, until the release of soluble sugars from the sample(s) became negligible when measured. To detect that condition, 500 μL aliquots were removed at predetermined times. The samples were centrifuged at 12000 rpm for 5 min, and then filtered through a 0.22 µm filter, and the supernatant was analyzed for carbohydrates.48
Blank assays were done without enzyme, and with enzyme but without substrate.
2.3.4. L
IGNOCELLULOSICB
IOMASSS
ACCHARIFICATIONIn a 15 mL vial, to a 150 mg sample of GP were added 5 mL of 0.1 M sodium citrate buffer, pH 4.8, 20 μL of sodium azide 10% (v/v), 5 mL distilled water, and 250 μL of Viscozyme. In the assay with the immobilized enzyme, 250 mg of the activated support, with a bound amount of enzyme calculated to be equivalent to the free enzyme present in 75 μL of Viscozyme solution was used.
Blank assays were done without enzyme, and with enzyme but without substrate.
The reaction conditions were the same as in chapter 2.3.3 (Arabinogalactan as a model substrate for enzymatic hydrolysis).
2.3.5. L
OWRYM
ETHOD FORP
ROTEINQ
UANTIFICATION43 total volume of 200 L.
Each sample to be analyzed (200 L) required the addition of 1 mL Lowry reagent, prepared as follows: 2% (w/v) sodium and potassium tartrate solution (diluted 1:100) + 2% (w/v) copper sulphate penta-hydrated solution (diluted 1:100) + filling with 30 g/L sodium carbonate and 4 g/L sodium hydroxide solution until 25 mL final volume.
After addition of 1 mL Lowry reagent to 200 L of each sample in an Eppendorf, its contents were vortexed for 5 s, and the solution was left to stand at room temperature for 10 minutes. 200 μL of Folin-Ciocalteau reagent (diluted 1:2) were added to each eppendorf, vortexed for 5 s, and left to stand at room temperature for 30 minutes. Then, the samples were analyzed in the spectrophotometer at 750 nm wavelength.
2.4. OUTLINE OF THE PROGRESSION OF BIOMASS FRACTIONATION
Grape pomace (GP) was, first of all, chemically characterized, to determine its content in lipids, soluble and structural sugars, proteins, ashes and lignin. The weight of GP loaded into the reactor, together with the weight of GP residue left in the reactor after hydrolysis with subcritical water (SBW), allowed the determination of the extraction / hydrolysis efficiency of the process. The output of the SBW extraction / hydrolysis was a liquor that was lyophilized to obtain a GP extract. The weight of GP extract together with the weight of GP loaded into the reactor allowed the determination of the yield of GP extract.
The GP residue left in the reactor was chemically characterized. The GP extract was characterized only in what concerns its sugar content and sugar profile.
45
2.5. YEASTS GROWTH MEDIUM, INOCULUM & CELLS GROWTH
All the yeast strains used in this work were supplied by the Portuguese Yeast Culture Collection (PYCC), Caparica, Portugal (Table 2.1).
Yeast strains were maintained in a cold chamber at 4 °C on yeast extract peptone dextrose (YPD) medium containing: 20 g/L glucose, 10 g/L peptone, 10 g/L yeast extract, and 20 g/L agar.
Table 2.1 Yeast strains used in the present study.
Yeast Origin
Rhodotorula babjevae Leaves Rhodotorula mucilaginosa Water
Lipomyces starkeyi Soil
2.5.1. G
ROWTHM
EDIUMThe growth medium used in control experiments for lipid production was optimized by Li et al.49 The medium containing 70 g/L glucose, 0.1 g/L (NH4)2SO4, 0.75 g/L yeast extract, 1.5 g/L
MgSO4·7H2O, 0.4 g/L KH2PO4, was sterilized at 121 °C for 15 min, and supplemented with
1.91×10⁻⁶ mmol/L ZnSO4, 1.50 mmol/L CaCl2, 1.22×10⁻⁴ mmol/L MnCl2, and 1.00×10⁻⁴ mmol/L
CuSO4. Carbon source were prepared ten times concentrated with 70g of glucose in 100 mL of
sterile water, after which it was sterilized by filtration under vacuum. A minimal medium solution containing the main reagents was prepared in 90mL sterile water and pH was adjusted. A supplements solution containing the minor components (ZnSO4, MnCl2 and CuSO4) was prepared
1000 times concentrated in 10mL sterile water. In a second experience, glucose amount was reduced to 35g/L. The amount of yeast extract and (NH4)2SO4 were reduce accordingly.
GP extract medium was the same developed by Li et al, but with some modifications. The medium containing 39 g/L carbohydrates from the liquor, 0.1 g/L (NH4)2SO4, 0.75 g/L yeast powder, 1.5
g/L MgSO4·7H2O, 0.4 g/L KH2PO4, was sterilized at 121 °C for 15 min, and was then
supplemented with 1.91×10⁻⁶ mmol/L ZnSO4, 1.50 mmol/L CaCl2, 1.22×10⁻⁴ mmol/L MnCl2, and
1.00×10⁻⁴ mmol/L CuSO4, and centrifuged at 20000rpm for 15 min, to remove the pellet.
2.5.2. G
ROWTH46
2.5.3. O
PTICALD
ENSITYGrowth was followed by optical density at 640nm (Amersham Biociences, Ultrospec 3100 Pro UV/Visible Spectrophotometer) until 144h.
2.5.4. D
RYW
EIGHTSA calibration curve between Optical Density (OD) at 640nm and dry weights (DW) was used to correlate OD measured during growth assays with total biomass. For different dilutions, 15mL of yeast resuspension was filtrated under vacuumusing pre-weighted 0.22μm filters, dried overnight in a hot chamber at 80ºC and the weight was measured.
2.5.5. C
OLLECTINGC
ELLSAfter growing, oleaginous yeast cells were collected by centrifugation for 10 min at 9500 rpm (Sigma 3-16K Sartorius) and the supernatant was removed. PBS buffer solution (pH=7.4) was added to the pellet and samples were resuspended and centrifuged again, under the same conditions. Supernatant were removed and wet-cells mass was then weighted. After that, cells were lyophilized under vacuum at 770 mbar, during 48h (CHRIST ALPHA 1-4, Braun Biotec International) and weighted. Dry biomass was used for lipid analysis.
2.6. YEASTS
LIPID PRODUCTION
2.6.1. A
NALYSIS OF LIPID BYF
LUORIMETRYFluorescence spectrometry is based on the measurement of the intensity and wavelength distribution of the radiation emitted by a sample after being excited by radiation of a given wavelength. It is used to identify the presence and measure the amount of specific molecules in a medium.
Despite all its benefits, microbial lipid production is strongly dependent on environmental factors, such as the carbon source, C:N ratio, oxygen availability. Therefore, it is essential to monitor cell lipid content during the microbial lipid production process.50
To monitor cell lipid content, a lipid measurement has been previously proposed using the Nile Red fluorescent stain for quantification of microbial lipids. Its fluorescence is produced in highly hydrophobic environments and quenched in hydrophilic ones.50 The fluorescence of Nile red by
itself without lipids existed at around 600–605nm with a slight peak, but was negligible. Nile red is nearly insoluble in water and its fluorescence immediately quenches in aqueous solution.
47 The fluorescence intensity corresponding to the intracellular lipid amount was determined at the peak of the corrected spectrum. The value showed a linear relation with the lipid content of various oleaginous fungi and yeasts measured by the conventional method.52
Lipid detection by Nile red has been commonly measured with excitation at 480–490 and at 510– 560 nm. The former target is neutral lipids to fluoresce and the latter target is polar lipids.52
Fluorescence spectroscopy technique, also known as fluorometry, was used to analyze yeast lipid production. Nile red (NR), a fluorescent probe of intracellular lipid droplets, was used as a fluorophore to quantify yeast’s neutral and polar lipid content during yeast’s growth. A 1mL final volume sample, containing 50μL of Nile Red 0.025μg/mL was used to obtain spectral data. The sample was previously diluted in PBS buffer and the cellular concentration was adjusted to OD 0.8 - 1.0 in all the samples. Spectral acquisition was performed before adding NR (control), and 2 minutes after addition since it corresponds to NR maximum emission peak.
Fluorescence spectra were acquired on a fluorimeter, using the software FluorEssence (Horiba Scientific). The excitation wavelength was set to 488nm and the emission spectrum was acquired from 500nm to 750nm. The 2nm slit was used for the excitation wavelength and the selected range of wavelengths. Polar lipids quantification was obtained by fluorescence values measured at 637 nm, and neutral lipids quantification by fluorescence values measured at 583 nm.
The software Origin Viewer v92 (OriginLab) was used to export results list to Excel - software where data processing was done.
2.6.2. Q
UANTIFICATION OFL
IPID BYG
RAVIMETRYTo measure total lipid content, gravimetric analysis was used following reference 51, as
follows. Triplicate 100mg samples of freeze-dried cells (lyophilized) were transferred to 50mL vials, with 30mL Folch solvent (2:1 of CHCl3:MeOH, v/v), 0.5mm zirconia beads and 3.5mm glass beads. Cells were homogenized five times in a homogenizer (Vortex Mixer, Labnet) for 30s with 30s intervals on ice. After that, 6mL 0.9% NaCl was added for improved phase separation. Then, 15 mL of the chloroform-rich phase was evaporated gradually in a pre-weighted 25mL amber vial under a slow stream of nitrogen. Lipid weight after extraction was used to calculate the total lipid as a percent of cell dry weight.
2.6.3. C
AROTENOIDSC
HARACTERIZATION BYUV-V
ISS
PECTROPHOTOMETRY49
3 RESULTS AND DISCUSSION
3.1. GRAPE POMACE CHEMICAL CHARACTERIZATION
As mentioned earlier, the GP feedstock was frozen the same day it arrived, and dried. Two GP drying methods were compared: drying in an oven at 60 ºC for two days, and drying in a lyophilizer for two days.54 The two results obtained for the water content of GP after the drying
step were in good agreement: 70.5 wt.% for drying in a lyophilizer, and 70.1 wt.% for drying in the oven at 60 ºC.
After the drying step, GP was milled to ca. 2 mm particles. The water content of GP powder was found by gravimetry: a sample was heated in the oven at 105 ºC overnight, and the reduction in weight determined. The GP powder obtained upon lyophilization had a water content of approximately 6 wt.%, whereas GP dried at 60 ºC had a water content of approximately 5 wt.%. Thus, GP as supplied had a water content of approximately 75%.
It must be noted that drying is required for the purpose of quantification in the studies to be performed, but would be avoided if the process were applied at an industrial site, since water has to be added for the SBW pretreatment. When applied, the drying method must not affect the carbohydrate content of the biomass. This is certainly the case of lyophilization and oven-drying at 60 ºC. For practical reasons, the chosen drying method for the subsequent experiments was lyophilization.
GP powder was used in all subsequent studies, and henceforth referred to as GP.
The second step was the chemical characterization of GP, using several methods described earlier. The major components identified in GP were carbohydrates, proteins, lipids, ash (resulting from inorganic salts), and lignin (Table 3.1; two replicate measurements, except in the case of protein).
Table 3.1 GP composition.
Component Quantification (wt. %)
Lyophilized GP Oven dried GP
Lipids 11.2 ± 2.4 10.7 ± 2.6
Total carbohydrates
32.7 ± 5.1 Soluble 7.1 ± 0.8 Structural 25.5 ± 4.3 Hemicellulose 14.0 ± 2.8 Cellulose 11.5 ± 3.1
28.3 ± 1.1 Soluble 6.8 ± 0.4 Structural 21.5 ± 1.4 Hemicellulose 11.2 ± 1.6 Cellulose 10.3 ± 2.2
Protein 15.2 15.2
Ash 8.0 ± 0.1 6.0 ± 1.0