Mariana Campos de Matos
Licenciatura em Ciências da Engenharia Química e Bioquímica
EFFICIENT SUCCINIC ACID PRODUCTION FROM
GLYCEROL BY
ACTINOBACILLUS SUCCINOGENES
USING DIMETHYL SULFOXIDE AS ELECTRON
ACCEPTOR
Dissertação para obtenção do Grau de Mestre
em Engenharia Química e Bioquímica
Orientador:
Doutor Christophe François Aimé Roca
Co-orientador:
Prof. Doutora Maria Ascensão C.F. Miranda Reis
Júri:
Presidente: Prof. Doutora Isabel Maria Rola Coelhoso Arguente: Doutora Maria Filomena Andrade de Freitas
Mariana Campos de Matos
EFFICIENT SUCCINIC ACID PRODUCTION FROM
GLYCEROL BY
ACTINOBACILLUS SUCCINOGENES
USING DIMETHYL SULFOXIDE AS ELECTRON
ACCEPTOR
Dissertação para obtenção do Grau de Mestre
em Engenharia Química e Bioquímica
Copyright Mariana Campos de Matos, FCT-UNL, UNL
A elaboração deste projecto não seria possível sem o auxílio de
várias pessoas. Por isso, queria agradecer a todos aqueles que,
de uma forma ou de outra, acompanharam, contribuíram e
ajudaram à sua concretização. Desta forma, em primeiro lugar,
gostaria de agradecer ao Doutor Christophe Roca, à Professora
Doutora Maria Ascensão Reis e à Margarida Carvalho pela
forma como me receberam, pelo apoio que me deram ao longo
destes meses e pelos ensinamentos que sempre estiveram
dispostos a partilhar. Quero também agradecer aos colegas do
grupo de Engenharia Bioquímica e de Processos pela ajuda que
deram no laboratório, pelo companheirismo e pelos momentos
de descontracção. Por último, um muito obrigado à família e aos
amigos e amigas que estiveram sempre lá nos momentos mais
difíceis, sempre com uma palavra de coragem e incentivo.
Um muito obrigado a TODOS pela ajuda, pela paciência, pela
compreensão e pela força que deram em todos os momentos
III
ABSTRACT
Glycerol (GLR), the main byproduct of the biodiesel industry, has become today a key feedstock for the bioproduction of various high value-added products. In particular, it can be used as cheap raw material for biological conversion into succinic acid (SA), a process that could compete with the presently used petrochemical conversion and open new perspectives for the commercialization of succinic acid, currently limited by its high production costs. Actinobacillus succinogenes is one of the most efficient SA producers. However, glycerol consumption by this biocatalyst is limited due to a redox imbalance during cell growth.The aim of this work was to develop and further improve a process of SA bioproduction by A. succinogenes using glycerol as sole carbon source and dimethyl sulfoxide (DMSO) as electron acceptor.
Results confirmed that DMSO increased glycerol utilization by the bacteria. Additionally, we could observe that DMSO concentration clearly affects growth and succinic acid production: DMSO concentrations between 0.5 and 1% were optimal for A. succinogenes growth and SA production.
During batch cultivation, in controlled bioreactors and using MgCO3 (20 g.L-1) and
NaOH (200 g.L-1) as neutralizing agents, SA reached 34.1 g.L-1. Volumetric productivity and
product yield were 1.0 g-SA.L-1.h-1 and 0.92 g-SA.g-GLR-1, respectively, the highest results reached so far in glycerol fermentations by A. succinogenes. We also reported that sodium ions could cause cell agglomeration in concentrations above 7 g.L-1,flocculation could reduce cell viability limiting mass transfer through the agglomerates, and consequently compromise SA production. Overall, during batch cultivation submitted to pulse of glycerol and DMSO, high SA concentration could be reached above 36.3 g-SA.L-1 but, this concentration seems to be also
inhibitory for cell growth and higher concentration could not be obtained during this project probably for that reason. Finally, we could observe that a minimum DMSO concentration is actually required to initiate growth and to produce SA efficiently from glycerol.
IV
V
RESUMO
O glicerol (GLR), o principal subproduto da indústria do biodiesel, tem vindo a tornar-se uma matéria-prima fundamental na bioprodução de vários produtos de valor acrescentado. Em particular, este pode ser usado como matéria-prima barata para conversão biológica em ácido succínico (SA). Este bioprocesso pode competir o actual processo de produção, de origem petroquímica, abrindo novas perspectivas à comercialização deste produto, actualmente limitada pelos elevados custos de produção. A bactéria Actinobacillus succinogenes está relatada como uma das mais eficientes quanto à produção deste ácido. No entanto, o consumo de glicerol por este biocatalizador está condicionado devido a um desequilíbrio redox aquando da formação de biomassa. O objectivo deste trabalho foi, portanto, desenvolver, e posteriormente melhorar, um processo de produção de SA cujo princípio se baseia na conversão biológica de glicerol pela bactéria A. succinogenes, usando dimetilsulfoxido (DMSO) como aceitador de electrões.
Os resultados confirmaram que a adição de DMSO fez aumentar notavelmente a quantidade de glicerol que a bactéria consegue metabolizar. Adicionalmente, observou-se que a concentração de DMSO afecta claramente o crescimento e a produção de ácido succínico: concentrações na gama dos 0.5% e 1% (v/v) são óptimas para o crescimento celular e produção de SA.
Durante cultivo em batch, em bioreactor controlado e usando MgCO3 (20 g.L-1) e NaOH
(200 g.L-1) como agentes de neutralização, atingiu-se uma concentração de SA de 34.1 g.L-1. A produtividade volumétrica e rendimento em produto foram de 1.0 g-SA.L-1.h-1 e 0.92
g-SA.g-GLR-1, respectivamente, valores reportados como sendo os mais elevados para fermentações de glicerol por A. succinogenes. No decorrer dos ensaios também foi observado que o ião sódio, em concentrações superiores a 7 g.L-1, pode causar aglomerados celulares. Problemas de floculação celular em bioreactor podem reduzir a viabilidade celular, limitando a transferência de massa nos aglomerados, comprometendo assim a produção de SA. Outro factor que também se pensa ser inibitório para o crescimento celular e produção de SA é a concentração deste último no líquido de fermentação. Após cultivo em batch com pulsos de glicerol e DMSO, determinou-se que concentrações de SA superiores a 36.3 g.L-1 parecem ser
VI mais elevadas no decorrer do projecto. Finalmente, foi possível concluir que para que as células iniciem o crescimento e produzam SA eficientemente a partir de glicerol é necessário uma concentração mínima de DMSO.
Adicionalmente, observou-se que o glicerol bruto é uma boa fonte de carbono para produção de SA. Em reactor batch obteve-se uma concentração de 18.3 g-SA.L-1 e um rendimento em produto de 0.93 g-SA.g-GLR. No entanto, a produtividade volumétrica obtida foi bastante reduzida (0.28 g-SA.L-1.h-1).
VII
INDEX
1. INTRODUCTION ... 1
1.1. Succinic Acid ... 1
a. Applications, production and market ... 1
b. Bioproduction of SA by microbial fermentation ... 3
1.2. A. succinogenes as natural succinogen ... 4
1.3. Glycerol as carbon source for SA production ... 6
1.4. Overview of glycerol metabolism in bacteria ... 8
a. Common fermentative metabolism ... 8
b. Respiratory metabolism in A. succinogenes ... 10
1.5. Bacterial Growth Kinetics ... 12
2. MOTIVATION ... 15
3. MATERIALS AND METHODS ... 17
3.1. Cultivation conditions... 17
3.2. Bioreactor operation ... 17
3.3. Analytical Techniques... 18
a. Cell Growth and Cell Dry Weight (CDW) ... 18
b. Substrate, organic acids and DMSO concentration ... 19
3.4. Calculations ... 19
4. RESULTS AND DISCUSSION ... 21
4.1. Effect of initial DMSO concentration on bacterial growth, GLR consumption and SA production ... 21
4.2. Efficient glycerol consumption in controlled batch cultivations with DMSO .... 23
a. Pure glycerol ... 23
VIII
4.3. Optimization of SA production by A. succinogenes ... 28
a. Batch cultivation with successive glycerol and DMSO pulses ... 28
b. Batch cultivation using successive low concentration DMSO pulses ... 34
4.4. Effect of neutralizing agent on bacterial growth and SA production ... 38
a. Batch cultivation using NaOH as neutralizing agent ... 38
b. Batch cultivation with a mixture of NaOH and Mg(OH)2 as neutralizing agent 42 c. Batch cultivation using MgCO3 and NaOH as neutralizing agent combination strategy 44 5. CONCLUSIONS AND FUTURE WORK ... 49
IX
FIGURES CAPTION
Figure 1.1 – Overview of applications, products and chemicals derived from SA (Beauprez, et al., 2010). ... 2
Figure 1.2 –A. succinogenes grown on glucose medium (6 g.L-1). Magnification: 1000x. ... 4 Figure 1.3 – Simplified metabolic map of glucose metabolism in A. succinogenes. (Adapted from McKinlay, 2010). Metabolites: AcCoA, CoA; Ace, acetate; AcP, acetyl-phosphate; Ald, acetaldehyde; Cit, citrate; EtOH, ethanol; For, formate; Fum, fumarate; Glc, glucose; G6P, glucose-6-phosphate; Icit, isocitrate; αKG, α-ketoglutarate; Mal, malate; OAA, oxaloacetate; PEP, phosphoenolpyruvate; Pyr, pyruvate; Q+, menaquinone; Suc, succinate; SucCoA, succinyl-CoA. ... 5
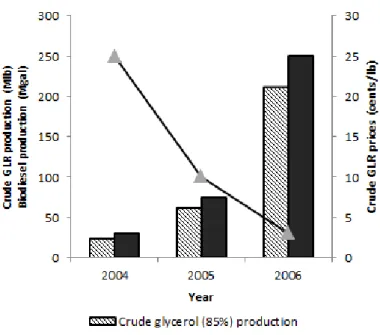
Figure 1.4 – Biodiesel transesterification reaction. ... 6 Figure 1.5 – U.S. biodiesel production and its impact on crude glycerol prices. Crude glycerol produced by the biodiesel industry was estimated assuming the generation of 0.853 lb of glycerol per gallon of biodiesel. (Adapted from Yazdani, 2007). ... 7
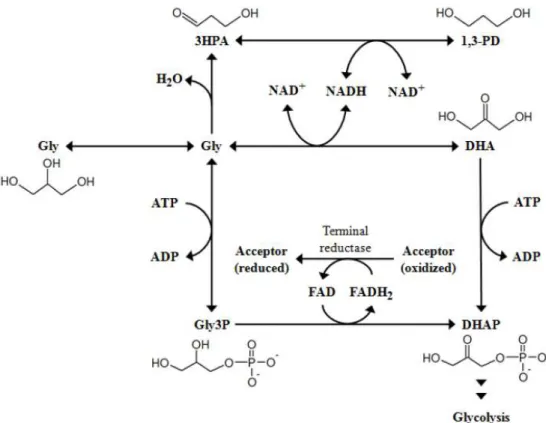
Figure 1.6 – Metabolic pathways of glycerol-fermenting bacteria. Metabolites: 1,3-PD, 1,3-propanediol; 3HPA, 3-hydroxypropionaldehyde; DHA, dihydroxyacetone; DHAP, dihydroxyacetone phosphate; Gly, glycerol; Gly3P, glycerol 3-phosphate. (Adapted from Schindler, 2011). ... 9
Figure 1.7 – Typical bacterial growth profile (Lennox, 2001). ... 12 Figure 4.1 – Effect of DMSO on A. succinogenes 130Z growth after 24 h using glycerol (6 g.L-1) as carbon source. DMSO concentrations of 0 (A), 0.5 (B), 1 (B) and 2% (v/v) (D). ... 22
Figure 4.2 – Batch fermentation profile of A. succinogenes using pure glycerol as carbon source and DMSO as electron acceptor. A – Succinate, glycerol and DCW (g) and DMSO (%) profile; B – Formate and acetate (g) profile. ... 23
X Figure 4.4 – Batch cultivation with successive glycerol and DMSO pulses for improved SA production. A – Succinate, glycerol (g) and DMSO (%) profile; B – OD and DCW (g); C – Formate and acetate (g) production. ... 29 Figure 4.5 –A. succinogenes during batch cultivation using successive GLR and DMSO pulses. A – 7.5 h; B – 28.5 h; C – 50 h; D – 72.5 h. ... 31
Figure 4.6 – Results of batch cultivation using successive low DMSO concentration pulse. The dotted lines represent the time of DMSO pulses. A – Succinate, glycerol (g) and DMSO (%) profile; B – OD and formate, acetate and ethanol (g) production. ... 35
Figure 4.7 – A. succinogenes during batch cultivation using successive low concentration DMSO pulses. A – 2 h; B – 6 h; C – 26 h; D – 47 h. ... 36
Figure 4.8 – Results of batch cultivation of A. succinogenes on glycerol using NaOH as neutralizing agent. A – Succinate, glycerol (g), DMSO (%) and OD profile; B – Formate and acetate (g) production. ... 39
Figure 4.9 – Increasing concentration of sodium ion by supplying NaOH as neutralizing agent (sodium concentration was calculated excluding the initial sodium concentration in the medium). ... 41
Figure 4.10 – Results of batch cultivation of A. succinogenes on glycerol using a mixture of NaOH and Mg(OH)2 as neutralizing agent. A – Succinate, glycerol (g), DMSO (%) and OD
profile; B – Formate and acetate (g) production. ... 43 Figure 4.11 – Results of batch cultivation of A. succinogenes on glycerol using using MgCO3 and NaOH as neutralizing agent. A – Succinate, glycerol (g), DMSO (%) and OD profile;
XI
TABLES CAPTION
Table 1.1 – Glucose fermentation of facultative anaerobic SA producing bacteria. ... 4 Table 1.2 – Comparison of different SA producing bacteria from glycerol. ... 10 Table 4.1 – Results of batch fermentation of A. succinogenes using pure glycerol as carbon source and DMSO as electron acceptor. ... 25
Table 4.2 – Results of batch fermentation of A. succinogenes using crude glycerol as carbon source and DMSO as electron acceptor. ... 28
Table 4.3 – Batch cultivation with glycerol and DMSO pulses for improved SA production. ... 31
XIII
ABREVIATIONS
AA –Acetic acid
AcCoA– Acetyl-CoA
CDW– Cell dry weight
DMS– Dimethylsulphide
DMSO– Dimethylsulfoxide
EPS– Exopolysaccharides
FA– Formic acid
GLR– Glycerol
GRP– Glycerol-rich product
OAA– Oxaloacetate
OD– Optical density
PD– Propanediol
PEP– Phosphoenolpyruvate
PHA– Polyhydroxyalkanoates
Pyr– Pyruvate
SA– Succinic acid
XV
NOMENCLATURE
P – product (SA) concentration (g.L-1)
qp– product (SA) specific productivity (g-SA.g-biomass-1.h-1)
rp – product(SA) volumetric productivity (g-SA.L-1.h-1)
S – substrate (GLR) concentration (g.L-1) X – cell concentration (g.L-1)
X0– cell concentration at t=0 (g.L-1)
YP/S– yield of product on substrate (g.g-1)
YX/S– yield of biomass on substrate (g.g-1)
1
1. INTRODUCTION
During the past century, the increased concerns for environmental issues and the depletion of mineral oil reserves led to the search for alternative energy sources and for alternative biochemical processes. There are several chemicals that can actually be biochemically produced, and that can be economically viable. Succinic acid is one of these chemical building blocks, listed by the U.S. Department of Energy as a potential platform chemical for the production of various high value-added derivatives from renewable resources. (Beauprez, et al., 2010; Werpy, et al., 2004)
1.1. Succinic Acid
a. Applications, production and market
Succinic acid (1,4-butanedioic acid, SA) is a C-4 linear saturated dicarboxylic acid having the molecular formula C4H6O4. Chemical properties of this compound make it very
versatile and attractive as potential building block for the production of numerous chemical intermediates and high value end-products (Figure 1.1). There are four major existing markets for succinic acid (Figure 1.1): (Song, et al., 2006; Luque, et al., 2009; Zeikus, et al., 1999)
the first and largest is the surfactant and detergent market.
a second market as an ion chelator, used to prevent corrosion of metals.
a third market in food industry as acidulant, flavoring agent, and as anti-microbial agent.
2
Figure 1.1 – Overview of applications, products and chemicals derived from SA (Beauprez, et al., 2010).
Until recently, the commercial scale production of SA was mostly petroleum-derived, from butane through catalytic hydrogenation of maleic anhydride (Zeikus, et al., 1999). Its high manufacturing cost is affected by several factors, including raw materials, SA productivity and yield, and recovery method. In 2006, SA was commonly sold at the price of 4.5 to 6.8 €.Kg−1
3
b. Bioproduction of SA by microbial fermentation
Over the last decade, chemical companies such as BASF, BioAmber or DSM have made intensive studies in order to develop and optimize the production and the scale-up of the microbial SA production from cellulosic biomass, glucose or starch derivates fermentation, respectively. SA is usually an intermediate of the tricarboxylic acid (TCA) cycle, the respiratory process involved in the breakdown of carbohydrates, but in some bacteria such as Anaerobiospirillum succiniciproducens, Basfia succiniciproducens, Manheimia succiniciproducens and Actinobacillus succinogenes, SA is one of the fermentation end-products of anaerobic metabolism. Therefore, microbial fermentation of glucose and other carbon sources appeared as a promising technology for the production of bio-based SA with high yields and productivities. In addition, the limited nature of fossil reserves, its high price, and ever increasing environmental concerns are encouraging the industries to replace the petroleum-based chemical processes with bio-based processes. Moreover, utilization of cheap and renewable raw material, such as glycerol, cane molasses or wheat, could contribute to turn this SA bioproduction much more cost-competitive. Therefore, it is obvious that SA production by bacteria fermentation has potential to compete with the presently used petrochemical process. (Luque, et al., 2009; Song, et al., 2006).
4
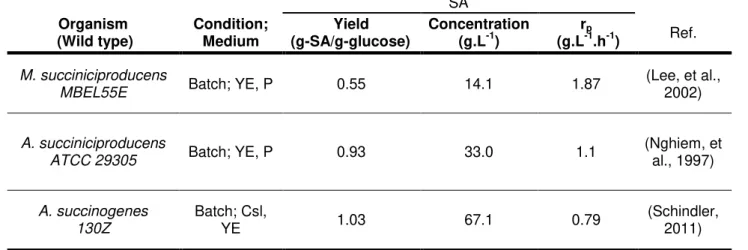
Table 1.1 – Glucose fermentation of facultative anaerobic SA producing bacteria.
SA
Organism
(Wild type) Condition; Medium (g-SA/g-glucose) Yield Concentration (g.L-1) (g.Lr-1p.h-1) Ref. M. succiniciproducens
MBEL55E Batch; YE, P 0.55 14.1 1.87
(Lee, et al., 2002)
A. succiniciproducens
ATCC 29305 Batch; YE, P 0.93 33.0 1.1
(Nghiem, et al., 1997)
A. succinogenes 130Z
Batch; Csl,
YE 1.03 67.1 0.79 (Schindler, 2011)
YE, yeast extract; P, polypeptone; Csl, corn steep liquor; rp, volumetric productivity.
1.2. A. succinogenes as natural succinogen
Among those natural SA producers (Table 1.1), A. succinogenes is the one producing the highest levels of SA, with a high product yield (Table 1.1), during batch cultivation using glucose as carbon source. It is more resistant to SA than any other succinic acid producers (Bechthold et al., 2008) and is recognized as one of the most promising microorganisms for industrial SA production (McKinlay, et al., 2007). A. succinogenes (Figure 1.2) was initially isolated from bovine ruminal contents. It is a Gram-negative, capnophilic, osmotolerant and pleomorphic bacterium, which naturally produces high concentrations of SA in addition to formate, acetate, and ethanol as fermentation sub-products. (Guettler, et al., 1999; McKinlay, et al., 2010)
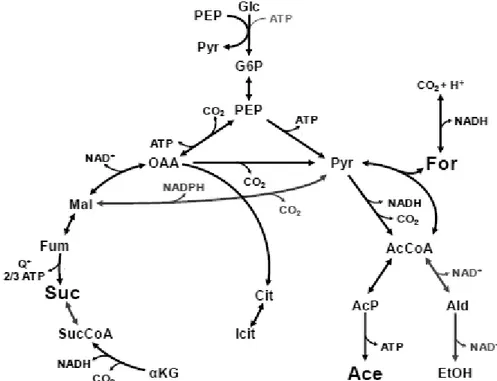
5 A. succinogenes fermentative metabolism can be divided into two pathways, with PEP as a branch point (Figure 1.3): the C3 pathway leading to formate (For), acetate (Ace) and ethanol (EtOH) and the C4 pathway leading to succinate (Suc). In the C3 pathway, PEP is converted to pyruvate (Pyr), which is further converted into acetyl-CoA (AcCoA) and formate. Formate is excreted or oxidized by formate dehydrogenase to CO2 and H2. AcCoA is converted
to either acetate or ethanol to satisfy ATP or redox demands, respectively (Figure 1.3). In the C4 pathway, PEP is carboxylated to oxaloacetate (OAA). OAA is subsequently reduced to malate by malate dehydrogenase, malate is dehydrogenated to fumarate by fumarase, and fumarate is finally reduced to succinate by fumarase reductase (Figure 1.3). (McKinlay, et al., 2005; Schindler, 2011; McKinlay, et al., 2010)
Figure 1.3 – Simplified metabolic map of glucose metabolism in A. succinogenes. (Adapted from McKinlay, 2010). Metabolites: AcCoA, acetyl-CoA; Ace, acetate; AcP, acetyl-phosphate; Ald, acetaldehyde; Cit, citrate; EtOH, ethanol; For, formate; Fum, fumarate; Glc, glucose; G6P,
glucose-6-phosphate; Icit, isocitrate; αKG, α-ketoglutarate; Mal, malate; OAA, oxaloacetate; PEP,
phosphoenolpyruvate; Pyr, pyruvate; Q+, menaquinone; Suc, succinate; SucCoA, succinyl-CoA.
The C4 pathway, leading to SA production, is favored under conditions of high CO2
availability or reducing power, which can be provided by H2 as an electron donor, by
6 substrate appears to be the simplest choice to maximize the SA production. In the past few years, several studies have been made to find a substrate that is more reduced, and at the same time, less expensive than glucose. (Li, et al., 2011)
1.3. Glycerol as carbon source for SA production
Utilization of biomass, cheaper raw materials and CO2 has appeared as a solution to
reduce production costs and obtain a sustainable production of chemicals. Most renewable feedstocks used today for the bioproduction are rich in sugars, such as agricultural and lignocellulosic materials (e.g. straw, corn fiber, whey, wheat and cane molasses) (Li, et al., 2011). However, other carbon sources are emerging today. Recently, glycerol (GLR) appeared as a cheap feedstock as it is a highly abundant industrial byproduct.
Glycerol is generated in large amounts during the production of both bioethanol (Kampen, 1993) and biodiesel (Johnson, et al., 2007), particularly in the last one. Production of biodiesel is a relatively simple process that uses readily accessible chemical reactants, occurs at moderate temperature and pressures, and can utilize a variety of oil feedstocks (Johnson, et al., 2007). Because of these advantages, biodiesel is one of the best choices of alternative fuels to effectively reduce the dependence on petroleum, especially in short term.
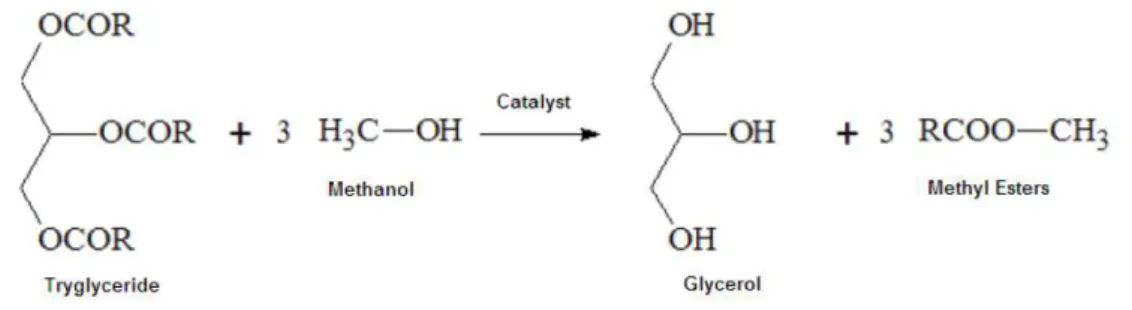
Biodiesel is produced through a catalyzed transesterification, between oils or fats and an alcohol, usually methanol (Figure 1.4). Strong bases, such as sodium hydroxide or potassium hydroxide, are commonly used as catalysts (Pyle, 2008).
Figure 1.4 – Biodiesel transesterification reaction.
7 (Johnson, et al., 2007). Besides, the glycerol generated by the biodiesel industry contains residual contaminants such as methanol, soaps, un-reacted fats and oils, and low amounts of few elements such as calcium, magnesium, phosphorous, or sulfur (Thompson, et al., 2006). Consequently, glycerol represents a major concern for the biodiesel industry.
Larger scale biodiesel producers treat and refine their crude glycerol through filtration, chemical additions or fractional vacuum distillation. The purified glycerol could be used in the manufacture of various food and beverages, pharmaceuticals, cosmetics, and other personal care products (Johnson, et al., 2007). However, according to the current trends, biodiesel market will continue to increase intensively in the following years, between 2005 and 2006 biodiesel production increased about 230% (Figure 1.5), which will result in a large glycerol surplus that current glycerol market cannot absorb. In addition, small to moderate scale producers cannot perform the glycerol-rich product (GRP) purification treatments, because of their high costs. Research is therefore being done to convert GRP into new value-added products (Thompson, et al., 2006).
8 The price of crude glycerol ranged between €17 and €70 per Ton, in 2011 (depending upon quality and methanol content1. Its abundance and low price could make it an excellent feedstock for the production of reduced fuels and animal feeding. However, there are still problems related to impurities, decreasing the GRP market value even further (Johnson, et al., 2007; Pyle, 2008). GLR can be thermochemical converted into acetol and propylene glycol (Suppes, 2005) or a variety of other products (Johnson, et al., 2007). Moreover, glycerol is a potential carbon source for production of Omega-3 polyunsaturated Fatty Acids (Pyle, 2008). It is also possible to convert GRP in biopolymers, such as polyhydroxyalkanoates (PHA) (Ashby, et al., 2005) and exopolysaccharides (EPS) (Alves, et al., 2009).
Recently, several studies indicate GRP as an efficient carbon source in fermentation processes aiming to produce high yields of several high-value products. For example, the fermentation of glycerol by a couple of bacteria to produce SA (Lee, et al., 2010; Vlysidis, et al., 2009) or by E. coli to produce a mixture of products such as ethanol, SA, acetate, lactate and hydrogen (Dharmadi, et al., 2006).
1.4. Overview of glycerol metabolism in bacteria
a. Common fermentative metabolism
The conversion of glycerol into the glycolytic intermediates phosphoenolpyruvate (PEP) or pyruvate generates twice the amount of reducing equivalents produced by the metabolism of glucose or xylose, which is an evident advantage when the main goal is to produce a reduced compound, such as SA (Yazdani, et al., 2007).
Many bacteria can indeed use GLR as carbon source to grow by aerobic or anaerobic respiration. However, the ability to ferment glycerol is not a ubiquitous trait of bacteria, since this metabolic process requires the recycling of one extra reducing equivalent (i.e. NADH) compared to pentose and hexose sugars. Conversion of GLR is occurring via two parallel pathways (Figure 1.6), one oxidizing glycerol to DHAP (which is further metabolized through glycolysis), and another reducing glycerol to 1,3-PD (which is excreted). (Schindler, 2011). There are few microorganisms with ability to synthesize the highly reduced product 1,3-propanediol (1,3-PD)
1
9 (Figure 1.6) and consequently metabolize glycerol fermentatively in the absence of an external electron acceptor. This metabolic pathway could be observed in bacteria members of the genera Citrobacter, Klebsiella, Clostridium, Enterobacter, Lactobacillus and Bacillus.
10
b. Respiratory metabolism in A. succinogenes
Bacteria that do not produce 1,3-PD, such as A. succiniciproducens, M. succiniciproducens, B. succiniciproducens and A. succinogenes, seem to require either an external electron acceptor, or a spontaneous mutation occurring by gradual adaptation to glycerol, to produce significant amounts of SA (Schindler, 2011; Vlysidis, et al., 2011).
Table 1.2 compares performances from different microorganisms using GLR for SA production.
Table 1.2 – Comparison of different SA producing bacteria from glycerol.
SA
Organism Condition; Medium (g-SA/g-GLR) Yield Concentration (g.L-1) (g.Lr-1p.h-1) Ref.
B. succiniciproducens
DD1 Batch; YE, P 1.20
b 8.4 0.90 (Scholten, et
al., 2008)
A. succiniciproducens
ATCC 29305 Batch; YE, P 1.30b 4.9 0.155 (Lee, et al., 2001)
A. succinogenes
NCIMB 41825a Batch; YE 0.8 29.3 0.270
(Vlysidis, et al., 2011)
YE, yeast extract; P, polypeptone; rp–volumetric productivity; a – adapted strain; b – crude glycerol
B. succiniciproducens appears as an excellent SA producer, without the need of bio-training (adaptation), providing much higher yields and volumetric productivities (Table 1.2). However, the SA concentration obtained is quite low, compared to that of A. succinogenes (in this case the productivity was lower). This limitation could be a problem when the main objective is the process implementation at industrial level. A. succinogenes bio-training to glycerol for SA production (i.e. without an external electron acceptor) has already been demonstrated by Vlysidis and colleagues (Vlysidis, et al., 2011). However, productivity and final titer in SA (0.27 g.L-1.h-1 and 29.3 g.L-1, respectively) remained quite low (Table 1.2), compared to the ones obtained with glucose (0.79 g-SA.L-1.h-1 and 67.1 g-SA.L-1). Additionally, the product yield
obtained (0.8 g-SA.g-GLR-1) was far below the theoretical one (1.28 g-SA.g-GLR-1, as 1 mol of glycerol reacts with 1 mol of CO2 and produces 1 mol of SA and 1 mol of water) (Vlysidis, et al.,
11 Schindler demonstrated that addition of an external electron acceptor, such as dimethyl sulfoxide (DMSO) dramatically increases SA production from glycerol in A. succinogenes (without the needing of bio-training). The function of the electron acceptor is to balance the redox imbalance occurring during fermentation, impairing glycerol conversion into SA. However, in this study, rather low glycerol concentration (6.2 g.L-1) and low DMSO concentration (0.14% (v/v)) were used in serum flasks under uncontrolled conditions, resulting in 5.2 g-SA.L-1 with a low volumetric productivity of 0.12 g-SA.L-1.h-1. (Schindler, 2011).
DMSO ((CH3)2SO) is a colorless, odorless and strongly hygroscopic compound. The
global DMSO market represents today a volume of more than 60 KTon/Year, the largest applications being in life sciences, electronics and carbon fibers manufacturing2. In the industry, DMSO is used as solvent in a wide range of reactions, because of its high polarity and good solvation of cations. DMSO dissolves a large number of substances such as organic compounds and polymers. This sulphur compound also displays many pharmacological properties, which makes it much used as analgesic, bacteriostatic and anti-inflammatory. Furthermore, DMSO has been described as a preservative and cryo-protective agent for organ and tissue transplants. (Roy, 2011)
Many microorganisms, such as E.coli or Wolinella succinogenes, can use DMSO as an external electron acceptor for anaerobic electron transport with dimethyl sulphide (DMS) as volatile end-product (Equation 1.1) (Lorenzen, et al., 1994).
( ) ( )
Equation 1.1
One advantage of using DMSO in the bioprocess of SA production is the fact that it is biodegradable, not compromising the eco-friendly character of the process. However, the industrial price of this compound is still too high (according to Gaylord Chemical Company the price would be between €2,75 and€3,5 per Kg) to validate the economic viability of the process.
However, cheaper sources of DMSO could be envisaged for the process, such as Kraft process byproducts.
2
12
1.5. Bacterial Growth Kinetics
Bacterial growth comprises mainly four stages that correspond to different periods of the microorganism life cycle (Figure 1.7).
Figure 1.7 – Typical bacterial growth profile (Lennox, 2001).
The lag phase corresponds to bacterial adaptation to the cultivation conditions, and is intended to occur in the shortest time possible. During this phase, there is no increase in the cell number, but new enzymes are synthesized to provide the cell with the necessary machinery for adaptation to the new conditions. Several factors could reduce this phase:
The inoculum volume should be 5%-10% of the bioreactor liquid volume.
The cells when transferred to the bioreactor should be in exponential phase.
The medium composition of the inoculum that should be as similar as possible to the bioreactor medium.
13 As far as product synthesis is concerned, product formation can be:
Growth associated, resulting directly from the energetic metabolism, which means that the product formation rate is associated to the growth rate.
Partially-growth associated, resulting indirectly from the energetic metabolism, the product formation rate is partially associated to the growth rate.
15
2. MOTIVATION
Biological conversion of renewable and sustainable feedstocks (i.e. conversion of an alternative carbon source into a value-added product by microorganisms) is a potential and promising way to reduce the dependency towards petroleum-derivatives products. Since 2004, SA tops the U.S. Department of Energy’s list of value-added chemicals that can be produced from biomass (Werpy, et al., 2004), with the potential to become a valuable intermediate for the bulk chemicals industry, if its production is more cost effective, than the SA currently produced from maleic anhydride, a petrochemical derivative. In addition to the large market potential for SA and its immediate derivatives, bio-based SA production presents the added environmental benefit of using CO2 as a substrate, reducing the atmospheric concentrations of this
greenhouse gas.
In the past years, the production of SA by microbial fermentation was therefore limited because of the high production costs, making the process not economically profitable and neither cost competitive. One way to reduce those costs is the use of low-cost substrates (instead of glucose), such lignocellulosic derivatives or other agro-industrial wastes. Glycerol rich-product, a byproduct of biodiesel production, has appeared as potential feedstock. SA production from glycerol has already been demonstrated in various microorganisms, but with limited success. Actinobacillus succinogenes is among the best producer of SA. However, it uses inefficiently glycerol and previous work has shown that the addition of other carbon sources was necessary to have glycerol consumption. Recently, Vlysidis and colleagues (Vlysidis, et al., 2011) demonstrated a conversion of glycerol into SA, but using an A. succinogenes strain adapted to glycerol after various transfers. However, the volumetric productivity remained limited to 0.27 g-SA.L-1.h-1, much lower than what can be obtained with
17
3. MATERIALS AND METHODS
3.1. Cultivation conditions
The microorganism used in this study was the bacterium Actinobacillus succinogenes type strain 130Z (ATCC 55167) which was obtained from ARS (Agricultural Research Service -United States Department of Agriculture). The culture was preserved at -80 °C in glycerol (25% v/v) as a cryoprotectant agent. Reactivation from stock culture and inoculum were prepared by incubating cells in rubber sealed serum flasks, containing 50 mL of culture medium with the following composition per liter: glucose, 6.0 g; yeast extract, 5.0 g; NaHCO3, 8.4 g;
NaH2PO4·H2O, 8.5 g; K2HPO4, 15.5 g; (NH4)2SO4, 1.0 g; MgCl2·6H2O, 0.2 g; CaCl2, 0.2 g
(Guettler, et al., 1999). Medium was heat sterilized at 120 °C, for 20 minutes, glucose and chlorides were sterilized separately and added aseptically. After inoculation, the rubber sealed flasks were incubated at 37 ºC in a rotary shaker at 220 rpm, during 24 hours.
Culture medium used for every cultivation in serum flasks and bioreactors was the same as the medium used for A. succinogenes reactivation, with the exception of carbon source glucose, (6 g.L-1) that was replaced by pure or crude glycerol (in the range 6-47.1 g.L-1). In all cases, DMSO (0.50-1.05% (v/v)) was added directly to the cultivation medium.
The GRP used was supplied by SGC Energia, S.G.P.S., S.A., Portugal. This byproduct had a glycerol concentration of 89% w/v. Minor components included methanol (0.04%), organic material (0.4%), ashes (6.8%) and water (3.5%).
3.2. Bioreactor operation
Batch cultivations were carried out in a 1 or 2 L bioreactors (BioStat B, Sartorius, Germany), sparged with CO2 at 0.05 vvm, at 37 ºC and with stirring of 220-240 rpm. The pH
was set to 6.8 and controlled automatically by the addition of 200 g.L-1 NaOH solution. Inoculi
18 various pulses containing, or glycerol and DMSO with defined concentrations, or complete culture medium (with 5 g.L-1 of yeast extract instead of 10 g.L-1) or only DMSO (≈0.2% (v/v)).
During this study, different alkali solutions were also tested to study the effect of neutralizing agent on bacterial growth and SA production. In replacement of NaOH 200 g.L-1 solution, 40 g.L-1 MgCO
3 (replace NaHCO3) and 200 g.L-1 NaOH, 20 g.L-1 MgCO3 (replace
NaHCO3) and 200 g.L-1 NaOH, NaOH : Ca(OH)2 1:1 (100 g/L NaOH : 100 g/L Ca(OH)2, i.e. 2.5
M : 1.3 M) and NaOH : Mg(OH)2 1:1 (100 g/L NaOH : 100 g/L Mg(OH)2 i.e. 2.5 M : 1.7 M) were
tested.
3.3. Analytical Techniques
Throughout the cultivation, culture broth samples (10-15 mL) were taken from the bioreactor at given intervals. A 10 mL sample was centrifuged 10 minutes at 10.000 rpm. The cell-free supernatant was stored at -20ºC for further determination of glycerol, organic acids and DMSO by HPLC, while the pellet was used for determination of cell dry weight (CDW).
a. Cell Growth and Cell Dry Weight (CDW)
Cell growth was determined by measuring the absorbance of the culture broth samples at 660 nm (Spectrophometer Helios Alpha, Thermo Spectronic UK). Pellets obtained by the centrifugation of broth samples were washed twice with distilled water and centrifuged for 10 minutes at 10.000 rpm, and dried for 24 h at 70 ºC. In the cases where CDW was not determined experimentally, it was assumed that A. succinogenes grown in culture medium (with glycerol instead glucose) with an OD660 value of 1 (Abs) had a concentration of 0.711 g-CDW.L-1
(calibration curve not shown).
b. Cell morphology
19
c. Substrate, organic acids and DMSO concentration
Glycerol and organic acids (succinic, ethanol, formic and acetic acids) concentration in the cell-free supernatant was analyzed by High Performance Liquid Chromatography (HPLC) using an ion exchange column (Aminex HPX-87H; 300mm x 7.8mm, 9 µm; Biorad) and a refractive index detector (RI-71, Merck). The mobile phase was 0.01 N H2SO4 solution, running
at a flow rate of 0.5 mL.min-1. The column was operated at 30 ºC. DMSO was analyzed by
HPLC using the same separation conditions, but using UV detection at 210 nm.
3.4. Calculations
The specific growth rate (μ, h-1) was determined using the following equation:
Equation 3.1
where Xis the cell concentration (g.L-1) measured over time, t (h).
The specific growth rate can be obtained by linearization of Equation 3.1:
( )
Equation 3.2
where X0(g.L-1) is the cell concentration at t=0.
The SA volumetric productivity (rp, g-SA.L-1.h-1) was determined as following:
Equation 3.3
where P corresponds to product (SA) concentration (g.L-1), at time t (h).
The SA specific productivity (rp, g-SA.g-biomassa-1.h-1) was determined as following:
Equation 3.4
20
Equation 3.5
where S is the substrate (GLR) concentration at time t (h).
The yield of biomass on substrate, YX/S (g.g-1) was calculated as:
21
4. RESULTS AND DISCUSSION
4.1. Effect of initial DMSO concentration on bacterial growth, GLR
consumption and SA production
DMSO was initially tested to evaluate its effect on bacterial growth, GLR consumption and SA production. In the different runs, the medium containing glycerol, rounding 6 g.L-1, was supplemented with DMSO at concentration of 0, 0.5, 1 and 2% (v/v). Each flask was inoculated with 1 mL of the reactivated culture and was placed at 220 rpm for 24 hours, at 37 ºC.
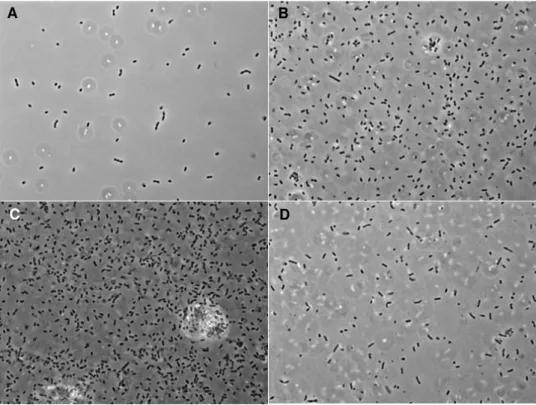
DMSO concentration clearly affects A. succinogenes growth when using glycerol as sole carbon source (Figure 4.1). In fact, after 24 hours of incubation, and in the presence of 0.5 or 1% of DMSO, A. succinogenes cells were abundant and occurred singly, in pairs and very frequently in short chains (Figure 4.1B and C). Glycerol was totally consumed in 28 hours in both cases and the production of SA reached 5.94 g.L-1, representing a yield of 0.73
g-SA.g-GLR-1.
In the control group of experiments, where no DMSO was added, cells were scarce (Figure 4.1A) and glycerol consumption/SA production was absent. This is in correlation with the fact that A. succinogenes is not able to use glycerol as carbon source in the absence of an external electron acceptor, as already demonstrated by Schindler (Schindler, 2011). In the presence of 2% DMSO, very few A. succinogenes cells were observed, even less than in the control group, suggesting an inhibitory growth effect of DMSO (Figure 4.1D).
22
Figure 4.1 – Effect of DMSO on A. succinogenes 130Z growth after 24 h using glycerol (6 g.L-1) as
carbon source. DMSO concentrations of 0 (A), 0.5 (B), 1 (B) and 2% (v/v) (D).
A B
23
4.2. Efficient glycerol consumption in controlled batch cultivations with DMSO
a. Pure glycerol
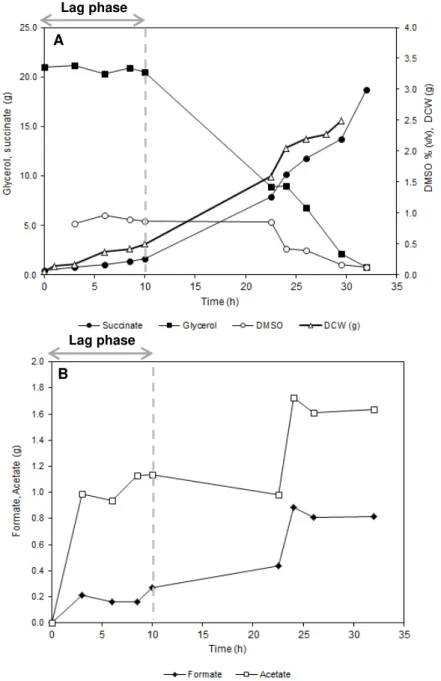
In order to investigate in more details the effect of DMSO on glycerol consumption and SA production and understand its influence on cell growth, batch cultivations were performed with A. succinogenes under anaerobic conditions in 1 L controlled bench-top reactor as described in section 3.2.
Figure 4.2 – Batch fermentation profile of A. succinogenes using pure glycerol as carbon source and DMSO as electron acceptor. A – Succinate, glycerol and DCW (g) and DMSO (%) profile; B –
Formate and acetate (g) profile.
A
B
Lag phase
24 Initial glycerol concentration was 21 g.L-1 and DMSO 1% (v/v). 0.8 % of DMSO was
used after approximately 32 hours and glycerol was almost totally consumed, with only 0.86 g.L
-1 left, resulting in 20 g.L-1 SA (Figure 4.2A, Table 4.1.). The specific growth rate was 0.16 h-1,
which is rather low compared to growth of this microorganism on glucose (0.31 h-1) (Corona-González, et al., 2008). Acetic acid, formic acid and ethanol production was below 1.02, 1.82 and 1.00 g.L-1, respectively (Figure 4.2B, Table 4.1.).
It should be noted that in water solution, DMSO tends to aggregate in the form of 1-DMSO:2-water complexes, whose structure competes with the preferred tetrahedral arrangement of water molecules (Nieto-Draghi, et al., 2003). This phenomenon could influence DMSO dissolution, and consequently, its determination in HPLC analysis, resulting in highly variable results. However, results seems to indicate that 1 % DMSO sustain the use of 28.7 g-GLR (Table 4.1).
Product yield was above 0.9 g-SA.g-GLR-1. Similar product yields (0.8 g-SA.g-GLR-1)
have recently been obtained by Vlysidis et al. using an A. succinogenes strain adapted to glycerol (Vlysidis, et al., 2011). However, in our study volumetric productivity was much higher (0.59 g-SA.L-1.h-1), than the obtained by Vlysidis et al. (0.27 g-SA.L-1.h-1) (Vlysidis, et al., 2011). To the best of our knowledge, this is the first report where such value has been attained in batch fermentations, using A. succinogenes as biocatalyst and glycerol as substrate. Despite of volumetric productivity in batch cultivations with glucose was higher (0.79 g-SA.L-1.h-1), formate
and acetate yields were very low in batch cultivation with glycerol (0.04 and 0.08 g.g-GLR-1, respectively) (Table 4.1). Those results demonstrate the advantage of using a reduce carbon source, such as glycerol, as it decreases the formation of by-products, compared to glucose fermentation (where ratios for formate and acetate round 0.11 and 0.22 g.g-GLR-1, respectively)
(Guettler, et al., 1996). Additionally, the maximum specific rate of SA formation was 0.77 g-SA.gbiomass-1.h-1 (Table 4.1.), which was almost two times higher than obtained using glucose as
sole carbon source (0.39 g-SA.gbiomass-1.h-1) (Corona-González, et al., 2008).
25 a volumetric productivity of 0.9 g-SA.L-1.h-1, which is higher than the present data obtained with A. succinogenes (section 1.3, Table 1.2). However, these values were obtained using MgCO3
as neutralizing agent and additional CO2 donor, which favors the production of SA as recently
described by Zou et al. (Zou, et al., 2011) whereas we used NaHCO3 as source of CO2.
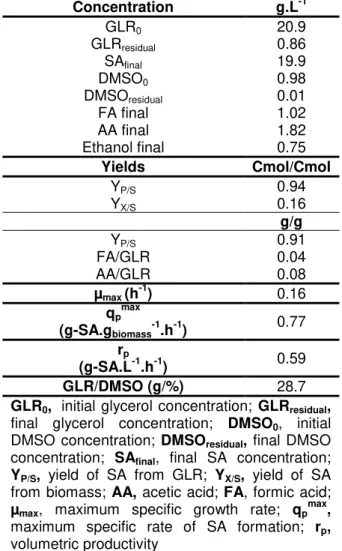
Table 4.1 – Results of batch fermentation of A. succinogenes using pure glycerol as carbon source and DMSO as electron acceptor.
Concentration g.L-1
GLR0 20.9
GLRresidual 0.86
SAfinal 19.9
DMSO0 0.98
DMSOresidual 0.01
FA final 1.02 AA final 1.82 Ethanol final 0.75
Yields Cmol/Cmol
YP/S 0.94
YX/S 0.16
g/g
YP/S 0.91
FA/GLR 0.04
AA/GLR 0.08
µmax (h-1) 0.16 qpmax
(g-SA.gbiomass-1.h-1) 0.77 rp
(g-SA.L-1.h-1) 0.59
GLR/DMSO (g/%) 28.7
GLR0, initial glycerol concentration; GLRresidual,
final glycerol concentration; DMSO0, initial
DMSO concentration; DMSOresidual, final DMSO
concentration; SAfinal, final SA concentration; YP/S, yield of SA from GLR; YX/S, yield of SA
from biomass; AA, acetic acid; FA, formic acid;
µmax, maximum specific growth rate; qpmax,
maximum specific rate of SA formation; rp,
volumetric productivity
b. Glycerol rich-product (GRP)
26 inoculum. Initial glycerol and DMSO concentrations were 30.3 g.L-1 and 1.03% (v/v),
respectively.
Figure 4.3 – Batch fermentation profile of A. succinogenes using crude glycerol as carbon source and DMSO as electron acceptor. A – Succinate, glycerol (g), DMSO (%) and OD profile; B – Formate and acetate (g) production.
Figure 4.3A represents SA production, glycerol and DMSO consumption and cell growth profile. Results are summarized in Table 4.2.
SA production after 66 h was 18.3 g.L-1 and specific growth rate was 0.05 h-1, which is quite low compared to obtained with pure glycerol (0.16 h-1). This behavior could be attributed to
A
B
Lag phase
27 impurities present in GRP. Cultivation was stopped before glycerol and DMSO total depletion (residual concentrations were 10.3 g.L-1 and 0.42% (v/v), respectively) (see Table 4.2).
A high product yield was obtained by the end of the batch, 0.93 g-SA.g-GLR-1. The
volumetric productivity, 0.28 g-SA.L-1.h-1, was much lower than during growth on pure glycerol (section 4.2a), which could be explained by the longer lag phase observed (21.9 hours on GRP instead of 10 hours on pure glycerol) (Figure 4.2A and Figure 4.3A). The lag phase corresponds to bacterial adaptation to the cultivation conditions, in this case the use of GRP, a complex substrate (i.e. with various components as described earlier). To overcome this issue, we should, for example, have prepared the inoculum in similar cultivation medium, instead of using glucose as carbon source, to reduce the adaptation phase. Additionally, the maximum specific rate of SA formation was 0.30 g-SA.gbiomass-1.h-1 (Table 4.2), which was much lower than
obtained in the batch cultivation with pure GLR (0.77 g-SA.gbiomass-1.h-1).
Formate (Figure 4.2B) was higher (0.15 g.g-GLR-1) than obtained in batch cultivation
with pure glycerol (0.04 g.g-GLR-1). However, acetate yield (0.09 g.g-GLR-1) is still much lower than that obtained with glucose (0.22 g.g-GLR-1) (Guettler, et al., 1996).
In the last 10 hours of cultivation (Figure 4.2A), growth stopped but SA continues, suggesting that product formation is partially-growth associated.
Despite SA concentration and productivity being lower than ones obtained with pure glycerol, the ratio GLR/DMSO (this ratio represents the amount of GLR fermented per DMSO consumed) was higher, suggesting than A. succinogenes could convert, with low DMSO quantities, more GLR in SA. This result is quite interesting because of DMSO high prices, making the process more economically viable.
These results show that GRP can be used as a carbon source for SA bioproduction. However, further studies should be performed in order to optimize the process.
28
Table 4.2 – Results of batch fermentation of A. succinogenes using crude glycerol as carbon source and DMSO as electron acceptor.
Concentration g.L-1
GLR0 30.3
GLRresidual 10.3
SAfinal 18.3
DMSO0 1.03
DMSOresidual 0.42
FA final 2.97 AA final 1.81 Ethanol final 1.38
Yields Cmol/Cmol
YP/S 0.99
YX/S 0.09
g/g
YP/S 0.93
FA/GLR 0.15
AA/GLR 0.09
µmax (h-1) 0.05 qpmax
(g-SA.gbiomass-1.h-1) 0.30 rp
(g-SA.L-1.h-1) 0.28
GLR/DMSO (g/%) 38.9
GLR0, initial glycerol concentration; GLRresidual,
final glycerol concentration; DMSO0, initial
DMSO concentration; DMSOresidual, final DMSO
concentration; SAfinal, final SA concentration; YP/S, yield of SA from GLR; YX/S, yield of SA
from biomass; AA, acetic acid; FA, formic acid;
µmax, maximum specific growth rate; qpmax,
maximum specific rate of SA formation; rp,
volumetric productivity;
4.3. Optimization of SA production by A. succinogenes
a. Batch cultivation with successive glycerol and DMSO pulses
29
Figure 4.4 – Batch cultivation with successive glycerol and DMSO pulses for improved SA production. A – Succinate, glycerol (g) and DMSO (%) profile; B – OD and DCW (g); C – Formate and acetate (g) production.
Batch-phase 1st pulse 2nd pulse
B A
30
Initial batch-phase
The cultivation was initiated as batch, with initial glycerol and DMSO concentrations of 47 g.L-1 and 1.1 % (v/v) respectively. The medium was inoculated with a 50 mL of an active culture and cultivation ran until glycerol or DMSO was depleted, corresponding to an arrest in base addition. 16.5 g.L-1 SA were produced after 41 hours cultivation (Figure 4.4A, Table 4.3). The specific growth rate was 0.13 h-1, which is lower than obtained in the previous batch cultivation with pure GLR (0.16 h-1). This behavior could be attributed to higher initial GLR concentration, which could inhibit the cell growth.
As DMSO was totally consumed, base addition stopped, confirming that DMSO plays an essential role in glycerol conversion to SA (Figure 4.4A). A low product yield, compared to batch cultivation with pure glycerol, was obtained by the end of this initial batch phase (0.57 g-SA.g-GLR-1) with a corresponding volumetric productivity of 0.38 g-SA.L-1.h-1. However, the maximum specific rate of SA formation was similar, 0.76 g-SA.gbiomass-1.h-1 to that obtained in
31
Figure 4.5 –A. succinogenes during batch cultivation using successive GLR and DMSO pulses. A –
7.5 h; B – 28.5 h; C – 50 h; D – 72.5 h.
Table 4.3 – Batch cultivation with glycerol and DMSO pulses for improved SA production.
Concentration (g.L-1) Batch phase 1st pulse 2nd pulse
GLR0 47.1 69.3 78.5
GLRresidual 24.3 37.2 66.9
SAfinal 16.5 36.3 46.4
DMSO0 1.05 0.97 0.89
DMSOresidual 0.00 0.00 0.62
FA final 4.68 7.53 9.00 AA final 3.35 5.33 6.80 Ethanol final 0.98 1.00 0.92
Yields (Cmol/Cmol)
YP/S 0.59 0.58 0.92
YX/S 0.064 ND ND
(g/g)
YP/S 0.57 0.56 0.89
FA/GLR 0.09 0.03 0.11
AA/GLR 0.07 0.01 0.07
µmax (h-1) 0.13 ND ND qpmax
(g-SA.gbiomass-1.h-1) 0.76 0.88 ND rp
(g-SA.L-1.h-1) 0.38 0.75 0.48
GLR/DMSO (g/%) 13.0 35.4 45.4
GLR0, initial glycerol concentration; GLRresidual, final glycerol
concentration; DMSO0, initial DMSO concentration; DMSOresidual, final
DMSO concentration; SAfinal, final SA concentration; YP/S, yield of SA
from GLR; YX/S, yield of SA from biomass; AA, acetic acid; FA, formic
acid; µmax, maximum specific growth rate; qpmax, maximum specific rate
of SA formation; rp, volumetric productivity; ND, not determined
A B
32
1st pulse phase
After this initial batch phase, where all DMSO was consumed (Figure 4.4A), 45 g.L-1 glycerol and 1% DMSO were fed to the reactor in a pulse wise, and SA production continuously increased, reaching a concentration of 36.3 g.L-1 (Figure 4.4A). In this second growth phase (identified as 1st pulse phase), 32.1 g.L-1 of GLR were consumed in 26.6 hours. The volumetric productivity increased to 0.75 g-SA.L-1.h-1 (seeTable 4.3), which is similar to batch cultivation with glucose (0.79 g-SA.L-1.h-1) (Schindler, 2011), and much higher than those obtained in the cultivation with pure GLR described above (0.59 g-SA.L-1.h-1) , initial batch-phase of this assay (0.38 g-SA.L-1.h-1) and batch cultivation described by Vlysidis et al. (0.27 g-SA.L-1.h-1) (Vlysidis, et al., 2011). Additionally, the maximum specific rate of SA formation was 0.88 g-SA.gbiomass-1.h -1, even higher than in the batch-phase of cultivation and already higher than cultivation with
glucose (0.39 g-SA.gbiomass-1.h-1) (Corona-González, et al., 2008). However, like in the batch
phase, the SA yield was low. By-products yield decreased dramaticallyto 0.03 g-FA.g-GLR-1 and 0.01 g-AA.g-GLR-1 (Figure 4.4C, Table 4.3), suggesting that bacteria production of other
acids was not the reason for the low conversion of glycerol into SA. It is likely that glycerol was used by the bacteria for cell maintenance, due to the fact of the high initial GLR concentration, as described by Vlysidis et al. (Vlysidis, et al., 2011).
In this phase, biomass concentration reached its highest value (2.28 g.L-1), and then slowly decreased until the end of the fermentation (Figure 4.4B), which can be related to growth inhibition by either high SA concentration or high glycerol concentration (after the 1st pulse
glycerol concentration reached 69 g.L-1) (Table 4.3). The same behavior was also reported by Vlysidis et al. (Vlysidis, et al., 2011). Moreover, as could be observed in Figure 4.5C, in 50 hours of cultivation, bacteria started to aggregate, which could limit the mass transfer rate inside the aggregates and consequently leading to cell death. In fact at this point of cultivation, cell concentration started to decrease (Figure 4.4B).
Despite cell growth arrest, SA production continuously increased confirming that production of SA by A. succinogenes is partially-growth associated (Figure 4.4A, B).
2nd pulse-phase
33 supplemented to the broth (Figure 4.4A). The production of SA was restored, and SA concentration reached 46.4 g.L-1, the highest concentration reported so far when using glycerol as substrate to produce SA (section 1.3, Table 1.2). However, a significant decrease was observed in volumetric productivity, from 0.75 g-SA.L-1.h-1 down to 0.48 g-SA.L-1.h-1, as well as in cell concentration (Figure 4.4B, Figure 4.5D), suggesting that cells were losing viability and did not show further capacity to convert GLR to SA efficiently. Consequently, at that point, no further pulse was performed and cultivation was stopped.
The deceleration in SA production could be related to the scarcity of nutrients necessary for bacteria growth (e.g. yeast extract, chlorides). In order to verify this hypothesis, a similar batch cultivation was performed, but this time supplementing the bioreactor with complete culture medium pulses, instead of only glycerol and DMSO, when the base addition stopped (see section 3.2). The results obtained were similar (data not shown), i.e. the biomass concentration still decreased, suggesting that nutrients limitation was not the cause for cell death. Substrate or product concentrations could also be inhibitory. In fact, Vlysidis et. al showed that concentration above 50 g.L-1 of glycerol could affect the productivity and inhibit the
cell growth (Vlysidis, et al., 2011). Lin et. al also related that 45.6 g-SA.L-1 is a critical value concentration, above which A. succinogenes cells do not grow efficiently (Lin, et al., 2008). In this experiment, we reached 79 g-GLR.L-1 with more than 46 g-SA.L-1, a combination that clearly contributed to cellular stress and growth inhibition. One strategy to overcome SA inhibition would be to continuously remove the organic acids from the broth by using a cell re-cycle bioreactor, preventing inhibition of cell growth by SA.
Other possible cause for cells unviability could be the high DMSO concentration to which the cells were constantly exposed, this compound is used as bacteriostatic and could damage the cell wall. Taking into account this hypothesis, a similar cultivation was performed using pulses of low DMSO concentration. Under these conditions, bacteria were exposed to lower DMSO concentration, i.e. during the fermentation, the maximal concentration of DMSO was four times lower than in present cultivation. This cultivation essays will be present in the following section.
34 to glycerol. This adaptation could be further improved by increasing selection pressure, for instance, reducing the amount of DMSO.
b. Batch cultivation using successive low concentration DMSO pulses
In order to avoid possible growth inhibition by high DMSO concentration in A. succinogenes, a “pulsed-batch” cultivation was performed in a 2 L bench-top reactor with an initial working volume of 1.5 L. The fermentation was initiated with the introduction of a 100 mL inoculum in 1.4 L of culture medium, and it was carried out as described in section 3.2. Initial glycerol and DMSO concentration were 44.1 g.L-1 and 0.19% (v/v), respectively. With the exception of the first DMSO pulse, which was fed manually, DMSO pulses (≈0,2% (v/v)) were automatically performed whenever base addition stopped, i.e. every time organic acid production stopped.
35
Figure 4.6 – Results of batch cultivation using successive low DMSO concentration pulse. The dotted lines represent the time of DMSO pulses. A – Succinate, glycerol (g) and DMSO (%) profile; B – OD and formate, acetate and ethanol (g) production.
In this assay, A. succinogenes performance was rather atypical, with highly irregular DMSO consumption rates between pulses (Figure 4.6A, B):
After an approximately 12 hours lag phase, a first pulse of DMSO was supplied manually, and A. succinogenes growth started immediately.
Around 10 hours after this pulse, growth appeared to stop, and another DMSO supplementation was automatically performed. No changes were observed during the following 5 hours.
A
36
A third pulse was performed and the bacteria start and kept on growing during 6 hours, after which cell concentration decreased.
During this decrease in cell concentration (Figure 4.6A), another DMSO pulse was automatically supplied, but cells continue to lose viability.
Figure 4.7 illustrates the morphology of A. succinogenes during this cultivation: during the first 6 hours, number of bacteria is scarce (Figure 4.7A, B). After the second DMSO supplementation, at 26 hours fermentation, a strong increase in OD was observed, confirmed by microscopy observation, resulting in a large increase in biomass (Figure 4.7C). As described above, at the end of cultivation cells seems to lose viability. In Figure 4.7D, we could see, after 47 hours of cultivation, A. succinogenes was forming large cells aggregates, which could cause limits in mass transfer, leading to cell death.
Figure 4.7 –A. succinogenes during batch cultivation using successive low concentration DMSO pulses. A – 2 h; B – 6 h; C – 26 h; D – 47 h.
The atypical cell concentration profile and the formation of aggregates would suggest that a minimum DMSO concentration is actually required to initiate growth and produce SA efficiently. These results showed that reduced DMSO concentration in bioreactor did not improve neither SA production nor bacterial growth. In addition, this strategy, with low DMSO
B A
38
4.4. Effect of neutralizing agent on bacterial growth and SA production
The culture pH is known to be one of the key factors in both cell growth and SA production (Guettler, et al., 1996) since it influences cellular metabolism by changing the chemical environment and affecting enzyme activity (Podkovyrov, et al., 1993).
Due to the rapid accumulation of organic acids, such as SA, FA and AA, the use of a neutralizing agent, to maintain the pH within an optimal range, is strictly necessary. In most fermentation process (with organic acids as end-products), alkaline solutions are used to regulate pH. Consequently, an increase in osmotic stress in the fermentation broth is usually observed, which influences both cell growth and SA production. Actually, particularly at the end of fermentation, when metal ion concentration reached a certain value, cell aggregation and unviability were observed in cultivation experiments reported in literature (Wang, et al., 2011; Fang, et al., 2011), this behavior was also observed in batch cultivation described above. These variations in cell morphology during cultivation, including flocculation and lumping, are believed to be due by the type of neutralizing agent, in particularly due to the metal ion present in this solution (Lee, et al., 1999; Liu, et al., 2008; Wang, et al., 2011).
In order to avoid cell flocculation and lumping, and consequently optimize SA bioproduction by GLR, different neutralizing agent combination strategies were applied to control pH broth: standard batch cultivation with NaOH (200 g.L-1) was duplicated using MgCO3,
Mg(OH)2 and Ca(OH)2 as neutralizing agents. In these batch cultivations, we could observe the
influence of metal ions, such as Na+, Mg2+ and Ca2+, on microbial performances.
a. Batch cultivation using NaOH as neutralizing agent
In order to study the effect of sodium ions on cell growth and SA production and to further compare with other neutralizing agents, batch cultivation was performed in a 2 L bench-top reactor with an initial working volume of 1.5 L. The assay conditions were the same as the ones described in section 4.2a, with the following exceptions: inoculum size was 6.7% (v/v) instead of 5% (v/v) and bioreactor was supplemented with a DMSO pulse leading to glycerol total depletion. Initial glycerol and DMSO concentration were 36.9 g.L-1 and 0.94% (v/v),
39 DMSO (0.63% (v/v)) was supplied, resulting in further GLR and DMSO consumption until total depletion (Table 4.4). 30.6 g.L-1 of SA were produced after 43.7 hours cultivation. The cells presented a specific growth rate of 0.12 h-1.Acetic and formic acids did not reach concentration
above 4.4 and 4.2 g.L-1, respectively (see Table 4.4).
Figure 4.8 represents glycerol and DMSO consumption, cell growth, SA and byproducts formation. Results are summarized in Table 4.4.
Figure 4.8 – Results of batch cultivation of A. succinogenes on glycerol using NaOH as neutralizing
agent. A – Succinate, glycerol (g), DMSO (%) and OD profile; B – Formate and acetate (g) production.
A
B