M
ESTRADO EMF
INANÇAST
RABALHOF
INAL DEM
ESTRADOD
ISSERTAÇÃOD
ETERMINANTS OFC
ASHH
OLDINGS ONS
TART-U
PSM
ARIAR
ITA DEA
LMEIDAF
ERNANDESV
ALENTIMD
UARTEM
ESTRADO EMF
INANÇAST
RABALHOF
INAL DEM
ESTRADOD
ISSERTAÇÃOD
ETERMINANTS OFC
ASHH
OLDINGS ONS
TART-U
PSM
ARIAR
ITA DEA
LMEIDAF
ERNANDESV
ALENTIMD
UARTEO
RIENTAÇÃO:
P
ROFESSORAA
NAI
SABELO
RTEGAV
ENÂNCIOi
ABSTRACT
The purpose of this study is to examine the determinants and the implications of cash holding on start-ups for a sample of Portuguese firms. We use a database that combines firm-level financial data with a matched employer-employee database, for the period between 2004 and 2009, presenting a sample of 15,693 observations.
Unlike previous studies, we examine which start-ups and founders’ educational and social-demographic characteristics are more likely to be associated with cash holdings. In terms of methodology, it is conducted a Tobit analysis where we control for year, industry and NUTS in the estimation of our model. It is possible to observe that start-ups cash holding levels are positively affected by investment opportunities, long term debt and founder’s characteristics and the contrary for start-ups size, liquid assets substitutes and bank debt. When analyzing by NUTS, it is possible to see that the regions of Lisbon, Center and Azores present the same characteristics. Finally, at the industry level: size, liquid assets and debt maturity structure are negatively related with cash holdings across industries. While for founder’s characteristics, the educational levels below the higher level of education have a negative impact over start-ups cash holding levels.
Regarding the effects of market imperfections on cash holdings, our results suggest that start-ups with more information asymmetry hold more liquid assets, confirming the Pecking Order Theory hypothesis. Overall, we can conclude that the Trade-off Theory and the Pecking Order Theory are the ones that play the most important role in explaining the determinants of Portuguese firm’s cash holdings.
JEL classification: G3; G32; G39; M13
Keywords: Cash holdings; Start-Ups; Cash determinants; Trade-off Theory; Pecking
ii
RESUMO
Este estudo tem como objectivo analisar os determinantes da gestão de tesouraria, bem como as suas implicações ao nível das start-ups portuguesas. Recorrendo a uma base de dados que conjuga informação financeira com dados sobre empregado-empregador, para o período entre 2004 e 2009, ficando com uma amostra de 15,693 observações. Ao contrário de estudos anteriores, avaliámos a importância que a gestão de tesouraria assume nas start-ups, examinando como as características educacionais e demográficas dos fundadores estão associadas à sua gestão. Em termos da metodologia, iremos recorrer a uma análise Tobit, onde controlamos a nossa estimação através do ano de referência, industria e NUTS. É possível observar que a gestão de tesouraria nas start-ups é afectada positivamente pelas oportunidades de investimento, dívida de longo prazo e caracteristicas sócio-demográficas e educacionais do fundador. Por outro lado, a gestão de tesouraria nas star-ups é negativamente afectado pela dimensão, activos líquidos e dívida bancária. Para a análise ao nível das NUTS, é possível observar que as região de Lisboa, Centro e Açores apresentam as mesmas caracteristicas. Ao nível da análise por industria, temos que, a dimensão, os activos liquídos e a estrutura da dívida das start-ups está negativamente relacionado com a gestão de tesouraria. Para as caracteristicas do fundador, os níveis educacionais abaixo do nível educacional mais elevado apresentam um impacto negativo na gestão de tesouraria das start-ups.
Então, as start-ups por sofrerem de assimetria de informação acabam por deter mais activos liquídos, confirmando as teorias associadas ao Pecking Order. Podemos então esperar que o Pecking Order, e a teoria do Trade-off, sejam as melhores para explicar os determinantes da gestão de tesouraria das start-ups portuguesas que vamos analisar.
Classificação do JEL: G3; G32; G39; M13
Palavras-chave: Cash holdings; Start-Ups; Cash determinants; Trade-off Theory;
iii
ACKNOWLEDGMENTS
I am grateful to many people for help, both direct and indirect, in writing this dissertation.
First of all, I would like to thank my coordinator, Professor Ana Venâncio from the Lisboa School of Economics and Management, for all the dedication, support, advice and guidance. Her contributions to the genesis and development of this research, both in terms of intellectual insight and comments and in terms of inspiration and encouragement, were essential.
I would like to thank to my family for proportionate me the opportunity to do the Financial Master and my colleagues.
Finally, I would like to thank the Portuguese Ministry of Employment and Social Security and Gabinete de Estratégia e Planeamento (GEP) for giving me access to the matched employer-employee data. All errors remain my own. Views expressed are those of the author and do not necessarily reflect those of any branch or agency of the Government of Portugal.
iv
TABLE OF CONTENTS
ABSTRACT ... i RESUMO ... ii ACKNOWLEDGMENTS ... iii LIST OF TABLES ... v 1. INTRODUCTION ... 1 2. LITERATURE REVIEW ... 42.1. Motives for holding cash ... 4
2.2. Cash Holdings Theories ... 6
2.2.1. The Trade-off Theory... 6
2.2.2. The Pecking Order Theory ... 7
2.2.3. Free Cash Flow Theory ... 8
2.3. The Determinants of Cash Holdings: Empirical Evidence ... 9
3. THEORY AND HYPOTHESES ... 13
4. DATA AND DESCRIPTIVE STATISTICS ... 17
4.1. Sample and Data ... 17
4.2. Variables and Descriptive Statistics ... 18
5. EMPIRICAL METHODOLOGY AND RESULTS ... 22
6. CONCLUSION... 33
7. BIBLIOGRAPHY ... 36
v
LIST OF TABLES
Table 1 – Descriptive StatisticsTable 2 – The Impact of Start-ups’ Determinants on Cash Holding (Tobit)
Table 3 – The Impact of Start-ups’ Determinants and Firms’ Characteristics on Cash
Holding per NUTS (Tobit)
Table 4 – The Impact of Start-ups’ Determinants and Firms’ Characteristics on Cash
Holding per Industries (Tobit)
Table A 1 – Main determinants of Cash Holdings and each theory
Table A 2 – Description of Variables
1
1. INTRODUCTION
Lack of cash is perceived as one of the major obstacles to firm’s growth and investment1. Cash-rich firms have stronger growth opportunities, can undertake diversified acquisitions, have a buffer to face uncertainty and avoid the likelihood of failure (Harford, 1999). Others argue that cash-rich firms are more likely to engage in value destroying activities (Harford, 1999) and have a higher business risk (Opler, Pinkowitz, Stulz, & Williamson, 1999). Alternatively, firms that hold less cash have greater access to capital markets and can more easily renegotiate their debt contracts (Opler, et al., 1999) and consequently have lower business risk (Opler, et al., 1999). In order to explain the reasons underlying cash holdings, several theories have been put forward: trade-off (Miller & Orr, 1966), pecking order (Myers 1984; Myers & Majluf 1984) and the free cash flow (Jensen, 1986). The trade-off theory claims that the optimal cash level is determined by balancing the benefits and costs associated by holding cash; The pecking order theory states that in order to minimize the existence of asymmetric information in financial markets, firms establish an hierarchy, using cash/retained earnings, followed by safe debt and risk debt, and finally with equity; In contrast, the free cash flow theory defines the level of cash by minimizing the information asymmetry between shareholders and managers. Entrenched managers prefer to accumulate cash in the absence of investment opportunities, rather than pay it out to shareholders, gaining discretionary power over firm’s investment decisions, and simultaneously, suiting their own interests.
1 For detailed explanation, see: Watson, Hogarth-Scott, & Wilson (1998); Chandler & Hanks (1998); Ortqvist, Masli,
2
In terms of empirical analysis, previous studies find that the level of cash holdings is positively affected by investment opportunities and cash flow uncertainty, whereas is negatively affected by the amount of liquid asset substitutes, size and leverage (Ferreira & Vilela, 2004).
Nevertheless, previous theories target public (Opler, et al., 1999), private2 or private family firms (Steijvers & Niskanen, 2012) remaining partially unexplored the reasons underlying cash holdings by start-ups.
This is an important gap in the literature because cash management is extremely crucial for new ventures, as they often struggle to survive, with very low levels of income and revenues during the first years, not having yet built a track record or a business volume (Mahomed, 2012). Thus, founders remain the most important source of funding, bearing the risk of failure, with capital markets playing a greater role in firm’s growth phase, rather in the start-up phase (Bruno & Tyebjee, 1985; Freear & Wetzel, 1990 and Manigart & Struyf, 1997). In fact, capital markets do not provide sufficient funds for start-ups (Bendick & Egan, 1987).
For start-ups, cash allows to obtain of external capital (Kim, Mauer, & Sherman 1998; Harford 1999 and Opler, et al. 1999) and increase value, being more able to undertake valuable projects that might otherwise be ignored (Denis & Sibilkov, 2007).
In our study, we evaluate the importance of cash holdings for start-ups, by examining which start-ups and founder’s social-demographic and educational characteristics are more likely to be associated with larger cash holdings.
2 For detailed explanation, see: Ferreira & Vilela (2004); Dittmar & Mahrt-Smith (2007); Foley, Hartzell, Titman, &
3
Our analysis draws on a matched employer-employee database (QP – “Quadros de Pessoal”) combined with financial data, using the SCIE (Simplified Corporate Information) database. Our data covers all private firms in Portugal from 2004 to 2009 and it allows us to have detailed information not only on start-up’s characteristics and cash holdings but also on their founders’ demographic and educational characteristics.
Our results suggest that it is possible for start-ups to understand which cash holding determinants affect their cash holding levels, and to which determinants cash is positively or negatively related. Cash holding levels are positively affected by investment opportunities, long term debt and founder’s characteristics and the contrary for start-ups size (initial number of employees), liquid assets substitutes (such as marketable securities) and bank debt. When analyzing by NUTS, the regions of Lisbon, Center and Azores present the same characteristics. Finally, at the industry level, size is negatively related with cash holdings across majority of industries; liquid assets and debt maturity structure (short and long term) also present a negative relation across all industries. For founder’s characteristics, the educational levels below high educational level negatively affect start-up’s cash holding levels.
The remaining sections of this study are organized as follows. Section II reviews the main theories and empirical studies on cash holdings. Then, in section III we exhibit our theory and hypotheses. In section IV, we describe the dataset and the main variables. The empirical methodology and results are described in section V. Finally, we present our conclusions in section VI.
4
2. LITERATURE REVIEW
2.1. Motives for holding cash
Firms hold cash for precautionary, transaction and/or tax motives.
The precautionary motive defines that cash is hold to hedge future cash shortfalls (Kyenes, 1936). Firms use cash to finance its activities and investments, if there is no other sources of funding available or if funding is excessively costly (Kyenes, 1936). Thus, firms with higher costs of external funding and with more volatile and low returns on assets will hold larger amounts of cash (Kim, et al., 1998). Holding cash is based on the ability to raise funds, even when firms have access to capital markets (Dittmar, et al., 2003). Also Opler, et al. (1999), suggest that cash holdings allow firms to reduce the underinvestment problem3 by keeping cash on hand. Nevertheless, Almeida, Campello, & Weisbach (2004) found that the precautionary motive mainly holds for financially constrained firms.
The transaction motive, suggested by Baumol (1952) and Miller & Orr (1966), shows that firms hold cash in order to reduce transaction costs, by using cash to make payments rather than liquidating assets. Therefore, firms hold more cash when the transaction costs to convert non-cash assets into cash are likely (Daher, 2010). Demand for cash increases when a firm suffers from transaction costs of converting non-liquid assets into cash (Bates, Kahle, & Stulz, 2009). However, large firms tend to hold less cash, because transaction costs reduce with economies of scale (Mulligan, 1997).
3
Cash reserve reduces managers’ dependence on external financing and increases company value by reducing underinvestment, once the precautionary motive of cash reserve arguments that value maximizing managers prefer to reserve cash if firms have a high future growth, believing that expensive external financing undermines investment opportunities.
5
Cash holdings level is also justified by tax incentives. For example, Foley, et al. (2007) finds that liquidity levels are partially due to tax incentives, concluding that U.S. firms, that incur in tax consequences associated with repatriating foreign earnings, hold higher levels of cash. Foley, et al. (2007) also observe that financialy constrained firms are less likely to have tax incentives for holding cash abroad. Thus, firms with higher taxes for repatriating earnings hold more cash. Another situation has to do with the double taxation, where firms prefer to hold cash rather than returning it to equity holders (Faulkender, 2002). The after-tax return on the cash may be less than what investors could have earned by investing that cash for themselves. However, in a situation where firms pay dividends to shareholders the earnings on cash, held by the firm, will be double taxed firstly at the corporate level then again at the individual level (Faulkender, 2002). The double dividend taxation4 will then destroy shareholder value relative to investors holding the cash themselves. Thus, in order to avoid double taxation firms will prefer to hold cash rather than pay dividends to shareholders (Foley, et al., 2007).
Cash Definition
Cash holding includes: cash in hand5, readily available for investment in physical assets or to distribute to investors (Gill & Shah, 2012) and cash equivalents that can be easily converted into cash (Opler, et al., 1999).
Theory suggests that lines of credit are seen as a very important source of liquidity but they are not defined as cash holdings (Holmström & Tirole, 1998). Cash holding and lines of credit are not typically held for the same purposes. Lines of credit are mostly held for precautionary motive, whereas cash is held for operational purposes namely to
4
Where earnings are taxed at year end, when firms pay tax on earnings, and when after-tax earnings are distributed to shareholders in the form of dividends.
5 Lins, Servaes, & Tufano (2010) show that most of the cash held by firms is for operational purposes and thus cannot
6
take advantage of future growth opportunities and to access funding when external capital reveals difficult (Lins, et al., 2010). Non-operational cash, that qualifies as excess of cash is mainly held for precautionary motive, serving as a shield against potential cash shortfalls (Lins, et al., 2010).
2.2. Cash Holdings Theories
In a perfect market, cash holdings do not affect the value of the firm (Modigliani & Miller, 1963). To finance profitable investment projects, firms may easily go to capital markets and replicate several strategies (Modigliani & Miller, 1963). Nevertheless, due to the existence of market imperfections cash holding levels earn relevance once firms cannot borrow and lend at the same rate. Thereby, firms should take into account: the existence of transaction costs, information asymmetries and agency costs, which affects the optimal cash holding level. Several theories have been put forward that account for these market imperfections: the trade-off theory, the pecking order theory, the free cash flow theory and finally the agency theory.
2.2.1. The Trade-off Theory
According to the trade-off theory (Miller & Orr, 1966), the level of cash holdings is defined by weighting the marginal costs and benefits of holding cash. Thus, assuming that managers maximize shareholders wealth, firms will set their level of cash in a way that its marginal benefits equal its marginal costs.
The main benefits of holding cash are: firstly, the low exposure to financial distress as it acts as a safety reserve to face unexpected losses or external financial constraints (Opler, et al., 1999 and Ferreira & Vilela, 2004). Secondly, it allows the pursuance of the optimal investment policy even when financial constraints are met (Opler, et al.,
7
1999 and Ferreira & Vilela, 2004). Finally, it contributes to minimize the costs of raising external funds or liquidate existing assets, acting like a buffer between firm’s sources and uses of funds (Ferreira & Vilela, 2004).
The main cost of holding cash is the opportunity cost of the capital invested, due to the low return, in liquid assets. Thus, firms with insufficient cash levels have to forgo profitable investment projects or to support abnormally high costs of financing (Ferreira & Vilela, 2004). These costs depend on whether managers maximize shareholders’ wealth or not (Kim, et al., 1998).
2.2.2. The Pecking Order Theory
The pecking order theory (Myers, 1984; Myers & Majluf, 1984), assumes that firm’s capital structure is a direct consequence of its profitability, investment needs and payout policy. According to this theory, cash becomes available to firms when profits exceed the investment needs, being the excess of cash paid out in the form of dividends.
This theory emerges as a result of the asymmetric information in financial markets, where corporate managers often have access to better information about financial health of their firms than the outside investors (Pastor, 2010). According to this theory, firms finance investments firstly, through retained earnings, secondly using safe debt and risky debt and finally using equity (Myers & Majluf, 1984). Thus, when the current operational cash flows are enough to finance new investments, firms repay debt and accumulate cash. On the contrary, when retained earnings are not enough to finance current investments, firms call upon the accumulated cash holdings and, if needed, issue debt (Ferreira & Vilela, 2004).
8
2.2.3. Free Cash Flow Theory
The free cash flow theory introduced by Jensen (1986), explains that corporate managers have an incentive to accumulate cash above the optimal level in order to raise the amount of assets under their control, and this way, increase the discretionary power over the firm’s investment decision (Murphy, 1985).
Firstly, corporate managers may hold excess cash simply because they are risk adverse (Pastor, 2010). Thus, more entrenched management is more likely to hold excess cash because it can avoid market discipline. Secondly, managers may accumulate cash in order to increase firm´s flexibility to pursue their own objectives. This accumulation of cash allows managers to make investments that capital markets are not willing to finance. In sum, by enabling management to avoid the discipline of capital markets, investing in cash can therefore have an adverse effect on firm value (Kalcheva & Lins, 2007). Thirdly, managers accumulate cash because they do not want to pay it out to shareholders; they prefer to keep funds within the firm. Corporate managers can use this cash by taking poor projects when good projects are not available (Opler, et al., 1999). Managers invest in projects that suit their own private interests instead of shareholder´s interests (Harford, 1999).
Moreover, managers have a greater preference for cash, because it reduces firm risk, increasing firm discretion (Opler, et al., 1999). As Myers & Rajan (1998) argue, liquid assets can be transformed into cash at lower cost than other assets, being expected to control shareholders to invest in liquid assets (Dittmar & Mahrt-Smith, 2007; Kalcheva & Lins, 2007). This greater preference for cash can lead managers to place too much importance on the precautionary motive for holding cash. One would therefore expect
9
firms to hold more liquid assets than would be required to maximize shareholder wealth (Opler, et al., 1999).
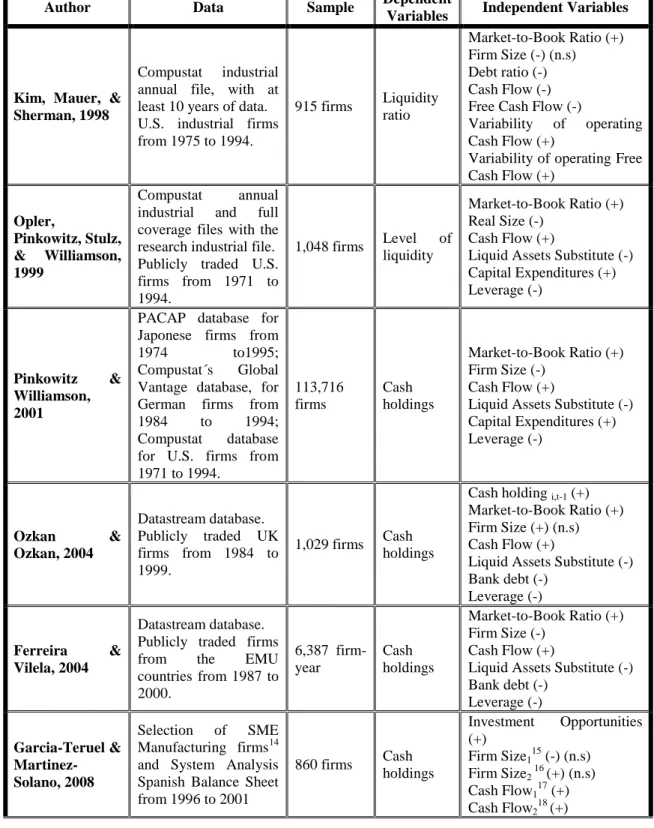
2.3. The Determinants of Cash Holdings: Empirical Evidence
In this subsection, we summarize empirical evidence on the determinants of cash holding, namely: investment opportunities, firm size, cash flow, liquid assets substitutes, capital expenditures, financial institutions, debt maturity structure and leverage.
Staring with firm’s investment opportunities, the relationship with cash holdings is positive and supported by the precautionary motive6. As the cost of external financing increases the probability of forgoing profitable investments also increases, consequently holding liquid assets will allow firms to take advantage of profitable opportunities (García-Teruel & Martínez-Solano, 2008). As a result, firms with greater investment opportunities hold more cash because adverse shocks and financial distress are more costly to firms with more investment opportunities (Ferreira & Vilela, 2004).
Firm´s size negatively affects the levels of cash holdings7. Small firms tend to hold more cash because they are more likely to face borrowing constraints and have less access to capital markets (Fazzari & Petersen, 1993; Kim et al., 1998 and Ozkan & Ozkan, 2004).
Cash-flows are generated internally by firms and represent an additional source of liquidity for firms. The relationship between cash flows and cash holdings is not
6
For detailed explanation, see: Shleifer & Vishny (1992); Kim et al. (1998); Opler, et al. (1999); Pinkowitz & Williamson (2001); Ozkan & Ozkan (2004); Ferreira & Vilela (2004); Garcia-Teruel & Martinez-Solano (2008); Bates, et al. (2009) and Kim, Kim, & Woods (2011).
7
For detailed explanation, see: Kim et al. (1998); Opler el al. (1999); Pinkowitz & Williamson (2001); Ferreira & Vilela (2004); D’Mello, Krishnaswami, & Larkin (2008); Harford et al. (2008); Bates et al. (2009) and Kim, Kim, & Woods (2011).
10
unanimous. The negative relation is pointed by Kim, et al. (1998), Harford (1999) and Harford et al. (2008), where cash flow provides a ready source of liquidity and can be used as a cash substitute. On the other hand, for the positive relationship8, firms that experience an increase in cash flows keep higher cash holding levels in order to fund later investments or as a buffer. However, for cash flow uncertainty, firms with more volatile cash flows face a higher probability of cash shortages due to unexpected cash flow deterioration, thus firms with greater cash flow uncertainty will hold more cash (Opler et al., 1999 and Ferreira & Vilela 2004).
The relationship between cash holdings and liquid assets substitutes is negative9. Non-cash liquid assets are seen as Non-cash substitutes and in times of need they are quickly liquidated to generate funding, so firms with more non-cash liquid assets are likely to hold less cash (Ferreira & Vilela, 2004).
For capital expenditures, the relationship with cash holdings is not unanimous. Bates, et al. (2009) and Kim, et al. (2011) suggest a negative relationship. Capital expenditures represent an asset that can be taken as collateral, enhancing borrowing capacity and decreasing the need for cash. Further, Riddick & Whited (2009) capital expenditures could proxy for financial distress costs being positively related to cash. Moreover, Opler, et al. (1999) and Pinkowitz & Williamson (2001), show that firm´s cash holdings increases as capital expenditures increases. Besides there is no evidence that capital expenditures increase faster for smaller firms as cash holding increases, firms that hold
8
For detailed explanation, see: Opler et al. (1999); Pinkowitz & Williamson (2001); Faulkender (2002); Ozkan & Ozkan (2004); Ferreira & Vilela (2004); Hofmann (2006); García-Teruel & Martínez-Solano (2008) and Kim, Kim, & Woods (2011).
9
For detailed explanation, see: Opler et al. (1999); Pinkowitz & Williamson (2001); Ozkan & Ozkan (2004); Ferreira & Vilela (2004); García-Teruel & Martínez-Solano (2008); Bates, et al. (2009) and Kim, Kim, & Woods (2011).
11
more cash have higher capital expenditures and spend more on acquisitions, even when they have poor investment opportunities (Opler, et al. 1999).
In terms of firm’s debt maturity structure firms with more short-term debt in their capital structure are expected to hold more cash, because they can meet constraints of renewal credit lines and are subject to the risk of experiencing financial distress (Saddour, 2006). However, Barclary & Smith (1995) and García-Teruel & Martínez-Solano (2008) find a negative relationship, where firms with highest credit rating have better access to capital markets and hold less cash. Indeed, firms that use more long-term debt have less risk of refinancing and less information asymmetry (García-Teruel & Martínez-Solano, 2008).
In terms of financial institutions the relationship with cash holdings is positive (Ozkan & Ozkan, 2004). Establishing relationships between borrower and lender reduces information asymmetry and agency problems (Ozkan & Ozkan, 2004). Financial institutions willingness to provide financing can signal positive information about that firm; moreover, by providing signals about the borrowing creditworthiness it may enhance firms’ ability to raise external finance (Ozkan & Ozkan, 2004). This suggests that firms with higher proportion of bank debt are able to access external financing more easily, holding less cash (Ozkan & Ozkan, 2004). Moreover, the firms’ flexibility of renegotiate bank debt, can serve as a substitute for holding high levels of cash (Ozkan & Ozkan, 2004). For small firms, it helps to improve the availability of funds, since firms suffer less credit rationing in the bank credit market (Harhoff & Körting, 1998; Peterson & Rajan, 1999 and De Bodt, Lobez, & Statnik, 2005).
12
Finally, for leverage, the relationship with cash holdings is negative10. Heavily levered firms might hold more cash because of higher default and bankruptcy risks (Ferreira & Vilela, 2004). In order to reduce the probability of financial distress firms accumulate cash (Ferreira & Vilela, 2004).
Table A 1 - Summarizes the relationship with the main determinants of Cash Holdings and each theory.
10
For detailed explanation, see: Opler et al. (1999); Pinkowitz & Williamson (2001); Ozkan & Ozkan (2004); Ferreira & Vilela (2004); Bates, et al. (2009) and Kim, Kim, & Woods (2011).
13
3. THEORY AND HYPOTHESES
The presence of market imperfections implies the existence of an optimal cash level that maximizes firm value, which balances the costs and benefits of holding cash.
On the one hand, information asymmetry and agency conflicts, between shareholders and creditors, increases funding difficulties. Thereby, firms hold liquid assets in order to reduce costs associated with dependence on external financing. Firms with higher levels of human capital seek other forms of financing, presenting higher survival rates, while banks focus on financial evidence of creditability, as opposed to information about founder’s human capital, for making loan decisions (Åstebro & Bernhardt, 2003). On the other hand, managers have incentives to accumulate cash, increasing the amount of assets under their control inducing in behaviors that might be detrimental to shareholders.
The imperfections mentioned above are more serious for start-ups due to their greater informational opacity that worsens information asymmetry problems (Berger & Udell, 1998). Along with this, the coincidence of ownership and control makes agency problems associated with debt more serious (Pettit & Singer, 1985). Therefore, start-ups are likely to suffer financial difficulties (Titman & Wessels, 1988), as well as financial constraints (Whited, 1992 and Fazzari & Petersen, 1993) and higher transaction costs given the economies of scale associated with these costs (Mulligan, 1997).
As mentioned in the literature review, investment opportunities are an important factor that positively affects cash holding levels11. According to Myers and Majluf (1984), firms whose value is largely determined by their growth opportunities have larger
11 For detailed explanation, see: Kim et al. (1998); Opler et al. (1999); Ferreira & Vilela (2004) and Ozkan & Ozkan
14
information asymmetry incurring consequently in higher external financing costs. Once firms that are in the beginning of their activity, they have risky debt and greater growth opportunities are likely to pass up valuable investment opportunities, facing higher agency costs (Myers, 1977). Thus, firms having more investment opportunities have more incentives to avoid financial distress and bankruptcy and hence hold more cash and marketable securities (Williamson, 1988; Harris & Raviv, 1990 and Shleifer & Vishny, 1992).
Hypothesis 1: Start-ups with more investment opportunities require higher levels of
cash holdings.
Previous literature suggests that there are economies of scale associated with the cash levels required to confront the normal transactions of the firm, so that larger firms can keep lower cash holdings. Firm’s size affects the level of cash holding and this is particularly relevant for start-ups. Large firms have less information asymmetry than small firms12. Small firms face more financing constraints and higher costs of external financing than larger firms (Whited, 1992; Fazzari & Petersen, 1993 and Kim et al., 1998). Size of firms can also have an impact on the expected costs of financial distress, once large firms are more likely to be diversified and thus less likely to experience financial distress (Titman & Wessels, 1988), being small firms more likely to be liquidated when they are in financial distress (Ozkan, 1996), if that is the case, small firms will hold more cash to avoid financial distress (Ozkan & Ozkan, 2004). Thus, it is expected that star-ups to face higher financing constraints and simultaneously present higher likelyhood of financial distress once they cant create economies of scale.
12 For detailed explanation, see:Collins, Rozeff, & Dhaliwal (1981); Brennan & Hughes (1991); Jordan, Lowe, &
15
Hypothesis 2: Start-ups’ lack of size requires higher levels of cash holdings.
The presence of liquid assets apart from cash and marketable securities (for example, debtors or stocks) can affect a firm’s optimal level of cash holdings, since liquid assets can be considered as substitutes for cash (García-Teruel & Martínez-Solano, 2008), being the liquid assets quickly liquidated in the event of a cash shortage (Ferreira & Vilela, 2004). Therefore, the cost of converting non-cash liquid assets into cash is lower when compared with other assets (Ozkan & Ozkan, 2004).
Hypothesis 3: The presence of liquid assets on star-ups requires lower levels of cash
holdings.
The distribution of debt maturities between short and long-term can affect decisions concerning cash holding levels that firms maintain (Guney, Ozkan, & Ozkan 2003; Ferreira & Vilela, 2004). The use of short-term debt obliges firms to negotiate the renewal of credits periodically, with the consequent risk of refinancing. Thus, firms with larger proportions of short-term debt keep higher cash levels in order to avoid situations of financial distress that firms will incur if their loans fail to be renewed. Furthermore, start-ups that face greater informational asymmetry keep more short-term debt, once short-term debt can be seen as a proxy for information asymmetry; therefore start-ups with more short-term debt keep higher levels of cash, being liquid financial assets for star-ups seen as collateral in obtaining financing, due to the lack of information concerning credit quality.
Moreover, establish banking relationships between borrower and lender may reduce information asymmetry and agency problems, since information about client quality can be disclosed, improving the availability and conditions of financing. Hence start-ups
16
that seek to maintain banking relationships will help to improve the availability of funds.
Hypothesis 4a: Start-ups short-term debt structure requires higher levels of cash
holdings.
Hypothesis 4b: Start-ups long-term debt structure requires higher levels of cash
holdings.
Finally, looking into the relevance of founder’s characteristics on start-ups it is important to understand the relevance of their educational characteristics, as well as their experience, over the firm management.
Founder’s characteristics increase the capacity of start-ups to face unexpected situations, through the management of firm’s assets, such as the cash levels or using cash as collateral, allowing start-ups to have access to financing in order to invest on the increase of sales, generating higher revenues.
Hypothesis 5: Start-ups founder’s educational characteristics affect the level of cash
17
4. DATA AND DESCRIPTIVE STATISTICS
4.1. Sample and Data
Data for our empirical analysis comes from a matched employer-employee dataset QP (“Quadros de Pessoal”), combined with the SCIE (“Sistema de Contas Integrado da Empresa”).
QP is a mandatory survey submitted annually, by firms with at least one employee, to the Portuguese Ministry of Employment and Social Security. This data includes information on an average of 227,000 firms and about 2,000,000 individuals per year, covering virtually all the Portuguese private sector. Its mandatory nature and public availability, makes the QP highly reliability and with a great coverage. Annually, each firm reports: their year of entry, location, industry classification, number of employees, number of establishments, initial capital, and ownership structure. At the individual level, the data contain information on gender, age, and education.
As QP data set lacks of economic and financial information, we use the SCIE, a mandatory survey that results from institutional cooperation among several institutions (e.g. Portuguese Ministry of Justice, Ministry of Finance and Public Administration, National Statistics Office (INE) and Portuguese Central Bank). The SCIE is available from 2004 to 2009 and collects year-end information on accounting variables on private firms and self-employed individuals all over Portugal. With this database, we have detailed information on firm’s capital structure, leverage, debt maturity structure, level of cash, cash flow, liquid assets and sales growth.
From the QP, we select all start-ups established between 2004 and 2009. The data includes 17,239 start-ups. For these new firms, we identify the founders and their
18
background history. We exclude firms for which we could not identify at least one owner or the background history of the founder, as well as, situations of serial entrepreneurs, in order to have only one observation for each firm. We also restrict the sample to founders with age between 20 and 60. Our final sample is an unbalanced panel data with 15,693 firm-year observations.
4.2. Variables and Descriptive Statistics
Our dependent variable is cash holdings ( ) defined as the ratio of cash and marketable securities to net total assets. The same measure was used by Ozkan and Ozkan (2004).
As in García-Teruel & Martínez-Solano (2008), our model includes the most relevant factors that affect firm’s optimal cash holding levels13
, suggested by the theories mentioned in the previous sections (the Trade-off Model, Pecking Order Theory and Free Cash Flow Theory). We use firm’s growth opportunities ( ). As start-ups firms do not have historical information about their market value, we could not use the book-to-market ratio, as is common practice in the cash holding literature for larger firms. Instead, we use sales ratio ( ⁄ ). Start-ups that grew more in in the past are assumed to have more growth opportunities in the future (Scherr & Hulburt, 2001). Size, ( ), is defined by the natural logarithm of start-up’s initial number of employees. In terms of debt to maturity structure, namely banks, ( ) measured as the debt levels that firms maintain with their banks. More specifically, our variable is calculated as the ratio of short-term bank debt to total assets; and the ratio of long-term bank debt to total assets, that is the proxy to evaluate the relationships with financial institutions, ( ).
13
19
In line with the previous work of Opler et al. (1999), Ferreira & Vilela (2004) and Ozkan & Ozkan (2004), we calculate the ratio of working capital less cash to total assets, in order to measure the existence of other liquid assets ( ) that may be used as substitutes for cash.
Our model also included the founder’s characteristics, namely: Gender, measured as a dummy variable equaling one for men and zero for women; founder´s age, defined with four categorical variables: Age 20-29 is coded one for individuals with age between 20 and 29; Age 30-39 is coded one for individuals with age between 30 and 39; Age 40-49 is coded one for individuals with age between 40 and 49; Age 50-60 is coded one for individuals with age between 50 and 60; founder’s education, measured with four categorical variables: higheducation is a dummy variable equaling one for founders with bachelors, masters or doctoral degrees; mediumeducation is a dummy variable equaling one for individuals reporting a high school diploma or vocational school degree; loweducation is a dummy variable equaling one for individuals that attended junior high school; and veryloweducation is a dummy variable equaling one for individuals who never attended or completed the elementary school; founder’s nationality, measured as a dummy variable equaling one for Portuguese founder’s and zero for foreigner founder’s; founder’s industrial experience, measured as a dummy variable equaling one for founder’s with experience within the same industry and zero for founder’s without experience; and founder’s entrepreneurial experience, measured as a dummy variable equaling one for founder’s with experience on start-up’s creation and zero for founder’s without experience.
20
For the correlations matrix, Table A 3, when analyzing the correlations between explanatory variables and cash, is possible to see that liquid assets and bank debt are highly correlated with cash holding levels of start-ups.
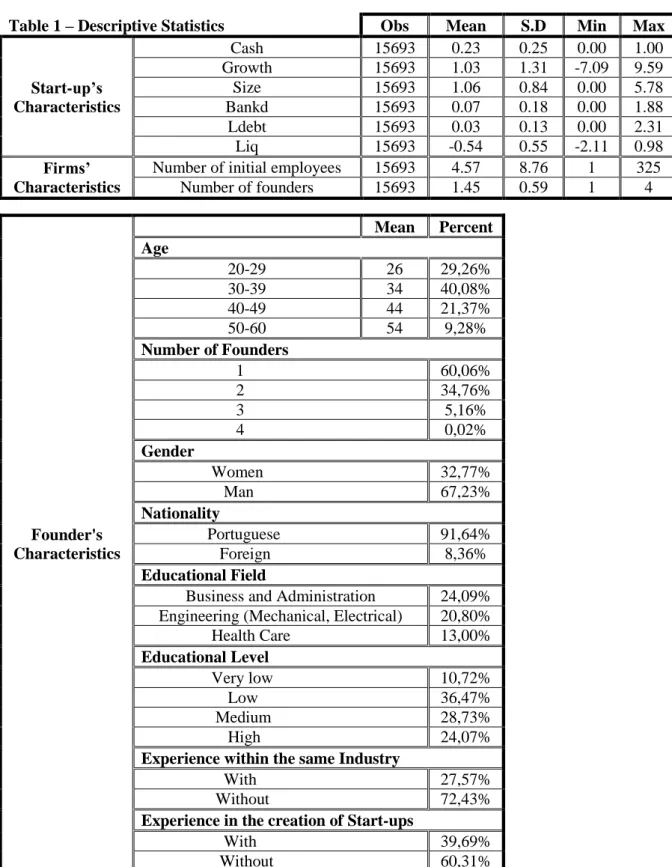
Table 1 – Descriptive Statistics Obs Mean S.D Min Max
Start-up’s Characteristics Cash 15693 0.23 0.25 0.00 1.00 Growth 15693 1.03 1.31 -7.09 9.59 Size 15693 1.06 0.84 0.00 5.78 Bankd 15693 0.07 0.18 0.00 1.88 Ldebt 15693 0.03 0.13 0.00 2.31 Liq 15693 -0.54 0.55 -2.11 0.98 Firms’ Characteristics
Number of initial employees 15693 4.57 8.76 1 325
Number of founders 15693 1.45 0.59 1 4 Founder's Characteristics Mean Percent Age 20-29 26 29,26% 30-39 34 40,08% 40-49 44 21,37% 50-60 54 9,28% Number of Founders 1 60,06% 2 34,76% 3 5,16% 4 0,02% Gender Women 32,77% Man 67,23% Nationality Portuguese 91,64% Foreign 8,36% Educational Field
Business and Administration 24,09% Engineering (Mechanical, Electrical) 20,80% Health Care 13,00% Educational Level Very low 10,72% Low 36,47% Medium 28,73% High 24,07%
Experience within the same Industry
With 27,57% Without 72,43%
Experience in the creation of Start-ups
With 39,69% Without 60,31%
21
Table 1 summarizes the descriptive statistics of our sample. For start-ups characteristics we have that these firms hold in cash an average percentage of 23% of the total assets, growing annually 103%, when compared to homologous period, in terms of start-ups’ size, these firms have on average 1,06 of the initial number of employees. In terms of liquid assets substitutes, once these are substitutes of cash, they present a negative average once start-ups have more liabilities than receivables. Finally, for the debt structure, short-term debt represents on average 7% of the total assets and long-debt represents 3% of start-up’s total assets.
The start-ups in our data are usually small, employing on average 4.57 individuals and are founded on average by one entrepreneur (60.06%). The founders are mostly men (67.23%). The majority of founders are aged between 30 and 39, 40.08%; 29.26% are aged between 20 and 29; 21.37% are aged between 40 and 49 and the remaining 9.28% are aged between 50 and 60. Also, 91.64% of founders have Portuguese nationality and the remaining 8.36% are foreign. Regarding the field of education, 24.09% of founders are from the business and administration area; 20.80% are from engineering; 13% are from healthcare and the remaining 42.11% are spread across multiple education areas. In terms of educational level, 36.47% have low education; 28.73% have a medium education; 24.07% have a higher education and 10.72% have a very lower education. Finally, 72.43% of founders have no previous working experience in the same industry and 60.31% of founders have no previous experience in start-up’s creation.
22
5. EMPIRICAL METHODOLOGY AND RESULTS
In order to test the effects of cash holding determinants over the start-ups cash holding we conduct a Tobit model, controlling for variables such as founder and start-ups’ characteristics and industry, reference year and NUTS as fixed effects.
The Tobit model, is one type of model used when our dependent variable is continuous and positive, assuming for a considerable part of our sample the null value. Let the dependent variable ( ), essentially continuous over strictly positive values, but that takes on zero with positive probability.
The Tobit model is used in our equation, where in order to obtain consistent estimators is important that the dependent variable satisfies the classical linear model assumptions; in particular, it has a normal, homoskedastic distribution with a linear conditional mean. If this situation is not observed, Tobit estimates the parameters in order to guarantee the desired properties, through the robust test.
In order to comprehend and compare the parameters of individual statistical significance of our parameters it can be used the t Statistic.
Therefore, in order to evaluate the determinants of cash-holdings for a start-up we use the following equation:
(1)
23
The explanatory variables and the founders characteristics variables are describe on the previous section.
In terms of fixed effects, we have year dummy ( ), defined with six categorical variables from 2004 to 2009, measured as a dummy variable equaling one for the reference year and zero for the other years; industrial dummy ( ), defined with fifty one categorical variables, following the CAE Rev. 2.1 and measured as a dummy variable equaling one for the respective industry code and zero for the others; NUTS dummy ( ), defined with seven categorical variables, following the second level of the Nomenclatura das Unidades Territoriais para Fins Estatísticos and measured as a dummy variable equaling one for the respective territorial unit code and zero for the others; measures of constant term; the measures the unobservable heterogeneity of the individual specific effects of each firm and is the disturbance term.
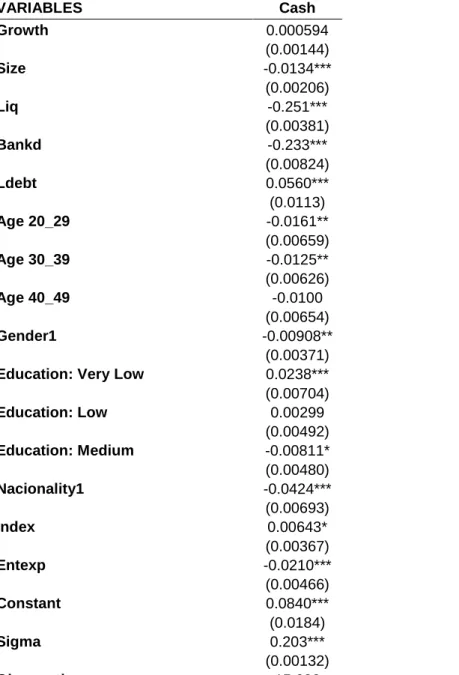
As presented in Table 2, the results of regression analysis present a positive relationship with investment opportunities and cash holding, but not statistically significant, hence we do not reject our Hypothesis 1. Growth increases the level of cash holding of start-ups because start-start-ups with more investment opportunities have more incentives to avoid financial distress and bankruptcy, holding more cash and marketable securities, (Kim, et al. 1998; Opler, et al. 1999; Ozkan & Ozkan 2004). For the firm’s size, our estimates are significant at one percent level and lead us to reject the Hypothesis 2. The relationship between size and star-ups cash holding supports the trade-off theory, showing that an increase on the number of initial employees leads to a decrease of 1.34% of cash holding level, this relationship may result from economies of scale associated with maintaining the cash level required for the normal transactions of the
24
firm, but also because large firms suffer less information asymmetry and difficulty in accessing external financing (Daher, 2010).
Table 2 – The Impact of Start-ups’ Determinants on Cash Holding (Tobit)
VARIABLES Cash Growth 0.000594 (0.00144) Size -0.0134*** (0.00206) Liq -0.251*** (0.00381) Bankd -0.233*** (0.00824) Ldebt 0.0560*** (0.0113) Age 20_29 -0.0161** (0.00659) Age 30_39 -0.0125** (0.00626) Age 40_49 -0.0100 (0.00654) Gender1 -0.00908** (0.00371)
Education: Very Low 0.0238***
(0.00704) Education: Low 0.00299 (0.00492) Education: Medium -0.00811* (0.00480) Nacionality1 -0.0424*** (0.00693) Index 0.00643* (0.00367) Entexp -0.0210*** (0.00466) Constant 0.0840*** (0.0184) Sigma 0.203*** (0.00132) Observations 15,693
This table uses data on the start-ups established between 2004 and 2009, retrieved from the database Quadros de Pessoal(QP).The Tobit Model with Fixed Effects (FE) is used. The dependent variable is “CASH”, which is a proxy to cash holdings. The variable “GROWTH” is defined by the investment opportunities, “SIZE” is the natural logarithm of the initial numbers of employees, “LIQ” is the liquid asset substitutes, “BANKD” is the short-term debt ratio and “LDEBT” is the long-term debt ratio. The dummy variables “Gender”, “Education”, “Age 20-29”, “Age 30-39”, “Age 40-49”, “Nationality” and “Entrepreneurial experience” are control variables for founder and firm characteristics. Some dummy variables are omitted in order to avoid problems of colliniarity. The dummy variable “Nationality” is defined according to the nationality of the founder. The dummy variable “Industrial experience” is defined according to the fact that the founder is industrial experimented. The dummy variable “Entrepreneurial experience” is defined according to the fact that the founder is an entrepreneur. Robust standard errors are in parentheses. ***denotes statistical significance at 1%, **significance at 5%, *significance at 10%.
25
On the other hand, these results contradict the pecking order theory and the free cash flow theory, as reported by (Williamson 1988; Pinkowitz & Williamson 2001; Ferreira & Vilela 2004). For the liquid assets substitutes the relationship is statistically significant at 1%, existing a negative relationship where an increase of 1% in liquid assets leads to a decrease of 25.1% on cash holding levels. Hence we do not reject Hypothesis 3, once start-ups hold more cash, being liquid assets considered to be cash substitutes, being quickly liquidated in events of cash shortage. The debt structure, short-term bank loans ( ) is statistically significant at 1% level, being the relationship between the two variables negative, therefore, an increase of 1% on short-term bank loans leads to a decrease in 23.3% of cash holding levels. Hence we reject the Hypothesis 4a. This indicates that maintaining a banking relationship improves access to this type of external financing by reducing the information asymmetry between borrower and lender. This supports the Trade-off Theory and shows that firms that are more highly indebted to credit institutions can reduce their investments in liquid financial assets.
For the long-term debt (LDEBT) this variable is statistically significant at 1% level, being the relationship positive, which leads to an increase of 5.6% on cash levels for each 1% increase of long-term debt. Thus, we do not reject the Hypothesis 4b. The relationship between the debt maturity structure of the SMEs and their level of cash holdings is consistent with the empirical findings of Ferreira and Vilela (2004) and the hypothesis of the Trade-off Theory, according to which the firms with a shorter debt maturity structure would keep higher cash levels in order to reduce the risk deriving from the nonrenewal of their short-term debt and to reduce the costs associated with
26
dependence on external financing, given the higher information asymmetry of SMEs with more short-term debt.
Finally, the last hypothesis is related to founder social-demographic and educational characteristics. Starting with founder’s gender, this is significant at 5% level, showing that women hold 0.908% less cash than men. In terms of education, we find that relatively to founders with high-education, founders with very low educational levels hold more cash, respectively 2.38%. On the other hand, founders with medium educational level hold less cash, about 0.811% compared to founders with high-education. Only the variable founders with low educational level is not significant, presenting a positive relationship with cash holding level. For age, we can see that the variable age40_49 is not significant, the variable age20_29 and age30_39 are significant at a 5% level, suggesting that the younger the founder the less cash he holds. For the nationality it is significant at 1% level, showing that the Portuguese founders hold less cash when compared to non-Portuguese founders due to the negative relationship between nationality and cash. Finally in terms of experience, industry experience is significant at 10% level showing that founder with industrial experience hold more cash, thus for 1% of industry experience, cash holdings increase 0.643%, for the entrepreneurs experience, it is significant at 1% level, showing that founders with entrepreneur experience hold less cash, thus for an increase of 1% in our variable, cash holding level decreases 2.10%. Therefore we can conclude that we do not reject Hypothesis 5.
In addition to this analysis and in order to comprehend the importance of holding cash across the territorial statistical units of Portugal we use the Nomeclatura das Unidades Territoriais (NUTS II), that covers the North and Center Regions, Lisbon, Alentejo,
27
Algarve and the Autonomous Regions of Madeira and Azores as it is possible to see on the Table 3.
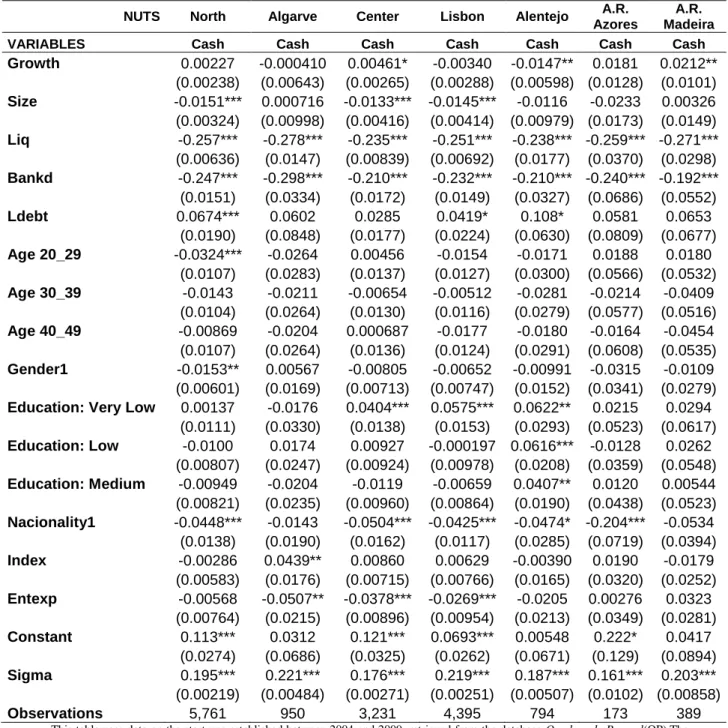
Therefore analyzing the cash holding levels through our model across NUTS, it is possible to see that most of our coefficients are not statistically significant. Starting with firm’s growth, this is positive for North, Center and Autonomous Region of Azores, on the contrary, for Algarve, Lisbon and Alentejo and Autonomous Region of Madeira there is a negative effect which indicates that, in these regions, firms with more investment opportunities will hold less cash. For firm’s size, there is a negative relationship with the cash holding levels across the entire country, except in Algarve and Autonomous Region of Madeira, suggesting that the larger the firm the lesser will be the cash holding level.
For the short-term debt, it presents a negative relationship with start-ups’ cash holding levels across all regions, being all the variables statistically significant at 1% level; otherwise, for the long-term debt, all regions present a positive relationship, besides not statistically significant, once firms with a shorter debt maturity structure keep higher cash levels in order to reduce the risk deriving from the nonrenewal of short-term debt and to reduce the costs associated with dependence on external financing, given the higher information asymmetry of SMEs with more short-term debt. On the other hand, liquid assets substitutes are negatively related, as expected, with the cash holding levels of firms in all regions and statistically significant at 1% level once liquid assets are seen as cash substitutes in events of cash shortage.
28
Table 3 – The Impact of Start-ups’ Determinants and Firms’ Characteristics on Cash Holding per NUTS (Tobit)
NUTS North Algarve Center Lisbon Alentejo A.R.
Azores
A.R. Madeira
VARIABLES Cash Cash Cash Cash Cash Cash Cash
Growth 0.00227 -0.000410 0.00461* -0.00340 -0.0147** 0.0181 0.0212** (0.00238) (0.00643) (0.00265) (0.00288) (0.00598) (0.0128) (0.0101) Size -0.0151*** 0.000716 -0.0133*** -0.0145*** -0.0116 -0.0233 0.00326 (0.00324) (0.00998) (0.00416) (0.00414) (0.00979) (0.0173) (0.0149) Liq -0.257*** -0.278*** -0.235*** -0.251*** -0.238*** -0.259*** -0.271*** (0.00636) (0.0147) (0.00839) (0.00692) (0.0177) (0.0370) (0.0298) Bankd -0.247*** -0.298*** -0.210*** -0.232*** -0.210*** -0.240*** -0.192*** (0.0151) (0.0334) (0.0172) (0.0149) (0.0327) (0.0686) (0.0552) Ldebt 0.0674*** 0.0602 0.0285 0.0419* 0.108* 0.0581 0.0653 (0.0190) (0.0848) (0.0177) (0.0224) (0.0630) (0.0809) (0.0677) Age 20_29 -0.0324*** -0.0264 0.00456 -0.0154 -0.0171 0.0188 0.0180 (0.0107) (0.0283) (0.0137) (0.0127) (0.0300) (0.0566) (0.0532) Age 30_39 -0.0143 -0.0211 -0.00654 -0.00512 -0.0281 -0.0214 -0.0409 (0.0104) (0.0264) (0.0130) (0.0116) (0.0279) (0.0577) (0.0516) Age 40_49 -0.00869 -0.0204 0.000687 -0.0177 -0.0180 -0.0164 -0.0454 (0.0107) (0.0264) (0.0136) (0.0124) (0.0291) (0.0608) (0.0535) Gender1 -0.0153** 0.00567 -0.00805 -0.00652 -0.00991 -0.0315 -0.0109 (0.00601) (0.0169) (0.00713) (0.00747) (0.0152) (0.0341) (0.0279) Education: Very Low 0.00137 -0.0176 0.0404*** 0.0575*** 0.0622** 0.0215 0.0294
(0.0111) (0.0330) (0.0138) (0.0153) (0.0293) (0.0523) (0.0617) Education: Low -0.0100 0.0174 0.00927 -0.000197 0.0616*** -0.0128 0.0262 (0.00807) (0.0247) (0.00924) (0.00978) (0.0208) (0.0359) (0.0548) Education: Medium -0.00949 -0.0204 -0.0119 -0.00659 0.0407** 0.0120 0.00544 (0.00821) (0.0235) (0.00960) (0.00864) (0.0190) (0.0438) (0.0523) Nacionality1 -0.0448*** -0.0143 -0.0504*** -0.0425*** -0.0474* -0.204*** -0.0534 (0.0138) (0.0190) (0.0162) (0.0117) (0.0285) (0.0719) (0.0394) Index -0.00286 0.0439** 0.00860 0.00629 -0.00390 0.0190 -0.0179 (0.00583) (0.0176) (0.00715) (0.00766) (0.0165) (0.0320) (0.0252) Entexp -0.00568 -0.0507** -0.0378*** -0.0269*** -0.0205 0.00276 0.0323 (0.00764) (0.0215) (0.00896) (0.00954) (0.0213) (0.0349) (0.0281) Constant 0.113*** 0.0312 0.121*** 0.0693*** 0.00548 0.222* 0.0417 (0.0274) (0.0686) (0.0325) (0.0262) (0.0671) (0.129) (0.0894) Sigma 0.195*** 0.221*** 0.176*** 0.219*** 0.187*** 0.161*** 0.203*** (0.00219) (0.00484) (0.00271) (0.00251) (0.00507) (0.0102) (0.00858) Observations 5,761 950 3,231 4,395 794 173 389
This table uses data on the start-ups established between 2004 and 2009, retrieved from the database Quadros de Pessoal(QP).The Tobit Model with fixed effects is used. The dependent variable is “CASH”, which is a proxy to cash holdings. The control variables are dummies: “year” and “industry”. The variable “GROWTH” is defined by the investment opportunities, “SIZE” is the natural logarithm of the initial numbers of employees, “LIQ” is the liquid asset substitutes, “BANKD” is the short-term debt ratio and “LDEBT” is the long-term debt ratio. The dummy variables “Gender”, “Education”, “Age 20-29”, “Age 30-39”, “Age 40-49”, “Nationality”, “Industrial experience” and “Entrepreneurial experience” are variables for founder and firm characteristics. Some dummy variables are omitted in order to avoid problems of perfect collinearity. The dummy variable “Nationality” is defined according to the nationality of the founder. The dummy variable “Entrepreneurial experience” is defined according to the fact that the founder is an entrepreneur. To North Region coded 11 with observations between 2004 and 2009, to Algarve we have the code 15, with observations from 2004 to 2007, to Center Region the code 16 with observations from 2004 to 2008, to Lisbon the code is 17 with observations from 2004 to 2008, Alentejo coded 18, with observations from 2004 to 2007, to Autonomous Region of Azores is coded 20 with observations from 2004 to 2008 and to Autonomous Region of Madeira, coded 30, with observations from 2004 to 2008. Robust standard errors are in parentheses. ***denotes statistical significance at 1%, **significance at 5%, *significance at 10%.
29
Moreover, also the founder’s characteristics were analyzed, being possible to notice some patterns across regions. Starting with gender, is only statistically significant and negative for the North region, it is possible to observe that only in Algarve women hold more cash compared to the opposite gender.
For the educational level, founders with low levels of education hold more cash than those with a higher educational level, this is observable in Alentejo that is statistically significant at 1% level. Founders with very low levels of education is statistically significant at 1% level for Center and Lisbon, and 5% level for Alentejo, presenting a positive relationship, therefore, founders hold more cash compared to founders with a higher educational level; for founders with a medium educational level these hold more cash compared to founder with higher educational levels, for Alentejo, Autonomous Region of Madeira and Azores.
Analyzing founders’ age, founders with a comprehended age between 20 and 29 hold less cash than the older founders (50 to 60 years old), except in Center, Autonomous Region of Madeira and Azores, being statistically significant only for the North region. For founders with age between 30 and 49 years all regions present a negative relationship, besides, none of them are statistically significant. Finally, for founder’s nationality, these are negatively related with start-ups cash holding levels, being this relationship statistically significant for North, Center, Lisbon, Alentejo and Autonomous Region of Madeira. For the industry experience, is statistically significant only at a 5% level in the center region; for the founders with entrepreneur experience we found a negative relationship with cash holdings statistically significant at 1% level for Center and Lisbon, and 5% for Algarve.
30
Finally, when testing for the impact of start-up’s and founders socio-demographic and educational characteristics on start-ups for the most important industries, in order to comprehend how industries deal with cash levels and identify the existence of standards across industries.
When analyzing the relationship between our independent and control variables and cash holding levels of start-ups across industries it becomes possible to compare patterns across industries, as it is possible to see on Table 4.
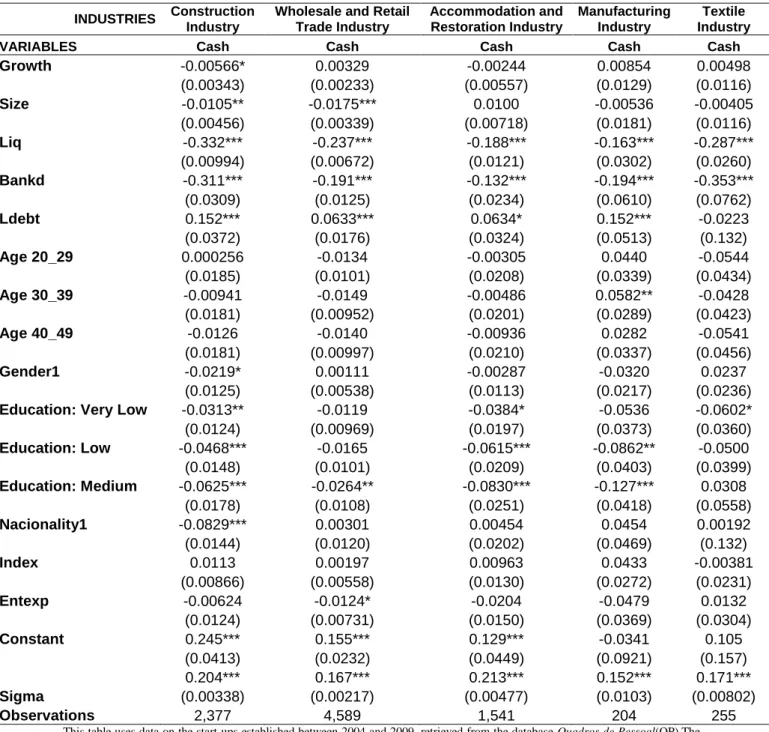
Starting with the investment opportunities, the Construction Industry presents a negative relationship, statistically significant at a 10% level; also the Accommodation and Restoration presents a negative relationship. For the other industries, is possible to see a positive but no significant relationship. For the size, we identify a negative relationship with cash holding levels for the industries of Construction, Wholesale and Retail Trade, Manufacturing and Textile, being statistically significant only for the first two industries. In terms of liquid assets substitutes, all industries in our sample present a negative relationship with cash holding levels. Therefore, for all these industries, liquid assets are seen as substitutes for cash, this variable is statistically significant for all industries at 1% level. Looking now for the debt maturity structure of industries, for the short-term debt there is a negative and statistically significant relationship with cash holding levels, on the other hand, the long-term debt is positively related and statistically significant with cash holding levels for all industries. For the founder´s socio-demographic and educational characteristics, starting with the gender, this variable is statistically significant, at a 10% level, only for the construction industry which presents a negative relationship with cash holding levels, showing that women hold less cash than men. Looking for founder´s age, only founder with comprehended
31
age between 30 and 39 have a positive and significant relationship for the manufacturing industry.
Table 4 – The Impact of Start-ups’ Determinants and Firms’ Characteristics on Cash Holding per Industries (Tobit)
INDUSTRIES Construction Industry
Wholesale and Retail Trade Industry Accommodation and Restoration Industry Manufacturing Industry Textile Industry
VARIABLES Cash Cash Cash Cash Cash
Growth -0.00566* 0.00329 -0.00244 0.00854 0.00498 (0.00343) (0.00233) (0.00557) (0.0129) (0.0116) Size -0.0105** -0.0175*** 0.0100 -0.00536 -0.00405 (0.00456) (0.00339) (0.00718) (0.0181) (0.0116) Liq -0.332*** -0.237*** -0.188*** -0.163*** -0.287*** (0.00994) (0.00672) (0.0121) (0.0302) (0.0260) Bankd -0.311*** -0.191*** -0.132*** -0.194*** -0.353*** (0.0309) (0.0125) (0.0234) (0.0610) (0.0762) Ldebt 0.152*** 0.0633*** 0.0634* 0.152*** -0.0223 (0.0372) (0.0176) (0.0324) (0.0513) (0.132) Age 20_29 0.000256 -0.0134 -0.00305 0.0440 -0.0544 (0.0185) (0.0101) (0.0208) (0.0339) (0.0434) Age 30_39 -0.00941 -0.0149 -0.00486 0.0582** -0.0428 (0.0181) (0.00952) (0.0201) (0.0289) (0.0423) Age 40_49 -0.0126 -0.0140 -0.00936 0.0282 -0.0541 (0.0181) (0.00997) (0.0210) (0.0337) (0.0456) Gender1 -0.0219* 0.00111 -0.00287 -0.0320 0.0237 (0.0125) (0.00538) (0.0113) (0.0217) (0.0236)
Education: Very Low -0.0313** -0.0119 -0.0384* -0.0536 -0.0602*
(0.0124) (0.00969) (0.0197) (0.0373) (0.0360) Education: Low -0.0468*** -0.0165 -0.0615*** -0.0862** -0.0500 (0.0148) (0.0101) (0.0209) (0.0403) (0.0399) Education: Medium -0.0625*** -0.0264** -0.0830*** -0.127*** 0.0308 (0.0178) (0.0108) (0.0251) (0.0418) (0.0558) Nacionality1 -0.0829*** 0.00301 0.00454 0.0454 0.00192 (0.0144) (0.0120) (0.0202) (0.0469) (0.132) Index 0.0113 0.00197 0.00963 0.0433 -0.00381 (0.00866) (0.00558) (0.0130) (0.0272) (0.0231) Entexp -0.00624 -0.0124* -0.0204 -0.0479 0.0132 (0.0124) (0.00731) (0.0150) (0.0369) (0.0304) Constant 0.245*** 0.155*** 0.129*** -0.0341 0.105 (0.0413) (0.0232) (0.0449) (0.0921) (0.157) 0.204*** 0.167*** 0.213*** 0.152*** 0.171*** Sigma (0.00338) (0.00217) (0.00477) (0.0103) (0.00802) Observations 2,377 4,589 1,541 204 255
This table uses data on the start-ups established between 2004 and 2009, retrieved from the database Quadros de Pessoal(QP).The Tobit Model with fixed effects is used. The dependent variable is “CASH”, which is a proxy to cash holdings. The control variables are dummies: “year” and “industry”. The variable “GROWTH” is defined by the investment opportunities, “SIZE” is the natural logarithm of the initial numbers of employees, “LIQ” is the liquid asset substitutes, “BANKD” is the short-term debt ratio and “LDEBT” is the long-term debt ratio. The dummy variables “Gender”, “Education”, “Age 20-29”, “Age 30-39”, “Age 40-49”, “Nationality”, “Industrial experience” and “Entrepreneurial experience” are variables for founder and firm characteristics. Some dummy variables are omitted in order to avoid problems of perfect collinearity. The dummy variable “Nationality” is defined according to the nationality of the founder. The dummy variable “Entrepreneurial experience” is defined according to the fact that the founder is an entrepreneur. To Construction Industry coded 45 with observations between 2004 and 2008, to Wholesale and Retail Trade Industry we have the code 50 to 52, with observations from 2004 to 2008, Accommodation and Restoration Industry to the code 55 with observations from 2004 to 2008, to Manufacturing Industry the code is 15 with observations from 2004 to 2007,
32
Textile Industry coded 17 and 18, with observations from 2004 to 2007. Robust standard errors are in parentheses. ***denotes statistical significance at 1%, **significance at 5%, *significance at 10%.
In terms of education, this characteristic is relevant for industries of Construction, Accommodation and Restoration, and Manufacturing having founders with very low, low and medium levels a statistically significant and negative relationship with cash holding levels, compared with founders with high levels of education. For the nationality of founders, this variables is only statistically significant and negative within the construction industry, being positive for the other industries but with no significant coefficients. Finally, for industry experience there is a positive relationship but not statistically significant for all industries, except textile industry; for founder’s entrepreneur experience, this is only statistically significant for the Wholesale and Retail industry, having a negative relationship with cash holding levels. Therefore, we may conclude that size has a negative relationship with cash holdings across the majority of industries, that liquid assets and debt maturity structure of start-ups have also the same, negative, relationship with cash holding for all industries. For founders’ characteristics, age has no significant impact on cash holding levels across industries; on the other hand, educational levels below the higher level of education have a negative impact over start-ups cash holding levels.