U
NIVERSIDADE DEL
ISBOAF
ACULDADE DEC
IÊNCIASDepartamento de Biologia Animal
D
OES HOST
LDL
RECEPTOR CONTRIBUTE TO TUMOR
PROGRESSION
?
Mestrado em Biologia Evolutiva e do Desenvolvimento
Vanessa Carina Silva Cesário
Dissertação orientada por:
Professor Doutor Sérgio Dias (orientador externo) e
Professora Doutora Maria Gabriela Rodrigues (orientadora interna)
i
Agradecimentos
A realização deste trabalho nunca teria sido possível sem a ajuda das seguintes pessoas:
Professor Doutor Sérgio Dias, por ter aceite ser o meu orientador externo e ter-me possibilitado integrar durante um ano no seu grupo de investigação para desenvolver a minha Tese de Mestrado. Agradeço-lhe por ter me ter permitido enriquecer a minha formação científica e por me ter motivado ao longo de todo o ano a tentar fazer mais e melhor.
Doutora Ana Magalhães, pela paciência, pela dedicação, por todo o esforço e tempo que me dedicou para me ensinar todas as técnicas que realizei ao longo deste ano, e por toda a força que me transmitiu nas horas mais difíceis, o meu especial agradecimento.
Doutora Germana Domingues por toda a motivação, carinho e por ter acreditado no meu potencial.
Carolina Santos, Inês Martins e Joana Rodrigues, por terem sido as companheiras diárias durante um ano inteiro e por todos os bons momentos que passámos juntas. A todos os restantes membros do laboratório (Sandrina Pereira, Neidy Rodrigues, Hélia Neves e Tânia Carvalho) por toda a disponibilidade, ajuda e conhecimento que me foram transmitindo durante este ano.
Um obrigada aos meus amigos, em especial a Fátima Cardoso, Fábio Mendes, Joana Ribeiro, Marta Menana e Vanessa Rosa, por me terem dado a força para continuar quando tudo parecia estar virado do avesso, por me transmitirem a confiança que precisava, por acreditarem em mim.
Á minha família, por acreditarem sempre que eu conseguiria atingir os meus objectivos e demonstrarem todo o orgulho que têm em mim. Um obrigada especial ao meu primo Paulo Portela, por ser o meu exemplo a seguir e ao meu namorado Tiago Lopes, por toda a compreensão e apoio.
Finalmente, aos meus pais, porque são os pilares da minha vida e sem eles nada disto teria sido possível. Aos meus avós, porque lhes devo tudo o que hoje sou. Obrigada por tudo.
ii
INDEX
Agradecimentos….……….………..…i Index……….….ii Index of Figures………..………...iv Index of Tables………iv Abbreviations……….…….v Resumo……….….viiPalavras Chave………. ………viii
Abstract………ix Key Words……….ix Introduction………1 1. Cancer Development……….…………2 1.1 Carcinogenesis Process………...2 1.2 Tumor Microenvironment………..………..4 2. Angiogenesis……….……….6 2.1 Tumor Angiogenesis……….………..…….6 2.2 Angiogenesis in Melanoma………..……….……….7
2.3 Melanoma Vascular Mimicry……….………..….8
3. Melanoma……….………10
3.1 Melanoma Development………10
3.2 Melanoma Microenvironment………11
4. Extrinsic Factors: Cholesterol and Cancer……….………..…..12
Material and Methods……….15
Cell lines……….16
Animal Models………..………16
iii
Cell Proliferation Assay………..16
Vasculogenic Network Formation In Vitro (Matrigel Assay)……….……..17
Antibodies………....……..17
AR Pretreatment……….………18
Immunofluorescence……….………….18
Immunohistochemistry………..………19
Vasculogenic Mimicry, Mosaic and Endothelial Vessel Quantification…………..19
Microscopy imaging……….……20
RNA Extraction……….………20
cDNA Synthesis Protocol………..…...21
Quantitative PCR (qPCR) for mRNA quantification……….……..21
Statistical Analysis………....22
Aims……….……….23
Aims………..24
Results……….25
Melanoma Growth in LDLR KO mice………..……….26
Tumor Cell Proliferation in LDLR KO mice……….……26
Effect of LDL on melanoma cell proliferation………27
Tumor vascular density in LDLR KO mice………..……28
In Vitro Tube Formation Assay……….…………32
Discussion……….………35 Discussion……….……..36 References………..………40 References ……….41 Supplementary Information………45 Supplementary Information………46
iv
Index of Figures
Figure 1. Fundamental Properties of Tumor Cells……….….2
Figure 2. From transformed cell to metastatic tumor……….….……3
Figure 3. Radial and vertical growth phase during Melanoma progression…...11
Figure 4. Low-density lipoprotein (LDL) composition……….13
Figure 5. Tumor volume in wild-type and LDLR knockout mice: Melanoma model..…..26
Figure 6.Quantification of tumor cell proliferation by Ki67 in Melanoma tumors……...27
Figure 7. B16F0 proliferation was not affected by LDL-cholesterol……….……...27
Figure 8. LDLR expression on B16F0 cells and it’s regulation by LDL……….……....28
Figure 9. Endothelial Blood Vessels in Melanoma………..…….29
Figure 10. Different Patterns of Tumor Blood Supply in Melanoma………..…31
Figure 11. Three types of tumor blood supply in Melanoma……….…. 32
Figure 12. In vitro tube formation………33
Figure 13. The presence of LDL-cholesterol did not affect HUVECS and B16F0 tube formation……….….33
Index of Tables (Supplementary Information)
Table S1. Sequences of mouse and human primers used in qPCR……….……….…46Table S2. Scheme of different patterns of tumor blood supply verified in Melanoma tumors……….……46
v
Abbreviations
Apo-B100 Apolipoprotein B100
AA Antibiotic-antimycotic
bFGF Basic Fibroblast Growth Factor
BSA Bovine Serum Albumin
CO2 Carbone Dioxide
CSF-1 Colony Stimulating Factor 1
cDNA Complementar Desoxiribonucleic Acid
dNTP’s Deoxynucleotides
DEPC water Diethylpyrocarbonate water
DMEM Dulbecco’s Modified Eagle Medium
EBM-2 Endothelial cell basal medium-2
EGF Epidermal Growth Factor
FBS Fetal Bovine Serum
FGF-2 Fibroblast Growth Factor 2
HMG-CoA reductase 3-hidroxi-3-methyl-glutaril-CoA redutase
HDL High-density Lipoprotein
HUVECS Human Umbilical Vein Endothelial Cells
IMM Instituto de Medicina Molecular
LDL Low-density Lipoprotein
LDLR Low-density Lipoprotein Receptor
LDLR KO Low-density Lipoprotein Receptor Knockout
LDLR WT Low-density Lipoprotein Receptor Wild-type
mRNA Messenger ribonucleic acid
nTC non Template Control
NaCl Sodium Chloride
PAS Periodic Acid-Shiff
PBS Phosphate Buffered Saline
PDGF Platelet Derived Growth Factor
qPCR Quantitative Polymerase Chain Reaction
vi
RNA Ribonucleic Acid
TGF-β Transforming Growth Factor – Beta
TAM’s Tumor-associated macrophages
UV radiation Ultraviolet radiation
VEGF Vascular Endothelial Growth Factor
VEGF-A Vascular Endothelial Growth Factor A
vii
Resumo
O cancro é uma das principais causa de morte em todo o mundo e sabe-se que cada vez mais factores extrínsecos, como a dieta, podem afectar o seu desenvolvimento. Diversos estudos têm demonstrado que as células tumorais aumentam as suas necessidades de colesterol para a síntese de novas membranas, pensando-se que este seja um factor que facilite a proliferação deste tipo de células.
Do ponto de viste epidemiológico, foram já identificadas associações causais entre níveis sistémicos de colesterol e desenvolvimento (incidência) de cancro, nomeadamente de cancro da mama. No nosso laboratório foi inclusivé demonstrado que a estimulação in vitro de células de cancro da mama com a lipoproteina de baixa densidade (do inglês, low-density lipoprotein - LDL) levava a um aumento da proliferação celular, diminuição da adesão e aquisição de um fenótipo mesenquimatoso, associado a um aumento de capacidade migratória das células tumorais.
No presente projecto pretendemos avaliar de que forma a ausência do receptor do LDL nas células do microambiente tumoral poderia afectar a progressão tumoral. Neste sentido, optámos por utilizar um modelo genético, ao contrário da maioria dos estudos em que são utilizadas dietas ricas em colesterol para aumentar os níveis deste em circulação. O ratinho knock-out para o receptor do LDL (criado em 1993) permite-nos avaliar se é especificamente o colesterol transportado pelo LDL e a interação deste com o receptor (LDLR) que é capaz de potenciar uma maior progressão tumoral. É de salientar que estes ratinhos já apresentam elevados níveis de LDL em circulação, não sendo necessário utilizar uma dieta rica em colesterol para que estes níveis sejam aumentados. Neste projecto, o desenho experimental baseia-se na introdução de células tumorais de melanoma positivas para o receptor do LDL em ratinhos também eles positivos para o receptor, mas também em ratinhos LDLR knockout. Através deste modelo experimental, podemos verificar se o receptor nas células do microambiente tumoral é crucial para o desenvolvimento e progressão tumorais.
Este trabalho permitiu ainda avaliar a importância de um receptor de colesterol nas células no microambiente tumoral. Em particular na formação de vasos sanguíneos, verificámos que apesar de não existirem diferenças no número de vasos
viii
endoteliais, normalmente formados através do clássico processo angiogénico já largamente descrito na literatura, existiam diferenças quanto ao número de canais que também fazem o aporte sanguíneo aos tumores, e que são formados pelas próprias células tumorais intercaladas com as células endoteliais. Este tipo de canais é descrito na literatura como “Mimetismo Vascular”, mais específicamente como Vasos Mosaico ou Mosaicismo Vascular.
Relativamente à influência que o colesterol transportado pelo LDL possa ter sobre as células tumorais, apenas verificamos aumentos nas taxas proliferativas in
vivo, não conseguindo demonstrar um efeito directo do colesterol sobre as células de
melanoma, in vitro.
Tendo em conta os resultados obtidos neste estudo, podemos concluir que elevados níveis de LDL em circulação potenciam uma maior progressão tumoral num ambiente cujas células são negativas para o receptor que faz a remoção dessa lipoproteina da circulação. Para além disso, constatámos também que num ambiente sem LDLR, e havendo excesso de LDL em circulação, surgem mais canais vasculares compostos por células endoteliais intercaladas com células tumorais (Vasos Mosaico).
Palavras-Chave
Melanoma; LDL-colesterol; LDL-receptor; Microambiente Tumoral, Mimetismo Vascular.
ix
Abstract
In this work, we investigated the role of host Low-Density Lipoprotein Receptor (LDLR) in the progression of Melanoma. By using an LDLR knockout mice model (with higher levels of Low-density lipoprotein (LDL) in circulation) and LDLR positive melanoma tumor cells, we tested if the absence of receptor in the tumor microenvironment has influence in tumor volume, vascular density or tumor cell proliferation. Paraffin or Frozen Tumor samples were used to perform immunohistochemistry and immunofluorescence analysis. We also performed in vitro experiments to see the behavior of melanoma tumor cells in he presence of elevated levels of LDL-cholesterol.
Our results showed that in the LDLR knockout mice tumors were bigger than in wild-type mice and there are also more tumor cell proliferation in these mice. However, in vitro, we could not demonstrate that LDL-cholesterol per se promotes melanoma cell proliferation.
We sought to explore the mechanisms by which cholesterol might favor melanoma progression; for this purpose we analysed the angiogenic phenotype of tumors grown on LDLR KO or wild type mice. Surprisingly, we didn’t find differences in the number of endothelial vessels between these two models. In contrast, we observed the presence of more mosaic vessels (tumor channels are composed by the intercalation of endothelial and tumor cells) and a small tendency for vascular mimicry (blood carrying channels formed by tumor cells only) occurrence in tumors from LDLR knockout mice. In conclusion, our study supports the idea that the absence of LDLR in the tumor microenvironment may enhance the formation of mosaic vessels and this way favor tumor growth.
Key Words
Melanoma; LDL-cholesterol; LDL-receptor; Tumor Microenvironment; Vascular Mimicry.
1
2
1. Cancer Development
1.1 Carcinogenesis Process
Cancer is one of the main causes of death around the world and no age group is immune to developing some type of cancer in their lifetime. In any part of the body, a normal cell can turn into an aberrant cell, proliferate in an uncontrolled manner and escape from cellular defence mechanisms[1]
Cancer development is a process that can be summarized into three steps: Initiation, Promotion and Progression. In the Initiation step, spontaneous or induced changes (the latter usually by a carcinogenic agent) can occur in somatic cells, causing mutations in the genome that may contribute towards cancer development. The Promotion phase is characterized by accumulating mutations and also by the interaction between cancer cells and intra and extracellular environmental factors that may change gene expression, resulting in enhanced cellular growth. In the last step of carcinogenesis – Progression – the aberrant cells proliferate faster, causing an increase of the tumor size. The malignant cell populations may accumulate other mutations that contribute to increase tumor cell heterogeneity.
Self-sufficient proliferation, evasion of apoptosis, unlimited ability to divide, insensitivity to anti-growth signals, the maintenance of angiogenesis and the capacity to invade tissues (metastasize) are the fundamental properties summarized by Hanahan and Weinberg, that are required for cancer development[1-4].
3
Tumor metastases (tumor cell growth at a site distant from the primary) are the main causes of death from cancer[1]. For metastasis to occur tumor cells need to escape the primary tumor and colonize the secondary site. This involves a complex series of cellular and molecular mechanisms that are starting to be revealed. To escape from the primary tumor, cancer cells lose their adhesion and invade the blood and/or lymphatic vessels (intravasation) to reach other organs, where they will eventually form secondary tumors[1]. To facilitate the intravasation process, tumor cells can secrete enzymes that degrade extracellular matrix, causing the movement of individual cells or of a small group of cells[3]. After this first step, circulating tumor cells need to survive (platelets have been suggested to play an important role in this process)[5,6] and at some point leave the circulation and exit through vessels (extravasation) to invade distant tissues. This will first creat micrometastases, that can afterwards progress into macroscopic lesions (‘colonization’)[4].
Figure 2: From transformed cell to metastatic tumor. (Adapted from Kim Y. et al, 2011)
As indicated above, tumor cells need to loose their adherence property to migrate for another sites of the body.
4
It has been shown that genes encoding cell-to-cell adhesion molecules are typically downregulated in some type of cancers while molecules associated with cell migration are upregulated[4].
1.2 Tumor Microenvironment
Depending on the location, cancer can be designated by different forms. Cancers that begins in bone, cartilage, muscle, or other connective or supportive tissue are designated by Sarcoma. Lymphoma and multiple myeloma, for instance, are cancers that affect cells from the immune system while central nervous system cancers generally develop in the brain or the spinal cord and melanoma is a cancer which arises in the skin, from melanocytes which are cells that derive from the neural crest[3].
It is now established that tumors are more than masses of proliferating cancer cells and it is known that environmental factors play an important role in the transition from normal into tumor cells[1,3].
In fact, intrinsic and extrinsic environmental factors can also influence tumor development. Age, hormonal status of the individual and genetic predisposition are some of the intrinsic factors that can affect some types of cancer. Within the extrinsic factors the dietary habits and the exposure to toxic products and radiation, for example, can be highlighted[1,3].
In recent years, several studies have shown that other cell types, such as cancer-associated fibroblasts, endothelial or immune cells, co-exist with tumor cells in the tumor microenvironment [4,7,8].
Cancer-associated fibroblast, for instance, have been shown to enhance tumor progression and invasion[8].
Blood vessels are responsible for the supply of nutrients and oxygen to the tumor cells, therefore abnormal blood vessels are an important contributor for an aberrant tumor microenvironment. Several studies have shown that endothelial cells that lign tumor blood vessels are different from normal endothelial cells[4,8]. Morphologically, tumor endothelial cells have irregular shape and size and can extend citoplasmatic projection across the vessel lumen. These cells can also create small openings on vessel wall leading them to be more leaky than normal vessels[7].
5
As mentioned above, immune cells like lymphocytes, macrophages or mast cells are also an important contributor to the aberrant tumor microenvironment. Tumor-associated macrophages (TAM’s) are one type of immune cells that is attracted to the tumor microenvironment by chemotatic signals that are expressed by tumor cells, like CSF-1 (Colony Stimulating Factor 1). By releasing angiogenic factors such as VEGF (Vascular Endothelial Growth Factor), FGF-2 (Fibroblast Growth Factor-2) or EGF (Epidermal Growth Factor) to the tumor microenvironment, TAM’s can favor the recruitment of other types of immune cells, such as mast cells and also contribute to favor tumor cells migration and tumor angiogenesis[3,8,9].
6
2. Angiogenesis
The development of new blood vessels occurs mainly through two distinct processes: Vasculogenesis and Angiogenesis[10].
During embryonic development, hemangioblasts (mesodermal-derived cells) differentiate into angioblasts-endothelial cells and into hematopoietic stem cells, to form the initial immature vascular network in the embryo[9].
This process is called Vasculogenesis and occur mainly during embryonic life. However, this process can also occur during adulthood through bone marrow derived cells that have the capacity to incorporate into endothelium of new blood vessels.
On the other hand, Angiogenesis is a process that can occur throughout adult life, during normal or pathologic situations, like cancer, and is responsible for tissue irrigation and growth. The formation of new blood vessels occurs from pre-existing vessels by very controlled and regulated process through gradients of angiogenic factors. Dissolution of the extracellular matrix, proliferation and migration of endothelial cells across the new vessels, lumen formation and sprouting are some steps that are needed during angiogenesis. Pericytes and basement membrane associate to the new blood vessels to give them stability. Angiogenesis is a strictly controlled and a self regulated process, being also a reversible process and is currently a therapeutic target in many pathological situations[7,10].
2.1 Tumor angiogenesis
Angiogenesis is essential for tumor growth and cancer cell dissemination for other organs[9].
In the initial phase of tumor development, tumors are avascular and only irrigated by blood vessels of surrounding tissues that can supply the tumor mass with oxygen and nutrients. The development of blood vessels is necessary for tumor growth. With the increase of tumor volume, the central tumor cells start dying because they don’t sense oxygen (hypoxia condition – oxygen deprivation). In this phase, a counterbalance between the number of proliferative cells and apoptotic cells is established.
7
When in hypoxic conditions, tumor cells have the capacity of releasing pro-angiogenic factors like, VEGF, FGF-2 and others, which stimulate the proliferation of endothelial cells that line the vessel wall. New blood vessels can supply central tumor cells with oxygen and nutrients and enhance tumor growth[3].
The transition from avascular to vascular phase of tumor growth is called ‘angiogenic switch’. The timing of the angiogenic switch depends on the tumor type and tumor microenvironment, but it occurs in all solid tumors[8,9,11].
The angiogenic process is controlled by positive and negative signals. During the angiogenic switch, positive regulators of angiogenesis prevail, thus promoting tumor angiogenesis and tumor growth[11].
Many differences can be found between tumor and normal blood vessels. Alterations in endothelial cell barrier function, tortuous appearance, chaotic blood flow due to defects on attachment of pericytes result in increased leakiness and aberrant tumor blood vessels[8,12].Unlike in normal tissues, tumor endothelial cells do not form a monolayer and have intercellular gaps in the vessel wall. This weakness in the blood vessels allow blood to stay in direct contact with the exposed basement membrane. In some situations, tumor cells can occupy these holes, a phenomenon that will be described in the next chapter [7].
2.2 Angiogenesis in Melanoma
As mentioned above, the occurrence of the angiogenic switch is an important step in cancer progression.
As in other cancer types, angiogenesis in melanomas is stimulated by various growth factors (positive modulators) such as VEGF, bFGF (basic fibroblast growth factor), PDGF (platelet derived growth factor) and TGF-β.
An elevated angiogenic activity can lead to uncontrolled melanocytes proliferation causing the increase consumption of nutrients and oxygen, leading to hypoxia condition. As mentioned above, hypoxia is a situation that results in increased angiogenesis[13].
8
Many studies have tried to find a correlation between the degree of angiogenesis, the aggressiveness of the tumors and the tumor metastatic ability[14].
In 1999, Maniotis et al., described for the first time in melanomas, another mechanism by which tumors may establish their blood supply, which was termed Vasculogenic Mimicry or Vascular Mimicry.
2.3 Melanoma Vascular Mimicry
The existence of channels delimited by tumor cells that allow the transport of plasma and red blood cells was firstly described in Human Uveal Melanoma.
The term vascular mimicry arises because the channels are not true blood vessels (they are not covered by endothelium) but mimic the function of endothelial vessels. These channels comprised by tumor cells there are also composed of laminin and type IV and VI collagen, heparin sulfate proteoglycans and glycosaminoglycans[15,16,17].
Angiogenesis can be mimicked in vitro using the so called tube-formation assays in which endothelial cells are grown in matrigel in the presence of growth factors.
Several studies have shown that only cell lines from more aggressive melanomas (and only from these) are able to recreate this kind of patterns in vitro[15,16,18,19].
It has also been shown that melanoma cells that have the ability to undergo vascular mimicry have high plasticity, upregulated expression of genes characteristic of embryonic progenitors and endothelial precursors, which indicate that these cells may revert to an undifferentiated state, and downregulate genes associated with lineage-specific phenotype such as differentiated melanocytes in the case of melanomas[15,17,18].
In addition to melanomas, vascular mimicry has also been observed in another types of tumors, such as lung, breast, prostatic and ovarian carcinoma[16-18].
Studies on vascular mimicry have led researchers to believe that this may be a way to facilitate the rapid invasion and tumor growth which can occur independently and simultaneously with the angiogenic process[18,20,21].
9
The type of channels formed by vasculogenic mimicry can allow blood flow from the vessel covered by endothelium to regions where there are only tumor cells[17,18,20,21].
The vascular mimicry phenotype is supported by the co-option of signalling pathways that regulate genes that are involved in angiogenesis and vasculogenesis during embryonic development, like VE-cadherin, VEGF-A or Laminin.
Some studies revealed that VE-cadherin knockdown inhibits the vascular mimicry pattern and downregulation of ve-cadherin or laminin can lead to the inability of the aggressive melanoma cells to form vascular networks in vitro[17,18].
Therefore, once the vascular mimicry has been associated with the aggressiveness of tumors and with higher risk of melanoma recurrence and since many anti-angiogenic drugs have been ineffective, this process of vessel formation may be a potential therapeutic target to develop new anti-cancer therapies[15,18].
10
3. Melanoma
Melanoma is one type of malignant skin cancer that represents 4% of all diagnosed types of skin cancer. Despite the small percentage of reported cases, melanoma is responsible for most skin cancer-related deaths [9,15,22,23].Melanoma can occur not only on the skin but also on the eye or meninges despite this being a rarer phenomenon[9]. In humans, malignant melanoma usually has a great metastatic potential with poor prognosis and with extreme resistance to treatments[9].
3.1 Melanoma Development
Melanoma originates in the melanocytes which are cells that derive from neural crest during embryonic development. These cells have the capacity to synthesize melanin which is responsible for cell protection from mutagenic ultraviolet rays[22,23]. Melanocytes co-exists in a close contact with keratinocytes on the basement membrane of skin epithelium that mediate melanocyte proliferation in response to growth factors and via cell adhesion molecules[23].
It is known that some mutations in genes that are implicated in growth and survival can lead to transformation of normal melanocytes to melanoma, however, these molecular events are not yet entirely understood[23].
Generically, melanoma is initiated with a proliferative phase that can result from the influence of UV radiation, leading to the formation of benign melanocytic nevi followed by aberrant growth.
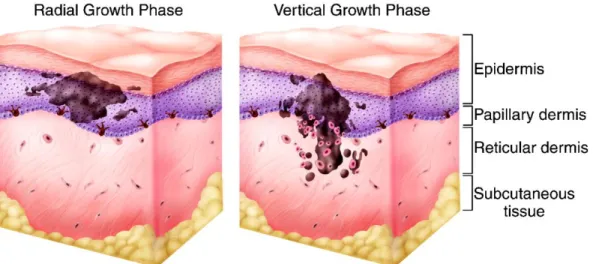
Melanoma development is composed of two distinct phases: the radial growth phase and the vertical growth phase and occurs primarily in regions with more benign melanocytic nevi lesions. In a radial growth phase, tumor cells acquire the ability to proliferate horizontally through the epidermis whereas in a vertical growth phase, tumor cells can invade the dermis and subcutaneous tissue[9,23].
Keratinocytes are cells that control melanocyte proliferation through the action of a particular cell adhesion molecules, such as E-cadherin. In a melanoma context, melanocytes downregulate this molecule and upregulate another molecule, such as N-cadherin, that promote the motility of melanoma cells.
11
In advanced stages of melanoma progression, due to E-cadherin loss and alterations in integrin expression and cytoskeleton, melanoma cells can migrate and create metastasis in distant organs[23].
Figure 3: Radial and vertical growth phase during Melanoma progression. (Adapted from Hodi F. (2006) Clin Cancer Res.)
3.2 Melanoma Microenvironment
As described above, the tumor microenvironment is composed by many types of cells such infiltrating inflammatory cells or fibroblasts but also by tumor microvasculature and extracellular matrix components like Collagen Type I or Laminin. It is now established that melanoma cells can interact with their microenvironment by direct cell-cell and cell-matrix contact but also by growth factors that are secreted in a paracrine (other cells) or autocrine (the same cells) manner.
TGF-β (transforming growth factor – beta), VEGF-A or FGF-2 are some of the growth factors that are secreted by melanomas and that have an important role in transition from the radial to vertical growth phase and to metastatic phase[9,23].
12
4. Extrinsic factors: Cholesterol and Cancer
Cholesterol is a steroidal lipid and an essential component of animal cell membranes. Cholesterol is crucial for cell integrity (has effects on membrane structure and fluidity), signaling (as part of lipid rafts) and also for steroid hormones synthesis[24].
Cellular cholesterol content is strictly regulated by uptake activity, endogenous synthesis, conversion into other products such as steroid hormones and also by cholesterol efflux activity. However, in some pathologies, including cancer, this regulation of cholesterol can lead to the proliferation of tumor cells, for instance[25].
In circulation, cholesterol is transported by lipoproteins including Low-density lipoprotein (LDL) and High-density lipoprotein (HDL). LDL mediates the distribution of cholesterol to peripheral tissues mainly through the LDL-Receptor (LDLR) and HDL is responsible for the reverse transport (removing excess tissue cholesterol and carrying it to the liver)[26].
Low-density lipoprotein is composed by a core of neutral lipids and cholesterol esters and also a shell of a phospholipids monolayer and cholesterol. This lipoprotein is also covered by apolipoprotein B (Apo-B100) which is recognized by LDL receptors on cells[27].
When LDL particles bind to the LDL receptor, these are internalized into coated pits by endocytosis and degraded in lysosomes. LDL receptors are responsible for about 75% of the uptake of LDL-cholesterol and after internalization receptors are recycled and once again exposed on the surface of the membrane[24,27].
At the molecular level, high intracellular cholesterol levels decrease the activity of HMG-CoA reductase (3-hidroxi-3-methyl-glutaril-CoA redutase) and also LDL receptor expression, by negative feedback. On the other hand, with lower levels of cholesterol in circulation, de novo synthesis is activated and more LDL receptors are exposed on surface of cell membranes[24,28].
13
Figure 4: Low-density lipoprotein (LDL) composition. (Adapted from www.lookfordiagnosis.com)
Some studies have suggested that cholesterol may play an important role in tumor development. One of the major changes experienced by tumor cells is to increase their metabolic needs, in order to sustain tumor proliferation and potentially metastatic activity.
It is known that tumor cells have increased cholesterol needs, namely due to their increased proliferative rate and the demand for increased membrane synthesis. There are also studies showing that LDLR expression in tumor cells is higher when compared to normal cells[26,27].
In breast cancer for example, studies performed in the Sérgio Dias laboratory have shown a positive correlation between systemic cholesterol levels (in particular LDL) an tumor size, as well as lymph node invasion. In agreement with this mouse models studies performed at the Sérgio Dias Lab. Others have shown that high levels of cholesterol in circulation (hypercholesterolemia) lead to bigger and more proliferative tumors[29,30].
At the cellular level exposure of tumor cells to LDL has also been shown to increase cell proliferation, loss of adhesion and to promote cell migration. A different study as also shown that hypercholesterolemia promotes tumor angiogenesis[29- 34].
14
In 1993, Ishibashi et al., developed a mice that lacks functional LDL receptors and verified that these mice had increased LDL-cholesterol levels when compared with control mice[35].
This experimental in vivo model can be used for studies to test what is the influence of this receptor in the host microenvironment during a pathological condition, such as cancer.
15
16
Material and Methods
Cell Lines
The B16F0 melanoma cell line was grown in Dulbecco’s Modified Eagle Medium (DMEM) (Sigma) containing 10% fetal bovine serum (FBS) (Gibco Invitrogen), L-glutamine (Gibco Invitrogen) and Antibiotic-Antimycotic (AA) (15240-062, Gibco Life Technologies).
Human Umbilical Vein Endothelial Cells (HUVECs) were maintained in complete Endothelial cell basal medium-2 (EBM-2) (Lonza Clonetics) supplemented with EGM-2 Single Quots, 2mg/ml BBE (Lonza Clonetics) and 10% of FBS. HUVECs were used between third and fourth passage and cultured onto 0,2% Gelatin coated plates.
Cells were incubated in a 37°C humidified CO2 (5%) incubator and passaged for
new t-flasks when sub-confluents using standard methods.
Animal Models
B6.129S7-Ldlrtm1Her/J (LDLR KO) male mice (8-10 months-old) were purchased from the Jackson Laboratories and C57BL/6J (WT) male mice (8-10 months-old) were purchased from Charles River and used. The average weight of all mice was around 30g.
Orthotopic Tumor Model
LDLR KO and WT mice were inoculated intradermally with 5x10⁵ B16F0 cells/ml. Food and water were given ad libitum.
Tumor volume (cm3) was determined by caliper measurements of length and width at 4 different timepoints during tumor development and calculated using the following formula: (length x width2)/2. Mice were sacrificed 14 days after tumor cell inoculation and tumors were collected, frozen samples (stored at -80C°) and fixed in 10% formalin for ± 24h, processed and embedded into paraffin blocks.
Cell Proliferation Assay
8,4x10³ B16F0 cells were seeded onto 24-well plate in 300 µl DMEM + 10% FBS for 24 hours. After that the medium was replaced by DMEM without FBS and
17
100µg/ml of LDL-cholesterol or the corresponding vehicle (NaCl + 0,01%EDTA). Cells were then re-incubated overnight, at 37°C in 5% CO2, for 24, 48 and 72 hours. During the next 3 days, the medium was aspirated/discarded and cells were incubated with 100 µl Trypsin (during few minutes) to remove adherent cells from each well. Trypsin solution was inhibited with 400 µl DMEM + 10% FBS and the number of viable cells were counted with the aid of a hemocytometer (3 counts/well, in triplicates per each condition) using the Trypan Blue exclusion method (10µl of cells were mixed with 2 µl of Trypan Blue). B16F0 cells from day 1 were collected and stored in Trizol (1ml) at -80°C to RNA extraction.
Vasculogenic Network Formation In Vitro (Matrigel Assay)
Matrigel ® (BD, Biosciences) (200 µL) was introduced into the wells of 24-well plates and placed for ± 1 hour, at 37°C in 5% CO2, in a cell culture incubator. After this, B16F0 and HUVECS (5x10⁴ cells) were seeded with (200 µL) DMEM or EBM-2 medium (for cancer and endothelial cell line, respectively) with 1 % FBS. Two replicate wells per each condition were used. LDL-cholesterol (150 µg/ml) or the same volume of vehicle was then introduced one hour after cell seeding, into respective wells. Tube formation ability was evaluated after 12 hours and network formation was captured by using a Compact Inverted Zeiss Primovert microscope. In vitro images were acquired at 10X magnification (6 high power fields per well) and the number of bifurcations were quantified (all points of contact established by a cell with another were assumed to be a bifurcation).
Antibodies
The following antibodies were used to stain tissues embedded in paraffin blocks: anti-CD105 (Endoglin) (goat-anti-mouse; AF1320; R&D) combined with Alexa Fluor conjugated-488 or -594 (donkey-anti-goat; A11055 or A11058, respectively; Invitrogen); anti-Laminin anti-mouse; L9393; Sigma); Phosphohistone 3 (rabbit-anti-mouse) combined with Alexa Fluor conjugated-488 (donkey-anti-rabbit; A21206, Invitrogen) and Ki67 (rabbit-anti-mouse; Abcam) combined with DAB Solution EnVision Kits (anti-rabbit; DAKO). In frozen tissues we used CD31 (rat-anti-mouse; 553370, BD
18
Pharmigen) combined with Alexa Fluor conjugated-594 (goat-anti-rat; A11007, Life Technologies) and were also tested anti-CD105 and anti-Laminin antibodies in these frozen tissue samples.
AR Pretreatment
The tissue sections were subjected to the following pretreatment protocol: paraffin tumor samples were introduced into DAKO PT LINK machine with Target Retrieval Solution (pH 9) (DAKO) during around 90 minutes to expose antigen sites to antibody.
Immunofluorescence
Paraffin and frozen tumor samples (3-4µm and 6-10 µm thick, respectively) were mounted onto slides by the Pathology and Histology Unit of Instituto de Medicina Molecular (IMM). After antigen retrieval procedure, paraffin sections were washed with 0,01% PBS/Tween (Sigma) solution for 5 minutes to permeabilize the cells and then incubated with blocking solution containing 0,01% PBS/Tween containing 1% bovine serum albumin (BSA) to reduce nonspecific background staining, for 60 minutes, at room temperature). Slides were then incubated with primary antibodies in a 1:100 dilution in blocking solution (or in PBS) and all slides were then incubated at 4°C overnight. On the next day, slides were washed 3x for 5 minutes in PBS (with agitation) and then incubated with secondary antibodies diluted 1:500 times in blocking solution (or in PBS) for 60 minutes, at room temperature. In some cases, two primary antibodies (and also secondary antibodies) were incubated together to analyze different structures in the same tissue sample. After secondary antibody incubation, slides were washed 3x for 5 minutes in PBS (with agitation) and then tissues were mounted and counterstained with Vectashield Mounting Medium for Fluorescence with Dapi (Vector Laboratories).
After unfreeze frozen tumor samples and air dried (30 minutes), tumor tissues were fixed with 10 % Formalin (Bio-Optica) (15-20 minutes, at room temperature), followed by washing with PBS (5 minutes). After this all the steps of immunofluorescence protocol described above were performed.
19
Immunohistochemistry
Paraffin samples (3-4µm thick) were mounted onto slides in Pathology and Histology Unit of Instituto de Medicina Molecular (IMM). After antigen retrieval procedure, endogenous peroxidase was blocked with 3% H2O2 during 30 minutes in
the dark. Tissues were surrounded with DAKO hydrophobic pen and washed 3x for 5 minutes in 0,01% PBS/Tween before incubation with 2,5% Horse Blocking Serum Solution during 30 minutes. The primary antibody was diluted 1:200 in 0,01% PBS/Tween and then incubated during 1 hour at room temperature. Slides were washed 3x for 5 minutes in 0,01% PBS/Tween to remove primary antibody and ready-to-used secondary antibody was introduced during 30 minutes at room temperature. Finally the slides were washed in 0,01%PBS/Tween and the revelation was made with DAB from Envision Kits. When the staining starts to appear (see in the microscope) the reaction was stopped with distilled water. Then, Hematoxilin staining was made in Histopathology Service and the slides were mounted with the Entellam mounting medium.
Vasculogenic Mimicry, Mosaic and Endothelial Vessel Quantification
Tumor vasculature was assessed by immunofluorescence analysis through the counting of the number of positive vessels for CD105 or CD31 and Laminin markers. Three types of tumor blood supply vessels were counted accordingly the following parameters: vessels stained by CD31 and also by Laminin were classified as endothelial blood vessels; vessels were also classified as endothelial vessels when lack the expression of both markers in some regions without nucleus surrounding the vessel wall; when vessel wall lacks the expression of CD31 but maintain the expression of Laminin, vessel was classified as mosaic vessels; and when nucleus were visible between the lack of CD31/Laminin expression in the vessel wall, vessels were also classified as mosaic vessels; when no staining for CD31 but a positive staining for Laminin was detected in all vessel wall, the vessels were classified as vasculogenic mimicry/vascular mimicry. The parameters used for tumor vasculature counting can be visualized in Supplementary Information [Table S2].
20
Microscopy imaging
Immunofluorescence images were assessed by using Widefield Fluorescence Microscope Leica DM5000B.
CD105 images were acquired with 200X magnification (20 high power fields per tumor) while CD31 and Laminin double-staining were acquired at 400X magnification (10 high power fields per tumor) in Widefield Fluorescence Microscope Leica DM5000B. All the images were processed and analyzed with ImageJ 1.47t software.
Immunohistochemistry images for Ki67 were acquired using Brightfield Microscope Leica DM2500 with magnification 400X (5 fields per tumor) and the images were analyzed by ImmunoRatio software (online available - http://153.1.200.58:8080/immunoratio/).
RNA Extraction
RNA was extracted using the following TRIzol® reagent method: B16F0 cellular pellets (from in vitro cell proliferation assay, stored in 1ml of TRIzol® reagent (Sigma-Aldrich)) were homogenized in vortex for 15 seconds and samples were incubated at room temperature during 5 minutes. Chloroform (200µL/ml of TRIzol®) was added and mixed in vortex for 15 seconds. Tubes were incubated at room temperature during 2-3 minutes and centrifuged at 13000 RPM for 20 minutes at 4°C. Following centrifugation, three distinct phases (lower organic phase, an interphase and upper aqueous phase) were visible in the eppendorfs. Only aqueous phase (RNA remains exclusively in this phase) was transferred to new tubes and Isopropanol (500 µL/ml TRIzol®) was added. Samples were incubated for 10 minutes at room temperature and 2 hours at 4°C and then were centrifuged at 13000 rpm during 20 minutes at 4°C to precipitate RNA. The Supernatants were removed and RNA pellets were washed with Ethanol 80% (1ml/ml TRIzol®) and mix in the vortex for 5 seconds, followed by centrifugation at 13000 rpm, during 20 minutes at 4°C. After, the maximum volume of supernatant was discarded with a pipette and RNA pellet was dried in air for a few minutes. Pellets were resuspendend in 10 µL of DEPC water and incubated on ice (4°C) or in a water bath (55°C-60°C) for 10 minutes. After all procedure, RNA was quantified using NanoDrop® 2000 spectrophotometer (Thermo Fisher Scientific) (the purity was analyzed according
21
to the respective wavelengths) and stored at -80°. The majority of these steps was performed on ice to prevent RNA degradation.
cDNA Synthesis Protocol
The cDNA synthesis protocol was performed to convert RNA into DNA. The volume corresponding to the 0,5µg of RNA was introduced in tubes with (1µL) Random Primers (Invitrogen™), (1µL) 2.5 mM dNTP’s and DEPC water up to 12,5µL. The samples were incubated in a thermocycler (Applied Biosystems) during 5 minutes at 65°C and then, (4µL) 5x First Strand Buffer (Invitrogen™), (2µL) 0.1mM DTT (Invitrogen™) and RNAse Out Recombinant Ribonuclease Inhibitor (Invitrogen™) were introduced in each sample. Tubes were incubated at 25°C during 2 minutes in thermocycler and then (0,5µL) Superscript II Reverse Transcriptase enzyme (Invitrogen™) was added before last incubation in a thermocycler.
During the last incubation time, samples were subjected at three different temperature cycles (25°C for 15 minutes,; 42°C for 50 minutes and 70°C during 15 minutes) to complete cDNA synthesis. The tubes were maintained on ice during all procedure steps.
Quantitative PCR (qPCR) for mRNA quantification
mRNA levels were quantified by qPCR through ViiA™ 7 Real Time PCR system (Applied Biosystems) in 384-well plates, using SYBR-Green. Relative expression was calculated using the comparative method (2-Δct) and sample normalization was performed with 18S mRNA expression. For the amplification reaction it was prepared a 8,3 µL mix with (4µL) SYBR-Green (Applied Biosystems), (2µL) DEPC-water, (0,15µL) 10mM for both forward and reverse primers and (0,1µL) 2% BSA (Sigma). Primer sequences used in this study are listed in supplementary information section (Table S1). Three replicate-wells were performed per each sample and (2µL) cDNA was introduced in each replicate-well. In non-template control well (nTC) cDNA was not introduced and it was replaced by (2µL) DEPC-water.
22
Statistical Analysis
Statistical analysis was performed with GraphPad® Prism 6.01 software. The statistical significance was determined using student’s t-test (non-parametric t-test) (p < 0,05) and error bars represents the standard deviation of the mean.
23
24
Aims
Some studies have shown that tumor cells increase their cholesterol needs and that this can be associated with higher tumor cell proliferation rates. Moreover, it is also been showed a positive correlation between higher levels of low-density lipoprotein cholesterol (LDL-cholesterol) in circulation and tumor volume. How LDL affects tumors cells starts to be understood, but little is known as to how high levels of LDL-cholesterol may influence cancer development by acting on the tumor microenvironment. As LDL-cholesterol is removed from circulation by the LDL-receptor (LDLR), this project aimed at verifying if the absence of the host LDL receptor influenced melanoma tumor progression.
25
26
Results
Melanoma growth in LDLR KO mice
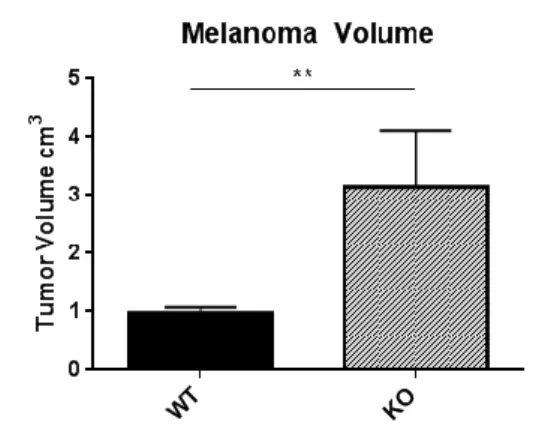
The main goal of the present study was to understand if the absence of LDL receptor in mice has influence in tumor growth. To test this, we inoculated B16F0 melanoma cancer cells, intradermically, into the ventral part of the body of B6.129S7-LDLRtm1Her/J (LDLR KO) and wild type C57BL/6J (WT) male mice. Fourteen days after injection, the tumor volume was measured. As shown in Figure 5, there was a significant increase in tumor volume in LDLR KO mice compared with wild-type mice.
Figure 5: Tumor volume in wild-type and LDLR knockout mice: Melanoma Model. Tumor volume (cm3) was determined by caliper measurements of length and width after 14 days of tumor development. Volume was calculated using following formula: (length x width2)/2. Bar graphs show the average final tumor volume (cm3) ± SD in WT (n=4) and LDLR KO (n=4) groups without outliers. Difference in tumor volume between two groups had statistical significance(**p-value = 0,0041; Unpaired t-test).
Tumor Cell Proliferation in LDLR KO mice
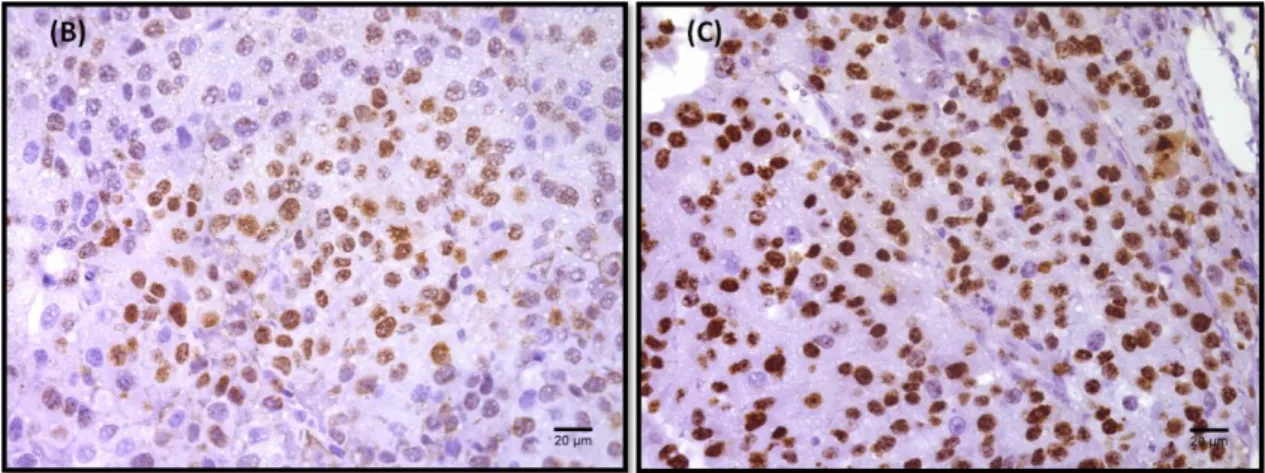
To verify if the increase in tumor volume seen in the LDLR KO mice was related to more proliferation of tumor cells, an immunofluorescent staining for Ki67, a marker for cycling cells was performed. As it can be seen in Figure 6, tumors from LDLR KO mice have more Ki67 positive cells compared with tumors originated in WT mice. This suggests that the increased tumor volume in LDLR KO mice is due to increased proliferation of tumor cells.
27
Figure 6: Quantification of tumor cell proliferation by Ki67 in Melanoma tumors. Tumor sections from WT and LDLR KO mice was stained for Ki67 (proliferation marker) to see in vivo proliferation. The total number of Ki67 positive cells per nuclear area was counted in 5 high-powered fields per each tumor section (40x Magnification). (A) The bars represent the average ± SD percentage of Ki67 positive cells in at least 3 tumors per group. Statistical difference was found between WT and LDLR KO group (*p-value = 0,0227; Unpaired t-test). (B) The images show the positive staining for Ki67 (brown) in wild-type and (C) LDLR knockout group (40x Magnification).
Effect of LDL on melanoma cell proliferation
LDLR KO mice have increased LDL levels in circulation and LDL has been shown to increase the proliferation of cancer cells such as breast cancer[30]. To test whether LDL also increased the proliferation of melanoma cells, we cultured B16F0 cells with LDL for 24, 48 or 72 hours and compared cell growth with control conditions. No differences were however detected between the growth curves of control cells versus LDL-treated cultures (Figure 7).
Figure 7: B16F0 proliferation was not affected by LDL-cholesterol. Melanoma cells were seeded (0 hours) and 24 hours later were wither left untretated or treated with 100µg/ml of LDL. The number of living cells in both conditions was quantified at 24, 48 and 72 hours after treatment. The experiment was done in triplicates and the average ± SD for each condition and time point is shown. No statistical differences were found between conditions on any day of the experiment (Unpaired t-test). The experiment was repeated twice and gave rise to similar results.
28
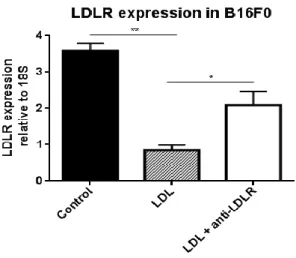
As this was an unexpected result, we decided to look for evidence that melanoma cells were uptaking LDL from the media. For that, the expression of LDLR, known to be regulated by extracellular cholesterol levels was assessed in both control and LDL-enriched conditions. As seen in Figure 8, melanoma cells express LDLR and its mRNA levels decreased in the presence of LDL in the media and this decrease is diminished if the interaction of LDL with melanoma LDLR is blocked using a specific anti-LDLR antibody. Taken together these data show that melanoma cells are able to sense and respond to the increase in LDL-cholesterol concentrations in the media.
Figure 8: LDLR expression on B16F0 cells and it’s regulation by LDL. qPCR for B16F0 melanoma cell line untreated (control) or treated with LDL or with LDL + antibody against the LDL receptor. Averages ± SD of one experiment performed in triplicates are shown (*p-value = 0,0242; **p-value = 0,0040, Unpaired t-test).
Tumor vascular density in LDLR KO mice
Since we did not observe an increase in melanoma proliferation in vitro in response to LDL, we decided to investigate if alterations at the level of the tumor microenvironment could justify the increase in tumor volume detected in LDLR KO mice. As increased vasculature sustains tumor growth we decided to investigate if the increase in tumor volume observed in LDLR KO mice was related with increases in vascular density. For this, the number of blood vessels in melanoma tumors was assessed by immunofluorescence using anti-CD105 and anti-CD31 specific antibodies to identify blood vessel endothelial cells.
29
No differences in the number of CD105 or CD31 positive vessels between tumors from WT and KO mice were detected (Figure 9 A and B). We also noticed that, when we performed a double immunofluorescence for both CD105 and CD31 there were a considerable number of endothelial cells that expressed CD31, but not CD105, while the opposite was not true (Figure 9 C).
A closer analysis also showed that CD31 staining was not uniform around the vessel wall with some regions lacking its expression.
Since melanoma cells are known to be able to intercalate with endothelial cells and form “blood carrying channels”, in a process called “vascular mimicry”, we re-quantified the number of vessels in these tumors. For this we used antibodies against Laminin, a component of the basement membrane that is present both in blood
Figure 9: Endothelial Blood Vessels in Melanoma. Total number of vessels were counted in 20 high-powered fields (20x magnification) of one tumor section stained (A) for CD105 (endoglin marker) and (B) for CD31 (endothelial marker). Bar graphs represent the average ± SD of total number of endothelial vessels counted from at least 4 tumors (for CD105+ vessels) and 2 tumors (for CD31+ vessels) per group. No statistical differences between groups were found in both staining ((A) p-value = 0,5170, (B) p- value = 0,6910; Unpaired t-test). (C) Bar graphs represents the total number of CD31 positive vessels and the total number of positive vessels for both (CD31 and CD105) markers counted from only one wild-type tumor section (n=1). [n.s= non significant]. (D) One tumor section per tumor was stained for both CD31 and CD105. In these images, only one blood vessel stains for both markers (yellow arrow). CD31 was stained in red, CD105 in green and nucleus were counterstained with DAPI (blue).
30
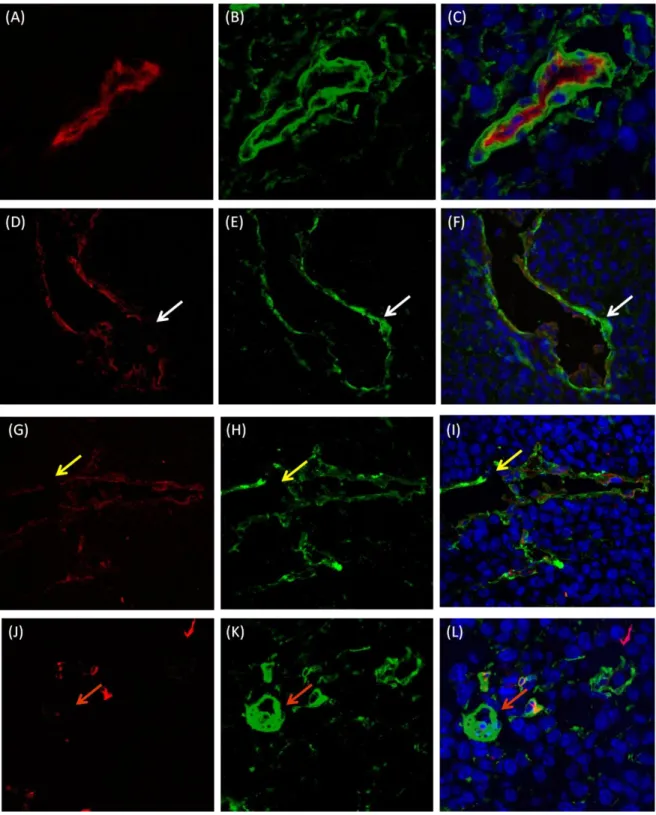
vessels and in melanoma cells-formed vessels, to identify blood carrying channels, and co-staining with CD31 to distinguish from: 1) ) fully CD31 and Laminin positive vessels that were scored as endothelial blood vessels (Figure 10 A-C); 2) vessels lacking CD31 or CD31 and Laminin staining in some regions of the vessel wall that were scored as mosaic vessels (Figure 10 D-I) and 3) CD31 negative and Laminin positive vessels that were scored as vascular mimicry (Figure 10 J-L).
Considering that no changes were detected between WT and LDLR KO mice in terms of endothelial vascular density, but tumor volumes were bigger in LDLR KO mice, we addressed the question whether the increase in tumor volume could be explained by differences in vessel heterogeneity of tumors grown in wild type or LDLR KO mice. To test this hypothesis, we quantified each type of vessels present in tumors from each experimental conditions (Figure 11).
The results showed that the number of endothelial vessels did not vary between WT and LDLR KO groups (Figure 11 A). However, the number of mosaic vessels (Figure 11 B) were statistically different between WT and KO, while vascular mimicry channels (Figure 11 C) showed a tendency to be bigger in the KO group.
31
Figure 10: Different Patterns of Tumor Blood Supply in Melanoma. Total number of vessels were counted in 10 high-powered fields (40x magnification) of one tumor section stained for both following markers: CD31 (endothelial marker) and Laminin (basement membrane marker). (A-C) Endothelial Blood Vessel: (A) CD31 positive staining (red) and (B) Laminin positive staining (green) ; (C) Merge with nucleus counterstained with DAPI (blue); (D-F) Mosaic Vessel: (D) CD31 positive vessel (red) with regions in the vessel wall that lacks CD31 expression (white arrow) and (E) Laminin positive staining (green) around all extensions of the vessel wall; (F) Merge with nucleus counterstained with DAPI (blue); (G-I) Mosaic Vessel: (G) CD31 (red) and (H) Laminin (green) were not expressed in some areas of the tumor vessels (yellow arrows); (I) Merge image shows the presence of nucleus counterstained with DAPI in the vessel wall even in places where there is no staining for CD31 an Laminin (yellow arrow); (J-L) Vascular Mimicry Channel: (J) CD31 negative expression and (K) Laminin positive expression (green) (orange arrows); (L) Merge image with nucleus counterstained with DAPI (blue).
32
Taken together these quantifications suggest that an LDLR negative environment may favor the formation of vascular channels by vascular mimicry.
In Vitro Tube Formation Assay
Melanoma cells have been shown to be able to form tube-like structures, similar to what happens with endothelial cells, when cultured in matrigel [15]. To test whether LDL, which is increased in LDLR KO mice [36], can per se induce a vascular mimicry phenotype on melanoma cells we assessed the ability of B16F0 cells to form tube-like structures in the absence and presence of LDL. In parallel and as a positive control, we performed that same assay using Human Umbilical Endothelial Cells, well known to form “tubes” in matrigel.
In this sense we were able to show that, as shown by others, B16F0 melanoma cells form tube-like structures, when cultured in matrigel (Figure 12. Treatment of cells with LDL did not affect the number of tube-like structures formed (Figure 13 A). Similarly,
Figure 11: Three types of tumor blood supply in Melanoma. Total number of vessels were counted in 10 high-powered fields (40x magnification) of one tumor section co-stained for the following markers: CD31 (endothelial marker) and Laminin (basement membrane marker). Bar graphs represent the average ± SD of total number of (A) endothelial blood vessels, (B) mosaic vessels and (C) vascular mimicry channels counted from at least 5 melanoma tumors per group. No statistical differences was found in endothelial blood vessels (p-value = 0,6749) and in vascular mimicry channels (p-value = 0,5966), but KO group have more mosaic vessels than WT group, with statistical significance (*p-value = 0,0199; Unpaired t-test). [n.s= non significant].
33
we also did not observe any effect of LDL on the ability of HUVEC’s to form tubes (Figure 13 B).
Figure 12: In vitro tube formation. HUVECS and B16F0 cell lines were cultured on Matrigel with 1% FBS or with 1% FBS + LDL-cholesterol for 12 hours. The images were obtained at 10X Magnification. HUVECS and B16F0 formed tubular structures with 1% FBS and also with 1% FBS + LDL..
Figure 13: The presence of LDL-cholesterol did not affect HUVECS and B16F0 tube formation. Endothelial and Melanoma Cell line were cultured on Matrigel in 2 different conditions: medium with 1%FBS or with 1%FBS + LDL-cholesterol. Two replicate wells per each condition were made. The bars represent the average ± SD of the total number of bifurcations counted in 12
high-34
powered fields per well (6 high-powered fields per each replicate). (A) LDL doesn’t affect the B16F0 tube formation (p-value = 0,2575 Unpaired t-test) and also doesn’t have an impact in (B) HUVECs tube formation. (p-value = 0,2476, Unpaired t-test).
Taken together, the results presented in this Thesis show that higher levels of LDL in LDLR KO mice may lead to an increase in tumor volume which was accompanied by increased tumor cell proliferation. However, in vitro, LDL did not directly affect B16F0 cell proliferation levels and did not appear to alter their capacity to form tube-like structures in vitro on Matrigel. Besides this, we verified by qPCR that B16F0 respond to the increase in LDL concentrations in the media, as evidenced by regulation of the expression of their LDL receptor. Our in vivo observations led us to look into greater detail into the angiogenic profile of control and LDL-receptor KO mice tumours; interestingly, tumors grown on LDL-receptor KO mice showed a significantly greater number of mosaic vessels.
35
36
Discussion
Tumor growth is dependent on the action of non-tumor cells that form the microenvironment and also by the general state of the “host”, in which metabolism is included. In this work we tried to address the question of whether the absence of a lipid receptor, namely the LDL receptor, in cells from the tumor micro- and macro-environment would impact on tumor growth. In this sense we orthotopically injected LDLR expressing melanoma cells in mice lacking the LDLR (LDLR KO mice). As a result we observed a significant increase in tumor volume in these mice when compared with wild type mice. This increase in tumor volume was shown to be due to increased proliferation of tumor cells as detected Ki67 staining.
Previous studies performed in our Lab and also by others, using a mouse breast cancer model, showed that mice fed on a high cholesterol diet have bigger tumors when compared with mice on normal diet[29,30].
In addition epidemiologic studies also revealed a positive correlation between increased tumor growth and higher blood cholesterol levels in prostate and breast cancer[26,34,37].
In our model, the higher levels of LDL-cholesterol are imposed by knockout of the LDL receptor, while the inoculated tumor cells are positive for this receptor. Taking this into account, here we can speculate that LDL-cholesterol acts primarily in tumor cells promoting their proliferation and not in cells of the tumor microenvironment. In order to test whether high LDL-cholesterol would be sufficient to increase melanoma cell proliferation, we performed an in vitro assay, in which we treated melanoma cells with purified LDL. We did not however verify an increase of proliferation in cells stimulated with LDL-cholesterol. This result differs from what has been shown in breast cancer lines. Dos Santos, C. et al (2014) show an increase in viable breast cancer cells after stimulation with LDL-cholesterol[30].
Murtola, T. J. et al (2012) also showed stimulation of prostate cancer cell lines
with high doses of LDL-cholesterol leads to an increase in cell number[37]. Since we did not observe a direct effect of LDL on melanoma cell proliferation, we sought to define the mechanisms by which LDL cholesterol was favoring tumor growth.
37
Some studies demonstrate that hypercholesterolemia enhance tumor angiogenesis in breast tumors[29]. Several other studies suggest a positive correlation between angiogenesis and increase in tumors size[29,32,38]. The promotion of angiogenesis could be therefore be a mechanism by which LDL could increase melanoma growth.
Taking this into account we compared the levels of tumor blood vessel coverage between LDLR WT and LDLR KO mice, by using two endothelial markers (CD105 and CD31). However we didn’t find any differences in the number of CD105 positive and CD31 positive blood vessels between the two experimental conditions.
We verified that CD105 does not stain the same number of vessels that CD31, as it has been seen by other. In colorectal carcinomas, Jung et al. (2008) verify that CD31 staining was higher than CD105 because it was already described that CD31 stains not only neoformed vessels in neoplastic and non-neoplastic tissues but also preexistent blood vessels. On the other hand, CD105 is an antibody more specifically for tumor neovascularization than CD31 marker[39,40].
Taking this into account, we can speculate through our data that there are more pre-existant vessels then neoformed vessels in both tumor microenvironments but there are no differences in number of these vessels between LDLR WT and KO mice.
Since there were no differences in the number of endothelial vessels, how can the tumor continue to grow without the necessary blood supply? In this sense, we introduced the hypothesis that in LDLR KO mice there was occurring more Vascular Mimicry, a phenomenon that is already well described for melanoma[15-18,20,38].
By using CD31-Laminin dual-staining we were able to show that tumors from LDLR KO mice have more mosaic vessels than tumors from LDLR WT mice. Furthermore we also demonstrate that as PAS staining (Periodic Acid-Shiff), Laminin is also a good marker of the vessels basement membrane.
In melanoma tumors, Itzhaki O. et al, (2013), described as vascular mimicry all the channels that were CD31-negative PAS-positive. They used PAS staining to identify the basement membranes of micro-vessels however they describe these channels as being also rich in Laminin[15].
38
In studies performed by Zhang S. and colleagues, vascular mimicry channels and mosaic vessels were identified in melanoma tumors by CD31-PAS staining but also confirmed by CD31 and HMB45 (which is a melanoma-specific marker) dual staining[38]. As described in the literature, we verify that in some regions, vessel wall looses the expression of CD31 (endothelial marker) maintaining only the expression of Laminin (basement membrane marker).
Certain studies had already showed that angiogenic inhibitors did not suppress vascular mimicry phenotype which can make it an alternative route of blood supply when angiogenesis is inhibited[15,21]. This can be a plausible reason for the fact that tumors increase in vascular mosaicism without increasing angiogenesis.
In this sense, we believe that an increase in cholesterol levels in the blood may favor the formation of these types of channel and therefore lead to increased tumor size.
Several studies described that only aggressive melanoma cells are able to form blood-vessel like channels. In vitro studies showed that only aggressive and not poorly aggressive melanoma cells are capable to make three-dimensional structures in matrices of collagen or matrigel, like as HUVECS are capable[15-18].
To confirm the in vivo observations, we performed in vitro assays to test if our melanoma cells are capable to make vessel-like structures. We have found that melanoma cells are able to form such structures in vitro, however, when stimulated with LDL-cholesterol they did not increase the number of bifurcations. Also HUVECS did not respond to more LDL-cholesterol in the medium in order to increase branching or an angiogenic-like phenotype.
Nevertheless, with more LDL-cholesterol, the structures seem much thinner than the control condition. Probably, there are fewer cells per structure which may be an indicator that cells with more cholesterol lose their adhesion property and gain more mobility. This may allow tumor cells to penetrate more easily between endothelial cells explaining the number of mosaic vessels in vivo. More experiments and a better model do mimic mosaicism will be required to confirm this hypothesis. In summary, in this work we have demonstrated that increasing LDL-cholesterol levels by a diet independent manner, leads to increase tumor growth in an LDLR negative
39
environment. This suggests that LDL-cholesterol acts directly on tumor cells to potentiate tumor growth. However, contrarily to what has been shown for other tumor models, we did not observe an increase in cell proliferation as a result of LDL stimulation, but instead an increased ability to form mosaic vessels. Further studies will be required to fully explore the mechanisms by which LDL exerts the effects. Better in vitro models to mimic mosaicism and the identification of molecular players through which LDL-cholesterol may increase the ability of tumor cells to intercalate with endothelial cells to form blood-carrying channels will be under scrutiny.
40