The 21
stInternational Congress on Sound and Vibration
13-17 July, 2014, Beijing/ChinaUSE OF VIBRATION MEASUREMENTS TO DETERMINE
THE MOST SUITABLE LOCATIONS TO IMPROVE
SOUND INSULATION IN BUILDINGS
Vitor Rosão
SCHIU, Vibration and Noise Engineering, Lda., Faro, Portugal e-mail: [email protected]
Ana Carreira
Algarve University, ISE, DEC, Faro, Portugal e-mail: [email protected]
In the present work in situ sound insulation measurements were performed, according to the applicable standards of ISO 140 series, and vibration measurements of the separator elements in question (floor, ceiling, side walls). We intend to compare the results of direct measure-ments of sound insulation with the results of the predictions of sound insulation, based on the vibration measurements, to verify the feasibility of using vibration measurements to deter-mine the most suitable locations of sound propagation (floor, ceiling, side walls) to act in or-der to improve, where it is needed, sound insulation in buildings. The principles of sound propagation considered in EN 12354 series standards are used, e.g., 5 major structural paths, depending on the sound radiating element in the receiver compartment [1) partition wall, 2) ceiling, 3) floor, 4) wall left side, 5) wall right side] and 2 major airborne path [1) openings in the partition element, 2) openings in other elements]. Different Radiation Factors, to convert vibration of elements in sound are also considered, depending on the radiation element type and on the frequency in question.
1. Introduction
When is detected in situ, using, for example, the ISO140-41, the existence of poor sound insu-lation - typically the non compliance of the legisinsu-lation of the acoustic requirements of buildings2 - between two spaces, Transmitter and Receiver, in a building, and we want to solve the problem, is not always easy to answer the following questions:
• will enough to intervene in the separator elements?
• Will it also be necessary to intervene in marginal elements? • Will there be an important propagation through openings?
The difficulty of answering questions listed relates to the fact that the typical measurement1 provides the difference in sound levels between the transmitter and the Receiver, but it doesn´t dis-tinguish which are the Sound Paths that contribute most to this difference.
21st International Congress on Sound and Vibration (ICSV21), Beijing, China, 13-17 July 2014
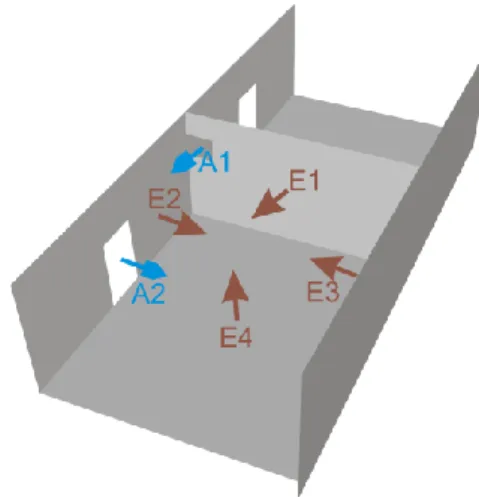
According to EN 12354-13 the existence of the main Sound Paths between the transmitter and the Receiver, illustrated in Figure 1, can be necessary:
• Structural Paths:
E1: Structural path irradiated in the receiver through the separator element. E2 and E3: Structural paths irradiated in the receiver through the side walls.
E4 and Ei: Structural paths irradiated in the receiver through the floor, ceiling and other ele-ments.
• Air Paths:
A1: Air path through the opening in the separator element. A2 and Ai: Air paths through other openings.
Figure 1. Scheme of building sound paths between the transmitter and the receiver
In the present work we intend to analyze the feasibility of using in situ vibration measure-ments, in addition to the typical sound insulation measurements1, to determine the contribution of each of the structural paths in question. In this way it becomes possible to quantify, are which the sound paths intervention is more effective in order to rehabilitate a space acoustically.
2. Fundamentals and theoretical simplifications
2.1 Relationship between Sound Levels and Sound ReductionThe Sound Level LR measured in the receiver can be written as an energy sum of Sound Lev-els LEi, associated with n Structural Paths, with Sound Levels LAi, associated with m air paths,
be-tween the transmitter and the Receiver:
m i L n i L R Ai Ei L 1 10 1 10 10 10 log 10 (1)Thus the intervention / reduction 1 in E1 or i in E1 a Ea, will only be sufficient by itself if
the other contributions are negligible, namely:
10 10 10 log 10 10 log 10 1 10 1 10 1 10
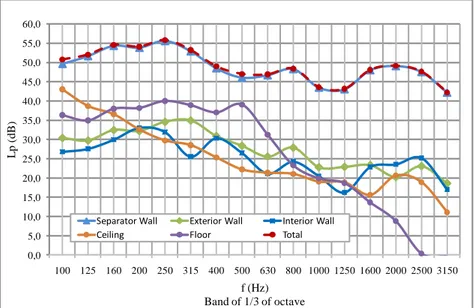
m i L n a i L a i Δ LEi i Ei Ai (2) Just put:21st International Congress on Sound and Vibration (ICSV21), Beijing, China, 13-17 July 2014 10 a a' a Δ L L (3) Where:
a i Δ L a a i Ei Δ L 1 10 10 log 10 (4)
m i L n a i L a' Ai Ei L 1 10 1 10 10 10 log 10 (5)Will follow the expression of Global Sound Reduction, Global:
10log 10 10 1010 a' a a Δ L L R Global L Δ (6)
Based on the above expressions, one can determine some important simplifications in terms of the relationship between the Global Sound Reduction Global, the specific Sound Reduction a and the relationship between La e La', as shown in table 1.
Table 1. Theoretical simplification of the relationships between the reductions and the sound levels
La – La´ (dB) aMin (dB) GlobalMax (dB) La – La´ (dB) aMin (dB) GlobalMax (dB) 0 10* 3 6 16* 7 1 11* 4 7 17* 8 2 12* 4 8 18* 9 3 13* 5 9 19* 10 4 14* 5 10 10+ La – La´ La – La´ 5 15* 6
* aMin is given by the general expression 10+ La – La´
The explained in table 1 means that:
i. If La = La’ then the global maximum sound reduction that it is possible to reach is 3 dB and it is achieved through a specific minimum sound reduction of 10 dB.
ii. If La = La’ + 1 than the global maximum sound reduction that it is possible to reach is 4 dB and it will be achieved through a specific minimum sound reduction of 11 dB and so on. iii. If La La’ + 10 than global maximum sound reduction that it is possible to reach is (La-La´)
dB and is achieved through a specific minimum sound reduction of (10+ La – La’) dB. For example, if La = La’ + 12 than global maximum sound reduction that it is possible to reach is 12 dB and it will be achieved through a specific minimum sound reduction of 22 dB.
2.2 Relations between Sound levels and vibration of the elements
According to Annex C of the norm ISO140-41, the sound power transmitted to the Receiver compartment consists of the sum of the following portions:
WDd: power from direct excitation of separator element and radiated directly by this.
21st International Congress on Sound and Vibration (ICSV21), Beijing, China, 13-17 July 2014
WFd: power from direct excitation of marginal elements and radiated directly by separator
el-ement
WFf: power from direct excitation of marginal elements and radiated directly by these.
Wleak: power transmitted in the form of airborne noise through the openings, plumbing pipes,
or ventilation ducts.
For frequencies greater than the critical frequency of the element, the power Wk emitted by
that particular element k, with an area Sk, in the compartment receiver, can be determined by1:
k k k k cS v W 2 (7) Where: 2 k
v is the spatial average of the square of the velocity value of the normal vibration on the sample surface.
k is the radiation factor, around 1, for values above the critical frequency. Other values of
k can be determined based on Annex B of the standard3.
c is the characteristic impedance of the air. For a diffuse sound field we can writte4,5:
14 ) log( 10 V T L LRk wk (8) Where:
LRk is the sound pressure level in the compartment receiver due to radiation from element k
Lwk is the sound power level of radiation of the element k.
T is the reverberation time in the compartment Receiver.
V is the volume of the compartment receiver. It is assumed that: ) 10 10 log( 10
10
10 Rk Ai L L R L (9) 33 ) log( 10 10 log 10 10 log 10 12 2 12 k kk k vk k k Wk L S v cS w L (10)Being L the average vibration of the level element k, given by: vk ) 10 log( 10 18 2 2 2 2 1 n v v v L k k nk vk (11)
3. Tests performed
In order to validate the proposed method to determine the sound insulation between two com-partments, the following measurements between two adjacent compartments of a dwelling were performed. The noise emission was continuous and was placed in the transmitter compartment (do-decahedral sound source1):
Sound levels in the receiver compartment.
Reverberation time in the receiver compartment.
Vibration of the separator wall.
Vibration of the remaining elements of the receiver compartment connected with the separa-tor wall: interior wall, exterior wall, ceiling, Floor.
21st International Congress on Sound and Vibration (ICSV21), Beijing, China, 13-17 July 2014
The elements in analysis are incorporated in brick masonry (walls) and reinforced concrete (floor and ceiling), and the equipment used were as follows:
Sound level meter of class 1 da mark 01 dB, type solo.
Vibration analyzer of class 1 consists of accelerometer Dytran 3185D and analyzer Svan 946A.
3.1 Mounting the Accelerometer
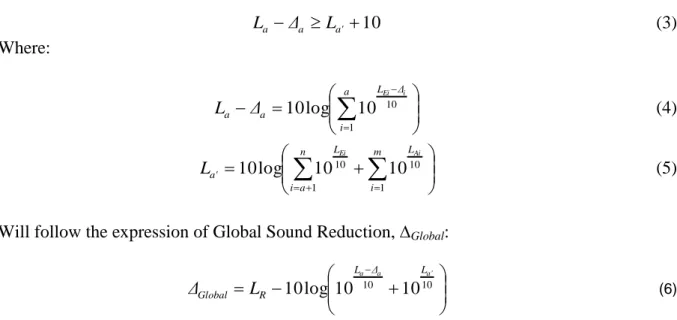
Once the best types of attachment of the accelerometers to the structural elements are "de-structive", such as fixation with screws or adhesives (cement and beeswax)6 and there is an obvious interest in the possible use of forms of non "destructive" fixation forms, we considered it appropri-ate first to make comparative measurements between a fixation with a screw, a fixation with a sim-ple tip and a simsim-ple fixing by hand.
Thus, a comparison of the Average Vibration levels of the center of the wall, in the frequency range 100 Hz to 3150Hz, for each of the three methods of mounting the accelerometer was made. The results obtained are presented in Figure 2.
20,0 30,0 40,0 50,0 60,0 70,0 80,0 90,0 100,0 100 125 160 200 250 315 400 500 630 800 1000 1250 1600 2000 2500 3150 Lv (d B) f (Hz) Band of 1/3 of octave
Fixation with srews Simple fixing by hand Fixation with a simple tip
V0 = 10^-9 m/s
2.69
5.17
CENTER
Figure 2. Results of the comparison of the three types of fixation of accelerometer
From the above graph we observe, for the frequency range of 100Hz to 3150Hz:
A "poor" agreement between the values obtained with the setting "Tip" and the values ob-tained with the fixing screw.
A "good" agreement between the values obtained with the "Hand" and the values obtained with the fixing screw. The reliability of this method of fixation was further confirmed by measurements performed on two more points of the same wall. Given this agreement, it was decided to use the setting "Hand" in the remaining vibration measurements.
3.2 Sound levels associated with vibration
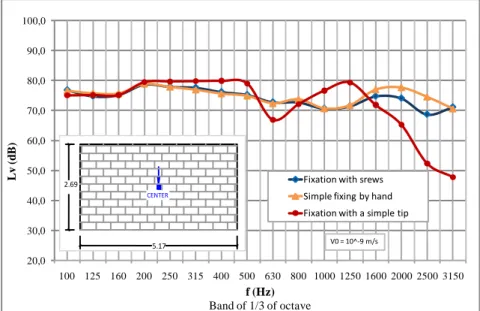
From the vibration measurements made in the separator wall and in the remaining elements of the receiver compartment, the results in terms of sound pressure levels, which are shown in Figure 3, were obtained.
21st International Congress on Sound and Vibration (ICSV21), Beijing, China, 13-17 July 2014 0,0 5,0 10,0 15,0 20,0 25,0 30,0 35,0 40,0 45,0 50,0 55,0 60,0 100 125 160 200 250 315 400 500 630 800 1000 1250 1600 2000 2500 3150 L p ( dB) f (Hz) Band of 1/3 of octave
Separator Wall Exterior Wall Interior Wall
Ceiling Floor Total
Figure 3. Results of the sound pressure Levels associated with the vibration of different elements
The analysis of figure 3, comes to:
A significant prevalence of the values associated with the separator wall, except for low fre-quencies, where we take on greater importance to the contribution from the ceiling and the floor.
Depending on the required sound reduction may be enough to intervene only in separator wall.
3.3 Sound insulation
The index of the sound insulation air measured is shown in Figure 4, and corresponds to a value of DnT,w = 38 dB, which does not comply with the legal limit of DnT,w ≥ 50 dB [2]. So, to
satis-fy an index of air sound insulation of 50 dB, it will be necessary to increase the insulation in about 12 dB (38 + 12 = 50). According to table 1, it is possible if (La – La´) 12 dB e a 22 dB.
According to table D.1 of the standart EN 12354-13, a plaster board with 12.5 mm, 44 mm air box and 25 mm of Rock wool, allows the improvement of sound insulation which is presented in table 2 (Rw = 18 dB) (original values in 1/1 octave, extrapolated to 1/3 of actave).
21st International Congress on Sound and Vibration (ICSV21), Beijing, China, 13-17 July 2014
Table 2. Improvement insulation with plaster board
Hz
100 125 160 200 250 315 400 500 630 800 1k 1.25k 1.6k 2k 2.5k 3.15k
- 2 - - 14 - - 23 - - 24 - - 19 - -
0 2 6 10 14 17 20 23 23 24 24 22 21 19 17 16
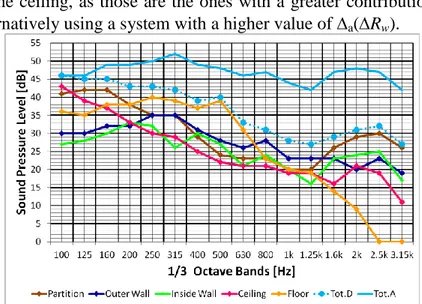
By applying this improvement of sound insulation only on the separator wall, results in the values given in Figure 5. With this method, an improved sound insulation DnT, w = 47 dB is ob-tained, thus not reaching the desired 50 dB (as a starting point, in which we should have a 22 dB and we have a = 18 dB). It is therefore also necessary to intervene in other elements, in particular the floor and/or in the ceiling, as those are the ones with a greater contribution to the overall per-ceived value, or alternatively using a system with a higher value of a(Rw).
Figure 5. Improvement of insulation the Air Sounds obtained
3.4 Comparison between the sound levels obtained from vibration and the sound levels measured
The sound levels predicted using the measurements of vibration and average noise levels measured in the compartment Receiver, using an unitary Radiation Factors to convert vibration of elements in sound, are shown in Figure 6 (left).
20,0 25,0 30,0 35,0 40,0 45,0 50,0 55,0 60,0 65,0 70,0 100 125 160 200 250 315 400 500 630 800 1000 1250 1600 2000 2500 3150 L p (dB) f (Hz) Band of 1/3 of octave Sound pressure obtained from vibration Sound pressure meter
20,0 25,0 30,0 35,0 40,0 45,0 50,0 55,0 60,0 65,0 70,0 100 125 160 200 250 315 400 500 630 800 1000 1250 1600 2000 2500 3150 L p (dB) f (Hz) Band of 1/3 of octave
Sound pressure obtained from vibration Sound pressure meter
Figure 6. Sound levels predicted from vibration and measured considered: left: an unitary radiation factor;
21st International Congress on Sound and Vibration (ICSV21), Beijing, China, 13-17 July 2014
According to figure 6 (left), the radiation factor for frequency bands below 315 Hz and above 1250 Hz appears to be overvalued, because the sound pressure levels obtained from vibration are higher than those measured with the sound level meter.
In order to minimize these discrepancies a different Radiation Factors, to convert vibration of elements in sound are estimated according with annex B of the standard EN 12354-13. The results of this analysis are shown in Figure 6 (right).
According to figure 6 (right), the Radiation Factors determined with the standard EN 12354-13 provides better results than an unitary Radiation Factors, in the frequency bands below 315 Hz.
4. Conclusions
Given the above, it is concluded that further developments are needed, especially for deter-mining the radiation factor variations depending on the frequency and on the type of element, and to compare the predictions with the final results after the intervention.
Despite the above, it is believed that what has been presented is enough to make clear the rel-evance of the difficulty of obtaining, by means of in situ measurements, the contribution and rele-vance of each one of the different structural and air paths, of sound propagation between a transmit-ter and a receiver, in ordinary buildings.
REFERENCES
1 International Standard, ISO 140-4 – Acoustics: Measurement of sound insulation in buildings and of building elements: Part 4: Field measurements of airborne sound insulation between rooms. 1998.
2
Portuguese Legislation: Diário da República Portuguesa – Decreto-Lei n.º 96/2008, de 9 de Junho. Regulamento dos Requisitos Acústicos dos Edifícios.
3
European Standard, EN 12354-1 – Building Acoustics: Estimation of acoustic performance of buildings from the performance of elements: Part 1: Airborne sound insulation between rooms. 2000.
4
European Standard, EN 12354-5 – Building acoustics: Estimation of acoustic performance of building from the performance of elements: Part 5: Sounds levels due to the service equip-ment. 2009.
5 International Standard, ISO 3382-2 – Acoustics: Measurement of room acoustic parameters: Part 2: Reverberation time in ordinary rooms. 2008.
6
International Standard, ISO 5348 – Mechanical vibration and shock: Mechanical mounting of accelerometers. 1998.