Departamento de Inform ´atica
Diana Manuela Pinto Barros
Classification and
Structure-Based Inference of
Transcriptional Regulatory
Proteins
Departamento de Inform ´atica
Diana Manuela Pinto Barros
Classification and
Structure-Based Inference of
Transcriptional Regulatory
Proteins
Tese de Mestrado
Mestrado em Bioinform ´atica
Trabalho efetuado sobre a orientac¸ ˜ao de
S ´
onia Carneiro
An ´alia Lourenc¸o
I’d like to thank my advisors, S´onia Carneiro, for all of the essential input, guidance and time she has conceded this work, otherwise impossible to develop and An´alia Lourenc¸o, for her valuable time and advices throughout this journey.
I want to give the biggest thanks to my family. To my parents, Fernando and Inˆes Barros for always believing in me and for giving me opportunities that weren’t given to them. Thank you for not giving up on me and for making me the person I am today. To my brothers, S´ergio e Pedro. You are examples of perseverance and success that I can only hope to achieve one day. To my grandparents, Maria da Conceic¸˜ao Silva e Ant´onio Ferreira Pinto for being the type of people I want to become some day and for being an example that I could always look up to. To my aunts: Em´ılia Pinto and Luz Pinto, my extra mothers, for being light in times of need and providing me the hope and strength when I had none left. I wouldn’t have made it this far without you.
I want to thank all my friends that have accompanied me throughout this adventure. A special thanks goes to Pedro Duarte, for the companionship and good moments, and to Gonc¸alo Silva, for all the understanding and support since the day we met. Finally to Jo˜ao Carvalho, your example guided me when our journeys met and what I have learned from you will accompany me along the way,
A very warm thanks to Catarina Veiga. You always bring out the best in me and believed me when no one else did. You have been the friend I needed and that was there for me in my darkest hours ever with an understanding word and call for reason.
Last but not least, I want to thank Fl´avio Rocha for the companionship, understanding and strength that he has provided me since our paths crossed. The help you have given me was determinant in the course of this work. You give me an extra something to fight for and you are a safe haven I know I can go back to, any time I need.
Transcription factors (TFs) are proteins that mediate the cellular response to the changes of the surrounding environment. Studying their functional domains and protein structure is fundamen-tal in order to gain insight of the way they are triggered and how they shape genetic transcription. The current work aimed for classifying both TFs and functional domains, understanding which features can be related to the different functions of the TFs.
By using UniProtJAPI, a JAVA library that allows remote access to UniProt, the information of 200 Escherichia coli’s (E. coli) TFs has been retrieved. This data was manually curated, in order to remove domain duplicates and other excess information, and to add missing domains.
The obtained functional domains were classified according to their molecular function, while the TFs were classified according to their regulatory function. TFs that exclusively induce gene expression were classified as activators, while TFs that only perform gene repression were clas-sified as repressors. On the other hand, TFs that perform both the activation and repression of transcription were classified as duals. The information was then analysed altogether in order to understand what relationships between the TFs’ function and functional domains could exist. Several analysis were performed, which include statistical tests and clustering methods. Along with the analysis of the full list of TFs, TFs that are part of two-component signal transduction systems and global TFs were given special focus, due to their important role in cellular function.
The results showed that there is a relationship between the functional domains and the regula-tory function of the different TFs. This may be related to the evolutionary relationships between repressors and activators. It is also understandable that dual regulators are closely related to ac-tivators and repressors than what acac-tivators and repressors are to each other. Moreover, TFs of two-component signal transduction systems are similar to each other, given that they perform similar functions. Their domain architectures are also predictable and do not vary from what was expected of these TFs. However, in global TFs the results are opposite of the ones obtained for two-component system TFs: their structures are very different from each other and each TF is specific. The amount of different domains is high when comparing to the full sample of TFs, since the number of domains exceeds the number of TFs. Domains of all classification types are present in their structure and the domain architectures are varied, which reflects their different activities within the cell.
Keywords: transcription factors, protein functional domains, Escherichia coli, regulatory function, two-component signal transduction systems, global TFs
Os factores de transcric¸˜ao (TFs) s˜ao prote´ınas que mediam resposta celular perante alterac¸˜oes do meio em que se inserem. Estudar os seus dom´ınios funcionais e estrutura proteica ´e fundamental para compreender a forma como as suas func¸˜oes s˜ao desencadeadas e como moldam a regulac¸˜ao da transcric¸˜ao. Este trabalho teve como objectivos a classificac¸˜ao dos TFs de acordo com a sua func¸˜ao, assim como a classificac¸˜ao dos dom´ınios funcionais.
Atrav´es do uso da UniProtJAPI, uma biblioteca de JAVA que permite o acesso remoto `a UniProt, foi recolhida informac¸˜ao de 200 TFs da Escherichia coli (E. coli). Estes dados foram curados manualmente, com o objectivo de remover dom´ınios duplicados e outra informac¸˜ao em excesso, assim como de adicionar dom´ınios em falta.
Os dom´ınios funcionais obtidos foram classificados de acordo com a sua func¸˜ao molecular, enquanto que os TFs foram classificados de acordo com a sua func¸˜ao regulat´oria. TFs que ex-clusivamente induzem a express˜ao gen´etica foram classificados como activadores, enquanto que TFs que apenas reprimem a express˜ao gen´etica foram classificados como repressores. Por usa vez, TFs que tanto induzem como reprimem a express˜ao gen´etica foram classificados como duais. A informac¸˜ao dos dom´ınios e dos TFs foi considerada como um todo de forma a compreender quais as poss´ıveis relac¸˜oes entre a func¸˜ao regulat´oria dos TFs e os dom´ınios funcionais. V´arias an´alises foram efectuadas, das quais testes estat´ısticos e m´etodos de clustering. Para al´em da an´alise de todos os TFs, foi tamb´em feita uma an´alise de TFs que fazem parte de two-component transduction systemse TFs globais, devido `a sua importˆancia na actividade celular.
Os resultados demonstram que existe uma relac¸˜ao entre os dom´ınios funcionais e a func¸˜ao regulat´oria dos TFs. Esta pode ter a ver com as relac¸˜oes evolucion´arias dos activadores e repres-sores. ´E, tamb´em, percept´ıvel que os reguladores duais relacionam-se com mais proximidade dos activadores e dos repressores do que os activadores e os repressores se relacionam entre si. Para al´em disso, TFs de two-component transduction systems tˆem estruturas semelhantes , uma vez que desempenham func¸˜oes idˆenticas. As duas arquitecturas de dom´ınios tamb´em s˜ao previs´ıveis e n˜ao variam do que era esperado. Contudo, para os TFs globais, os resultados s˜ao antag´onicos: as suas estruturas s˜ao diferentes umas das outras e cada TF ´e espec´ıfico. A quanti-dade de dom´ınios diferentes ´e elevada em comparac¸˜ao com a amostra completa de TFs, uma vez que o n´umero de dom´ınios excede o n´umero de TFs. Dom´ınios de todas as classificac¸˜oes est˜ao presentes na estrutura dos TFs globais e as arquitecturas de dom´ınios s˜ao variadas, o que reflecte as suas actividades espec´ıficas na c´elula.
Acknowledgements . . . v
Abstract . . . vii
Resumo . . . ix
List of Contents . . . xii
List of Figures . . . xiii
List of Tables . . . xv
Acronyms . . . xvii
1 I N T R O D U C T I O N . . . 1
1.1 Thesis structure . . . 1
1.2 State of the art . . . 2
1.2.1 Transcription Apparatus . . . 2
1.2.2 Elongation . . . 3
1.2.3 Regulation of Gene Expression . . . 4
1.2.4 Proteins . . . 7 1.3 Transcription Factors . . . 10 1.3.1 Transcriptional Activators . . . 12 1.3.2 Transcriptional Repressors . . . 13 1.3.3 Dual Regulators . . . 15 1.3.4 Global Regulators . . . 15
1.3.5 Two-component transduction systems . . . 17
1.3.6 Evolutionary Relationships and Transcription Factor Function Prediction 19 1.4 Objectives . . . 20
2 M E T H O D S . . . 21
2.1 Pipeline . . . 21
2.2 Data Mining . . . 21
2.2.1 Filtering the RegulonDB’s list of TFs . . . 22
2.2.2 Data Curation . . . 23
2.3 Classification of the Transcription Factors’s Function . . . 25
2.4 Domain Classification . . . 25
2.5 Inference Relating to the Function of Transcription Factors and Functional Do-mains . . . 26
2.6 Data Analysis . . . 26
2.6.1 Hierarchical Clustering . . . 26
3 R E S U LT S A N D D I S C U S S I O N . . . 29
3.1 Results Overview . . . 29
3.1.1 Data Curation . . . 29
3.2 Transcription Factors and Domains . . . 31
3.2.1 Transcription Factors’ and Domains’ Classifications . . . 31
3.2.2 Domains and Transcription Factor’s function . . . 32
3.2.3 Helix-turn-helix DNA-binding domains . . . 35
3.2.4 Transcription Factor’s Binding Sites and Transcription Factor’s Function 37 3.2.5 Domain Architectures . . . 40
3.2.6 Hierarchical Clustering . . . 41
3.3 Two-component transcription factors . . . 45
3.4 Global Regulators . . . 45
4 C O N C L U S I O N S A N D F U T U R E W O R K . . . 47
4.1 Conclusions . . . 47
4.2 Prospect for future work . . . 48
IA P E N D I C E S . . . 61
Figure 1.1 Operon and Promoter site . . . 3
Figure 1.2 Elongation and open complex . . . 4
Figure 1.3 Protein primary structure and amino acids’ bond . . . 8
Figure 1.4 Alpha-helix and beta-sheet schematic representation . . . 9
Figure 1.5 Protein tertiary structure: ADA enzyme . . . 9
Figure 1.6 Activator modus operandi - ATF/TFIID complex . . . 13
Figure 1.7 Lac Operon - LacI repression mechanisms . . . 14
Figure 1.8 TF’s repressions mechanisms . . . 15
Figure 1.9 Scheme that describes the basic two-component signalling transduction system . . . 17
Figure 1.10 Schematic representation of an orthodox histidine-kinase . . . . 18
Figure 1.11 Schematic representation of an hybrid histidine-kinase . . . 19
Figure 1.12 Schematic representation of a Response Regulator protein . . . . 19
Figure 2.1 General pipeline for the analysis of transcription factors and their do-mains. . . 22
Figure 2.2 Domain data processing scheme . . . 24
Figure 2.3 UniProt entry example: ChbR . . . 24
Figure 3.1 Number of TFs used to perform the different analysis . . . 30
Figure 3.2 Number of domains per transcription factor and results of the classifica-tion of the domains . . . 32
Figure 3.3 Percentage of domains that show a specificity according to the TFs’ functions . . . 33
Figure 3.4 Distribution of the percentage of the TFs’ functions with a specificity for activators or dual and repressors or dual. . . 34
Figure 3.5 Frequency of the binding sites . . . 39
Figure 3.6 Domain Architectures’ Analysis . . . 40
Figure 3.7 Hierarchical Clustering . . . 43
Table 1.1 Sigma factors and their functions . . . 7
Table 1.2 List of common protein motifs . . . 10
Table 1.3 Domain Classification . . . 11
Table 1.4 List of Global Transcription Factors . . . 16
Table 2.1 Domain Classification . . . 26
Table 2.2 Exemplifying binary data table . . . 27
Table 3.1 Classification of the transcription factors . . . 31
Table 3.2 Statistical analysis of the percentages of the regulatory functions of the TFs that have domains more specific to the structure of activators. 35 Table 3.3 Statistical analysis of the percentages of the regulatory functions of the TFs that have domains more specific to the structure of repressors. 35 Table 3.4 Domains that do not show any apparent specificity, regarding the TFs’ function . . . 35
Table 3.5 Analysis of the HTH DNA-binding domains’s structure with a higher specificity for repressors . . . 36
Table 3.6 Analysis of the HTH DNA-binding domains’ structure with a higher specificity for activators . . . 36
Table 3.7 Number of suggested clusters by each validation method . . . 41
Table 3.8 Hierarchical clustering results . . . 42
Table 3.9 Two-component TFs’ architectures . . . 45
Table 3.10 Global TFs’ architectures . . . 46
Table A.1 Transcription factors and respective structural domains . . . 63
Table A.2 Domains and their classification . . . 69
Table A.3 Analysis of the HTH DNA-binding domains’s structure . . . 73
T F Transcription Factor E. C O L I Escherichia coli B P base pairs A Activator D Dual R Repressor H K Histidine Kinase R R Response Regulatory D B D DNA-binding domain E N D Enzyme domain P I D Protein-interacton domain R E D Receiver domain
S M D Small molecule-binding domain U N K Unknown function
σ -F A C T O R sigma factor
1.1 T H E S I S S T R U C T U R E
This document is organized by the following structure: Chapter 1
Introduction
State of the art, exposure of the motivation and objectives, and presentation of the dissertation’s structure. Brief introduction to the concepts covered in this analysis: the genetic transcription process in prokaryotes; background of the structure of proteins, definition of transcription factors and their importance for the regulation of gene expression.
Chapter 2
Material and Methods
Overall presentation of the work’s pipeline and strategies used for information acquisition. Meth-ods used for automated data retrieval, strategies adopted for data curation. Explanation of the rules for classification of the transcription factors and functional domains. Exposure of the dif-ferent analysis for inference of the relation between the TF’s regulatory function and protein domains.
Chapter 3
Results and Discussion
Exposure of the obtained results, using the different types of analysis explained in Chapter 2. Discussion of the most relevant results and correlation with what has been previously described in the literature. Discussion with an insight of the problems faced and respective solutions.
Chapter 4
Conclusions and Future Work
Final remarks and conclusions drawn, as well as explanation of the limitations encountered in the course of this work. Proposals of future work, both in order to improve the results obtained and to widen borders for the study of other organisms,
1.2 S TAT E O F T H E A R T
Escherichia coli(E. coli)is the most well studied prokaryote, with 4288 annotated genes coding for proteins [1] in the K-12 strand. The amount of information available in on-line databases about E. coli, makes it a preferable target of study and it’s used as a model in the microbial studies. Unlike in eukaryotes, bacterial DNA is normally organized in a circular chromosome.
In prokaryotes, genetic transcription varies from eukaryotes: translation in prokaryotes oc-curs simultaneously with transcription, while in eukaryotes, the mRNA needs to mature and only later it is translated. In prokaryotes, the transcription units are polycistronic and in eukaryotes they have only one gene [2].
In the course of the present work, prokaryotic mechanisms of genetic transcription are ad-dressed and E. coli K-12 is used s the organism of study.
1.2.1 Transcription Apparatus
Gene expression in prokaryotes is the process which allows the cell to use the information stored in genes for a certain purpose. One of the stages of gene expression is the transcription, in which DNA is transcribed into RNA [3]. Since the proteins we are studying are regulators of transcrip-tion, understanding the transcription process is fundamental in order to gain insight of how they act and regulate it. In prokaryotes, gene transcription can be divided, in a simple way, in three stages: initiation, elongation and termination.
Initiation
For transcription to begin, a few specialized molecules are required: RNA polymerase and a sigma unit (also known as sigma factor (σ)). RNA polymerases synthesise RNA from DNA sequences and, when ready to initiate transcription, it consists of two main elements: the core enzyme and the sigma unit [4]. The core enzyme is responsible for the RNA synthesis, while the sigma factor recognizes and binds to the promoter region of the DNA, being, therefore, abso-lutely necessary for the initiation of transcription. The core enzyme and sigma unit all together are referred to as holoenzyme.
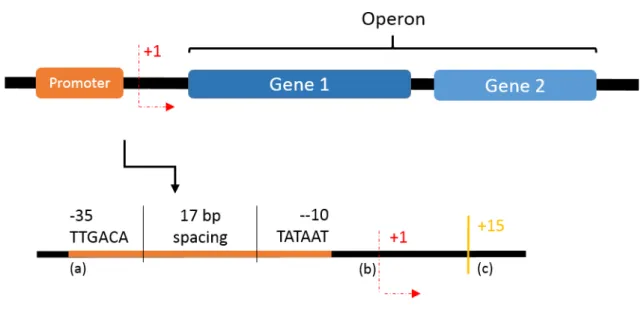
The region to which the sigma factor binds is called the promoter and usually appears upstream of the genes and the starter site. A classic promoter structure is shown in figure 1.1 (a). It has two specific sequences of 6 base pairs (bp) that are about 17bp from each other. Both the conserved sequences and the spacing between them are very important for the sigma unit binding affinity
[2]. The site where transcription begins is referred to as the starter site and is at the ”+1” position (fig. 1.1(b)).
Although we show a classic promoter structure, their nucleotide sequence often varies, which affects the RNA polymerase binding affinity and interferes with the frequency with which initia-tion of transcripinitia-tion occurs [5].
When the holoenzyme binds to the promoter sequence, a ”closed complex” is formed and the hydrogen bonds between the nucleotides start to be broken, creating an ”open complex”.
In E. coli, genes that code for proteins that participate in related functions and, therefore, must be transcribed at the same time, are often grouped in operons (fig.1.1, which are groups of genes that share the same promoter site [6]).
Figure 1.1: General scheme of an operon and promoter site. The promoter (a) consists of two specific sequences that are about 17bp apart; (b) Starter site is where the transcription begins; (c) Site where the sigma factor releases from the RNA polymerase.
1.2.2 Elongation
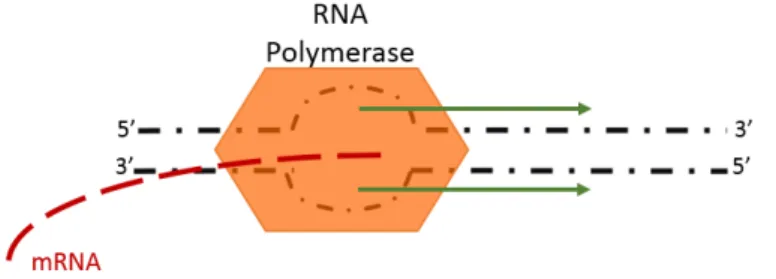
After the formation of the open complex (fig.1.2), transcription begins in the +1 site, which marks the start of the elongation process. After the transcription of about 15 nucleotides (figure 1.1 (c)), the sigma unit releases from the RNA polymerase which continues the transcription on its own [7]. During elongation, polymerization occurs and a molecule of mRNA is created.
Figure 1.2: Elongation and open complex. After binding to the DNA sequence, the holoenzyme forms an open complex, by breaking the hydrogen bonds between nucleotides. The RNA polymerase continues transcription with the open complex in the 5’ to 3’ direction.
Termination
In prokaryotes, there’s two kinds of termination: Rho-independent and Rho-dependent.
In the Rho-independent termination, also known as intrinsic termination, elongation continues until it finds a terminator sequence that has inverted nucleotide repeats. This sequence, after transcribed, forms an hairpin loop structure in the RNA which is highly destabilizing. After the sequence of inverted repeats, a string of adenines follows, which are transcribed to uracils in the mRNA molecule. The weak bond between the uracils and adenines along with the destabilizing hairpin cause the RNA/DNA complex to break, the mRNA molecule is released and transcription is complete.
The Rho-dependent transcription requires a special enzyme, Rho, an helicase that can unwind RNA/DNA complexes in the presence of ATP and hydrolysis [8]. Rho binds to a specific region in the mRNA molecule, destabilizes the open complex and the RNA is released [9, 10].
1.2.3 Regulation of Gene Expression
For living organisms to survive, they must sense the environment that surrounds them and be able to respond and adapt their ways when there are changes. Single-celled organisms such as E. coliare particularly exposed and sensitive to the alteration of their surroundings. For instance, E. colican grow in several different substrates but in order to do so, it must first sense the resources available externally to produce the required enzymes for product catalysis [11, 6]. Not only this is important for absolute cell survival but also for using the available cell energy in an optimal way, since protein synthesis is expensive energy-wise [5]. It is important to understand that not all genes are expressed at all times in a cell, in fact, only a fraction is expressed at a given time. Some of the genes, however, code for essential proteins and enzymes required at all times in the cell to perform basic functions. These are called housekeeping genes and are expressed at some
frequency at any given time. This frequency may change and vary according to the cell’s growth rate [12].
Gene expression may be controlled at many levels, in a general way, pre and post transcription. Pre transcription regulation controls the rate in which transcription occurs or if it occurs at all. In this chapter we will be addressing some of the regulation types found in bacteria and in particular, E. coli.
First of all, transcription factors are proteins that modulate the beginning of transcription to certain stimuli [13]. Moreover, sigma factors play a crucial role when it comes to gene regulation, since different sigma factors have relative specific functions, according to stimuli response. As transcriptions factors are the main topic of this thesis and sigma factors are known to work together with transcription factors in pre-transcription regulation, both will be approached with more depth later on.
In the regulation of gene expression there are also certain molecules that function as signals and trigger responses in the cell [14]. These signalling molecules are, for example, cyclic-AMP (cAMP), cyclic GMP (cGMP) and calcium (Ca+2). cAMP is synthesised from ATP in low glu-cose systems and regulates not only catabolite and nitrogen regulation but also flagellum synthe-sis and biofilm formation, among others [15, 16]. cGMP is often related to regulation of cellular apoptosis, ion channel conductance and in glycolysis [17]. On the other hand, Ca+2 ions are known to be activators of enzymes such as protein kinases, ion channels, among others.
Another type of regulation is made by small non-coding molecules of RNA (sRNA) which act post-transcription [18]. They act as regulators on cell’s development, cell death and chromo-some silencing in eukaryotes. In prokaryotes, they are also known to pair with mRNA, which results in changes to the mRNA’s stability and in the translation process [19].
Lastly, and to conclude the post transcriptional regulation mechanisms, (in this case post translational, more specifically) we find the control of the protein’s stability and folding. This last step controls the concentration of certain proteins within the cell or simply activates or deactivates them, changing their conformation. This process is carried out by ATP-dependent proteases and chaperones [20].
Sigma factors play an important role in gene expression regulation, since they allow the RNA polymerase to bind to specific regions in the DNA [21]. In Escherichia coli, seven different sigma factors have been found and , in bacteria, they are known to play roles according to certain environmental stimuli [13].
majority of the sigma factors and the σ54 family. The σ70 family binds specifically to the -10 and -35 elements to form the closed complex, whereas the σ54 has more affinity for recognition sequences in the -24 and -12 positions upstream of the transcription start site [22, 23]. The
σ54 unit is distributed widely across different bacteria species and its role is connected to the
regulation of genes involved in nitrogen metabolism. Although there are many members of the
σ70 family (six in E. coli), two genes encoding for different sigma units of the σ54 family are
rarely found in the same organism [24, 25, 26]. Also, while σ70 binds to the RNA polymerase and transcription can be started right away, for transcription to initiate, the holoenzyme formed by the RNA polymerase and σ54mandatorily requires the presence of a cognate activator protein. This allows a tighter and more specific control of gene expression in the cell [27]. The σ70 is known to regulate the transcription of genes encoding proteins that participate in housekeeping activities, and σ54 regulates the genes related with the nitrogen metabolism.
The σ19 is a sub-family of the σ70 and is responsible for the initiation of transcription of genes that participate in ancillary functions, in this case, ion transport and iron uptake [28]. It is coded in the FecI gene which was first thought to transcribe a protein that regulated the genes involved in the transport of ions, but later, given the similarities to the σ70 it was found to be a sigma factor.
The σ28, expressed be the FliA gene, is also a subfamily of the σ70. In several species of bacteria it is not only responsible for the regulation of the transcription needed for flagella synthesis [29, 30] but also contributes for other functions such as sporulation and agarase production in Streptomyces coelicolor[31].
When the environment’s temperature rises abruptly, cells must respond and the production of heat shock response proteins is induced [32]. The initiation of transcription of these genes is dependent of the σ32 that is coded in the HtpR gene [33, 34, 35]. It belongs to the σ70 family of sigma units and its regulated genes are thought to also be expressed in other stress conditions, other than heat shock.
The σ38, also known as σS, is a sigma factor known to be related to the response to stationary phase in E. coli, as well as carbon starvation. It was also shown that the transcription of σ38’s coding gene, RpoS and its own activity increase under osmotic shock conditions, heat and low pH [36, 37, 38, 38].
Table 1.1: Sigma factors and their functions
σ19 Ion transport
σ24 Extreme temperature response σ28 Flagella genes regulation σ32 Heat shock response
σ38 Stationary phase / carbon starvation σ54 Nitrogen regulation
σ70 House keeping genes regulation
1.2.4 Proteins
Proteins are macromolecules essential to organism’s structure that are composed of at least 20 amino acids linked together. Most proteins have amino acids that range between 100 and 1000 in number [2]. E. coli can synthesise all of the amino acids it needs, however this is not a char-acteristic intrinsic to all organisms. For example, human beings are only capable of producing a little over 50% of the amino acids they require, having to obtain the remaining from breaking down ingested food [39].
Besides being responsible for the cells’ structure, proteins also perform most of the cellular tasks. They may function as sensors that detect extra-cellular changes in light, temperature, carbon sources’ concentration among other biotic and abiotic factors [2]. Proteins can transport other molecules from different compartments within the cell or even from the extracellular to intracellular environment. They can also have enzymatic properties which mediate reactions that otherwise wouldn’t occur [40] and they regulate the gene transcription.
Here, transcription factors (TFs) gain importance and will be the main focus of the present study. TFs are proteins that sense certain stimuli and trigger or inhibit gene transcription. These will be addressed with more detail in the Transcription Factors chapter later in this work.
A fully functional protein has a 3-dimensional (3D) structure that is stabilized with covalent bonds, which is the key to study their function. 4 different levels of protein structure organization are considered.
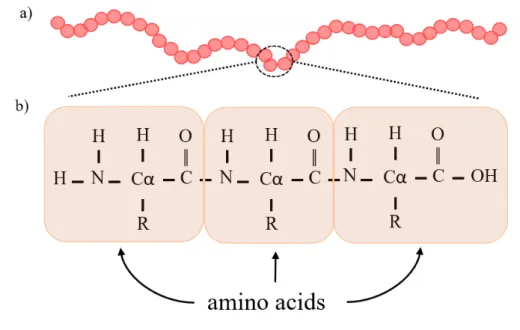
The primary structure of a protein is simply the amino acid sequence that composes it. The sequence consists of amino acids bond by peptide bonds and is usually referred to reading from its N-terminal end to the C-terminal (figure 1.3).
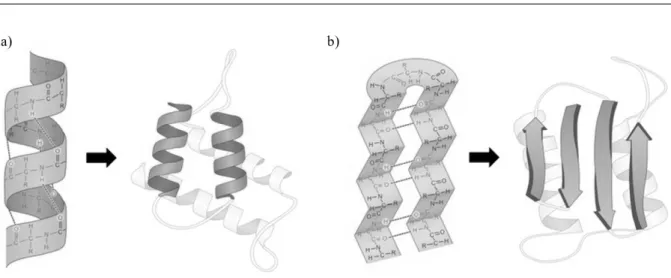
The secondary structure of proteins refers to local 3D conformations that are stabilized by hydrogen bonds ??. The most common structures formed by this stabilization are alpha-helices
Figure 1.3: Protein primary structure and amino acid’s bond. a) represents a protein structure, where each circle is an amino acid; b) example of how amino acids bond to each other in a polypeptide. Every amino acid has ans amino group in one end and a carboxyl group in the other end. The R represents a side chain different in every amino acids that defines their unique structure.
(α-helix), beta-sheets (β-sheet), U turns and loops. The last two usually link other secondary structures [41]. In α-helices, the amino acids are stable in a spiral shape with the side chains facing outwards and are usually represented by spirals (figure1.4 a)). The β-sheets’s strands (figure1.4 b)) are orientated and, if consecutive strands are facing the same way, they are called parallel, while if they are facing opposite ways, they are called anti-parallel.
While the secondary structure of a protein refers to local arrangements of the amino acids, the tertiary structure refers to the overall protein shape and the arrangement of the secondary structures relating to each other [2]. Also, unlike the secondary structure, the tertiary is not de-fined by local stabilizations. The residues within a protein can be hydrophobic or hydrophilic and the arrangement of these regions, along with hydrogen and peptide bonds, forms a protein structure that makes it more compact and stable. For instance, in globular proteins, the hydropho-bic regions often form a core in the center while the hydrophilic and remaining charged residues are exposed in the outer layers. The tertiary structure of a protein is what confers its function and its variation has consequences in its protein functionality. This process of 3D arrangement is called protein folding and is assisted by protein chaperones, that help with the folding, but also can unfold other proteins [43]. Many techniques to predict the tertiary structure of a protein have been developed and there are many ways of representing it, depending on the objective of the study (figure 1.5).
Figure 1.4: a) alpha-helixes are usually represented by spirals, while beta-sheets b) are represented by arrows. Adapted from [42]
Figure 1.5: Tertiary Structure of E. coli’s DNA repair ADA enzyme. The tertiary structure can be repre-sented in many ways depending on the objective of the study. a) ADA protein’s structure in a ”ribbon” representation. It emphasizes the secondary structures: the α-helices are coloured magenta, and the β-strands are coloured yellow. b) ADA protein’s molecular surface; c) ADA protein represented by the atoms composing it. Different elements are coloured differently. Adapted from [44]
Specific combinations of secondary structures within a tertiary structure can be identified and are referred to as motifs. The most common motifs within a protein’s structure can be seen in table 1.2.
When a motif or a set of motifs are associated with a specific molecular function, they are referred to as protein domains. These are of particular importance for the present work and will be addressed in a different section within this chapter with more depth [2].
Table 1.2: List of common protein motifs and the secondary structures that form them. Adapted from [2]
Motif Secondary structures Helix-turn-helix α-helices connected by turns
Helix-loop-helix α-helices connected by turns
Beta hairpin Two β-sheets linked by a turn
Zinc Finger One α-helix and two β-sheets form a structure held by a zinc ion Beta barrel Beta sheets coiled anti-parallel to each other
Finally, the protein quaternary structure refers to arrangements of multiple 3D protein units that function together. For instance, these protein complexes can be associations between pro-teins and DNA polymerases or ion channels [45].
Protein Domains
Protein domains are motifs or groups of motifs that have individual functions beside of the re-maining protein structures. Domains can be grouped according to their molecular function (ta-ble1.3). DNA-binding domains (DBD) are domains that bind to nucleic acids and, in the case of TFs, are generally comprised of, among other secondary structures, an helix-turn-helix motif [46]. Enzyme domains (END) are domains with enzymatic functions, examples are ATPases, dehydrogenases, reductases, etc.. Protein Interaction Domains (PID) are domains within the protein that interact with other proteins and may perform oligomerization reactions. Receiver domains (RED) are phosphorylated (receive a phosphate group) by histidine kinases and are part of the structure of TFs of two-component signal transduction systems. Small molecule-binding domains (SMD) simply serve for the binding of small molecules such as ions.
The study of these domains is important for the determination of a TF’s function in the cell, how they receive the signal and how the response is triggered.
1.3 T R A N S C R I P T I O N F A C T O R S
Transcription Factors (TFs) are proteins that bind specific DNA sequences and control the scription of genes. This is a critical step, as it is the first stage in the regulation of gene tran-scription [47]. A typical TF in E. coli is a ”two-headed” molecule (with two functional domains) [48], where one end binds to DNA and the other receives a stimulus, either binding to another protein, metabolite or sensing abiotic changes in the mean. TFs have functional domains that
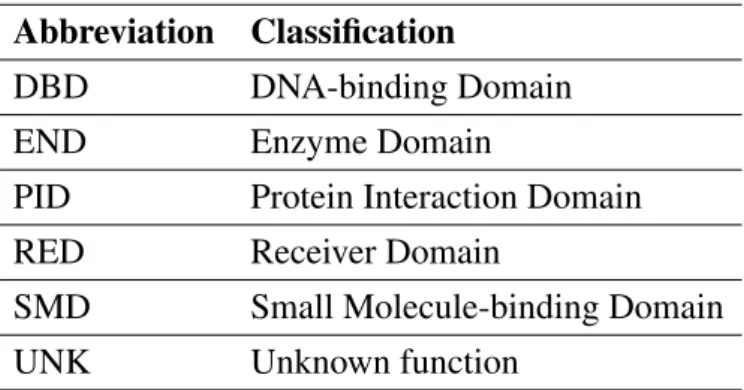
Table 1.3: Domain classification according to their molecular function. DNA-binding domains (DBD); enzyme domains (END); protein interaction domains (PID); receiver domains (RED); small molecule binding domains (SMD) ; domains with unknown function (UNK).
Abbreviation Classification
DBD DNA-binding Domain END Enzyme Domain
PID Protein Interaction Domain RED Receiver Domain
SMD Small Molecule-binding Domain UNK Unknown function
bind covalently or suffer allosteric changes, binding to other molecules or ions [49, 50, 51]. As the concentration of metabolites varies, they bind to TFs, activating or deactivating them, which inhibits or represses transcription of certain genes, [52].
Kazuyuki Shimizu [6] divides E. coli TFs in three categories: external (the TF senses extra-cellular signals), internal (the TF senses intra-extra-cellular signals) and hybrid, depending on their signal inputs.
The extra-cellular triggers sensed by external TFs may be nutrients’ concentration, such as car-bon, nitrogen or phosphate, may be chemical elements, like oxygen, minerals, protons, metals or other ions, and may even be changes in growth conditions, such as pH, light and temperature. These signals all read differently and feed into the transcriptional regulatory cascades, which cause both physiological and morphological changes in the cell and enable it to adapt, [48]. Even for the most well studied organism to date, some of the signals that trigger specific physi-ological responses remain unknown [53, 54]. Here, two-component signal transduction systems gain importance and will be addressed later in this work.
Internal TFs detect metabolites located in the intra-cellular space that give information on the cell’s state. These metabolites can be of various types such as sources of energy or co-factors for specific enzymes [52].
Lastly, we find hybrid TFs, that are classified as such simply because they sense molecules that can either be captured by the cell in the external mean and incorporated internally or produced endogenously. This often happens in pathways involved in amino acid synthesis, since it is more cost effective for the cell to import metabolites than actually producing them itself [48].
Another type of TFs classification is based on their actual function when it comes to gene reg-ulation and this is the one that we will be further focusing in thesis. In literature, we
traditio-nally find two divisions: activators (or positive regulators), and repressors (negative regulators) [47, 55, 56, 57]. In this work, an extra division to the classification is added. TFs that exclusively induce gene activity are classified as activators. The same goes for repressors, as solely TFs that only repress gene expression are considered as such. On the other hand, TFs that perform both genetic transcription induction and repression, are classified as duals.
1.3.1 Transcriptional Activators
Activator TFs are proteins that positively regulate the initiation of transcription through the means of several mechanisms. Activators are likely to act by interacting with other actors in transcrip-tion [47], either the RNA polymerase itself [58] or other specific molecules.
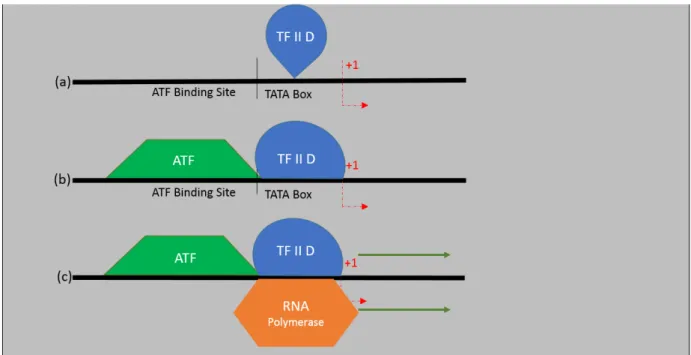
Case of study: ATF/TFIID activation complex
A transcriptional system (ATF/TFIID) that requires an activator is represented in figure 1.6. TFIID is a TF that binds directly to the TATA box found in the promoter region of the DNA (fig. 1.6 (a)) but is unable to reach the transcription starter site alone [59]. The ATF factor (an activator protein) is required for this to happen, as it bounds to a specific DNA region and changes the conformation of TFIID, allowing it to bind both to the TATA box and the transcription starting site. This said, the RNA polymerase is then able to bind the promoter region of the DNA to form a stable complex and transcription begins [60]. In this example, we have two TFs that depend on one another to activate transcription. This type of systems allows a better tuning and accurate control of transcription.
Figure 1.6: Activator modi operandi - ATF/TFIID complex. TFIID complex binds to the TATA box region found in the promoters (a). TF ATF found in mamals is known to bind to a specific DNA region and contacts the TFIID complex. This changes the conformation of TFIID (b) and makes it bind both to the TATA box and the starter region. This allows the binding of the RNA polymerase and transcription begins (c). Later on, the ATF unbinds and the transcription continues with the TFIID/RNA polymerase complex alone [60]. Adapted from [47]
1.3.2 Transcriptional Repressors
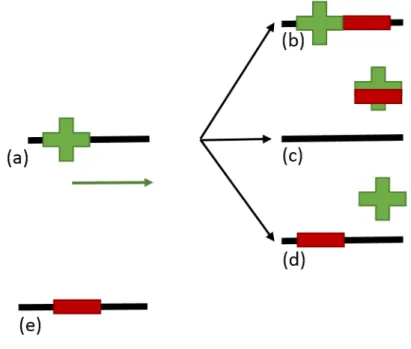
Repressors are TFs that function in order to repress or block the transcription of specific genes. As in activators, they can function in various ways [61, 62], as represented in figure 1.8: in (a) there is a transcriptional activator binding to the activation site and transcription is ready to begin as soon as the RNA polymerase binds to the promoter site; in (b) the repressors binds downstream of the activator, stopping the RNA polymerase to bind; in (c), the repressor binds to the activator, changing its conformation, which keeps the activator from binding to DNA; in (d) the repressors competes with the activator for the DNA binding site and binds to it, preventing the activator to bind; and finally, in the (e) case, there’s direct repression: the repressor simply binds to a repressing site and transcription doesn’t occur [47]. One of the best repression mechanisms ever studied is the control of the Lac operon in E. coli.
Case of Study: Lac Operon
Glucose is the preferred carbon source in Escherichia coli, since the breakdown of other compounds requires extra enzymes and pathways, which it less cost-effective [5]. The Lac operon contains genes that encode for enzymes required for lactose catabolism. In the ab-sence of lactose the expression of this operon is silenced, since the cell has no need of such molecules. The responsible repressor is LacI, that in the absence of lactose binds to the operator site of the Lac operon and inhibits the beginning of transcription [63] (fig 1.7 a)). However, in the presence of lactose, allolactose is produced and binds to LacI, (fig 1.7 b)) changing its conformation, preventing it from binding to the operator, which enabled the expression of the genes of the Lac operon [64].
Figure 1.7: Lac Operon - LacI repression mechanisms. In the absence of allolactose, LacI binds to the operator, preventing the formation of the open complex and preventing the beginning of transcription [63]. In the presence of lactose, alolactose forms a complex with LacI, changing its conformation and preventing to bind to the operator, allowing gene transcription to occur.
Figure 1.8: TF’s repressions mechanisms. (a) the repressor is not acting, the activator connects to the DNA and the transcription begins; in (b) the repressor b binds downstream of the activator; (c) the repressor connects to the activator, preventing its bind with the DNA; (d) the repressor binds to the site where the activator would bind; (e) the repressor simply binds to a repressing site. In all of the cases (b), (c), (d), (e), transcription can’t begin. Adapted from [47].
1.3.3 Dual Regulators
Here, TFs that aren’t either exclusively activators or dedicated repressors are considered dual. These can both activate or repress the same gene, function as activators for one gene and as re-pressors for another one or even the two combined.
1.3.4 Global Regulators
Global regulators have a pleiotropic phenotype and may regulate genes that belong to different metabolic pathways [65]. Global TFs regulate many genes (a larger number than those not con-sidered global), which results in them being transcribed uncoupled from the genes they regulate, an uncommon feature in regular TFs. They are also capable of sensing a larger number of stim-uli. Genes regulated by global regulators are usually co-regulated by other specific TFs, which allows the cell a more specific gene regulation [66].
The TFs that are considered global regulators are: CRP, H-NS, FNR, FIS, IHF, ArcA, LRP, MLC, NarL, FUR, CspA [67, 46, 66]. These TFs are associated to a more or less specific stimulus and response 1.4, however, they co-regulate genes along with other TFs with very wide range of metabolic responses. CRP, for instance, CRP is the global F that regulates more TFs [66] and, besides the response to carbon availability, it is involved in many other processes and different metabolic pathways and compound biosynthesis [68].
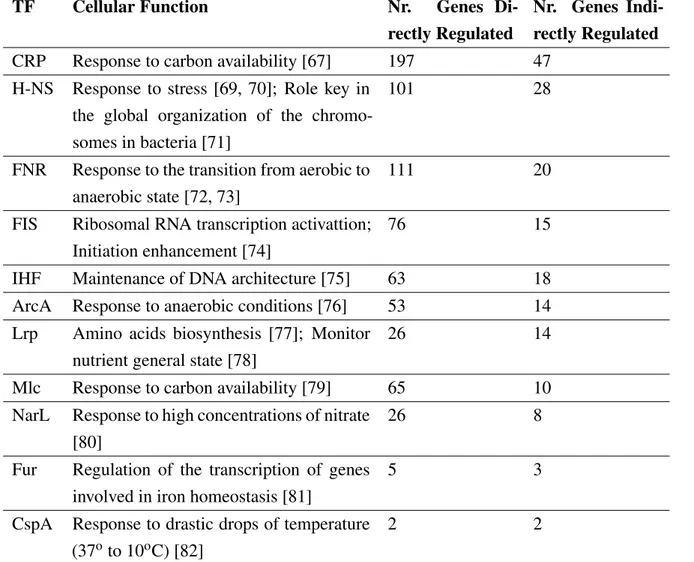
Table 1.4: Global Transcription Factors’ List. TF refers to the global TF; Cellular Function refers to the main stimuli and responses of the TF; Nr Genes Directly Regulated refers to the number of genes that the TF regulates; Nr Genes Indirectly Regulated refers to the genes that the TF co-regulates along with other TF(s). Adapted from: [66].
TF Cellular Function Nr. Genes Di-rectly Regulated
Nr. Genes Indi-rectly Regulated CRP Response to carbon availability [67] 197 47
H-NS Response to stress [69, 70]; Role key in the global organization of the chromo-somes in bacteria [71]
101 28
FNR Response to the transition from aerobic to anaerobic state [72, 73]
111 20
FIS Ribosomal RNA transcription activattion; Initiation enhancement [74]
76 15
IHF Maintenance of DNA architecture [75] 63 18 ArcA Response to anaerobic conditions [76] 53 14 Lrp Amino acids biosynthesis [77]; Monitor
nutrient general state [78]
26 14
Mlc Response to carbon availability [79] 65 10 NarL Response to high concentrations of nitrate
[80]
26 8
Fur Regulation of the transcription of genes involved in iron homeostasis [81]
5 3
CspA Response to drastic drops of temperature (37oto 10oC) [82]
1.3.5 Two-component transduction systems
Since micro-organisms have little ability or means to control the environment they are inserted in, they must have a very efficient way to respond to its changes. The environmental conditions and their shifts are sensed by bacteria by sophisticated signalling systems usually called the two-component signal transduction system. This system unfolds into a cascade of chemical reactions, since the stimulus is received, until there is an actual cellular response to the given situation.
The two-component signal transduction system was first described in bacteria and only re-cently found in eukaryotes, although in only a limited variety of organisms (fungi, slime molds and plants) [83, 84].
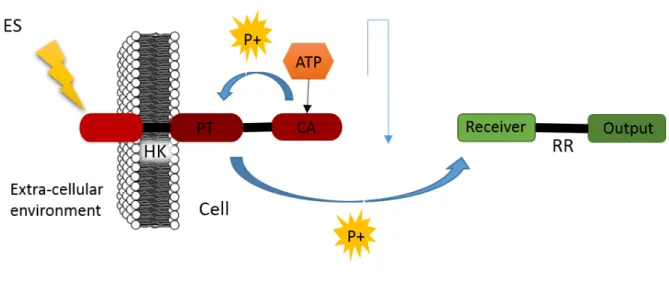
Two-component signal transduction systems require two main proteins to function, the histi-dine kinase and the response regulatory protein (fig.1.9). In a general way, the histihisti-dine kinase (HK) receives a stimulus, and its catalytic ATPase domain (CA) binds to an ATP molecule and then auto-phosphorylates an histidine domain. The phosphotransferase domain then phosphory-lates the Response Regulatory protein (RR), in the receiver domain. This protein has also an output domain that is activated by the RR’s phosphorylation and gives the desired response to the stimulus. It is usually a DNA-binding domain but this function may vary. The structure and function of the HK and RR will be further explained in the domains analysis’ subsections [85, 86]. The control of these pathways is achieved by the ability of the HK to regulate the phosphorylation of the RR downstream [87].
Figure 1.9: Scheme that describes the basic two-component signalling transduction system. The histidine kinase (HK) receives a stimulus (ES), which triggers its ATPase domain (CA) to bind to a ATP molecule and to dephosphorylate and histidine residue. The phosphotransferase domains (PT) then transfers the phosphate group to a response regulatory protein (RR), to its receiver domain. The RR has an output domains that mediates the desired response to the given stimulus.
Kinases
Histidine Kinases are transmembrane proteins that act as dimers. They usually have extra-cellular sensory input modules that receive the signals [86]. In typical systems, HKs monitor external stimuli and environmental changes and pass this information to the RR domains, by a phosphory-lation process [87]. The phosphoryl group is obtained by dephosphoryphosphory-lation of an ATP molecule and the whole process is dependent on this.
The HKs can be divided in two major groups: the orthodox (or type I) (fig.1.10) and the hy-brid type (type II) [88]. The latter are part of a variant of the two-component signal transduction system, called the phospho-relay system. In prokaryotes, hybrid histidine-kinases are rare, for example, of the Escherichia coli’s thirty documented HKs, only five are hybrid. On the other hand, in the eukaryotic beings known to have HKs, the great majority of these proteins are hy-brid, and specific sequences distinguish eukaryotic from prokaryotic systems. This leads us to believe that eukaryotic HKs and RRs evolved from a single prokaryotic branch [87].
The schematic representation of an orthodox histidine kinase can be seen in figure 1.10. This representation comprises all the possible domains that an HK of this type may contain, although, different HKs may lack one or more of these boxes [89].
Figure 1.10: Schematic representation of an orthodox histidine-kinase. The H box (H) is an histidine residue that gets phosphorylated. The remaining blocks are conserved amino acid sequences. The G boxes are glycine rich and are thought to be nucleotide binding sites and to have kinase and phosphatase activities. It is described by [90, 91] that the latter 4 boxes (N, G1, F, G2) are the most invariant in the HK’s structure and constitute a cavity where the ATP binds.
The hybrid type histidine-kinases differ from the orthodox type by containing a response regulator domain attached to themselves and an extra Histidine region (HPt domain) (fig.1.11). They may contain several phosphoryl receiver and donor domains and, unlike their orthodox relatives, they promote multiple phosphoryl transfers [87].
Response Regulatory proteins
Response Regulator proteins (RR) can usually be found in the end of the cascade of the phos-photransfer pathways [92]. They are constituted by two or more domains. One of the domains is fully conserved in all response regulators and has aspartate and lysine residues, called the re-ceiver domain (RD). This domain, located towards the N-terminal area of the protein, receives
Figure 1.11: Schematic representation of an hybrid histidine-kinase. The H box (H) is an histidine residue that gets phosphorylated. The remaining blocks are conserved amino acid sequences. The G boxes are glycine rich and are thought to be nucleotide binding sites and to have kinase and phosphatase activities. It is described by [90, 91] that the latter 4 boxes are the most invariant in the HK’s structure and constitute a cavity where the ATP binds. The RR domain is exclusive to the hybrid kinases and mimics the function of the RR protein. HPt is a histidine phosphotransferase domain.
the phosphoryl group from the correspondent HK and its phosphorylated/ dephosphorylated state controls the activity of the next domain. RR can perform auto-phosphatase activities that limit the duration of its activity. The lifetime of the RR activity varies according to its physiological function and may range from seconds to hours of duration [92].
The following domain is variable and may be a DNA-binding domain, a RNA binding domain, a protein binding domain, or have an enzymatic activity [93]. When the non-conserved domain is a DNA-binding one, it is a response regulator protein, in which case the response to the stimuli is translated into gene expression [94]. In response regulators, the DNA-binding domain can be divided in three families, depending on its structure: those who have helix-turn-helix domains, four helix domains or couple ATPase domains.
As can be seen in figure 1.12, RR may have additional domains other than the ones referred above that have specific and variable functions. For example, RRs that interact with specific sigma factors that have ATPase domains [94].
Figure 1.12: Schematic representation of a Response (transcriptional) Regulator protein. RED - Receiver Domain; DBD - DNA-binding domain; VD - Variable domain. Many RR may have additional domains with specific functions. [94]
1.3.6 Evolutionary Relationships and Transcription Factor Function Prediction
Prag G. et al [95] defined two rules when studying a sample of E. coli’s TFs: in repressors, the HTH DNA-binding domain would always appear in the N-terminus; in activators, the HTH DNA-binding domain would appear both in the N-terminus and C-terminus, which is supported
by P´erez-Rueda H. et all [96]. They have also found that ancestral repressor molecules resulted from the fusion between sequences that coded for DNA-binding motifs big enough to block the action of the RNA polymerase and sequences coding for a response motif. This fusion resulted in the formation of a molecule that was able to respond to a certain stimulus and block the beginning of transcription. More, they suggest that activators that have the DNA-binding domain towards the N-terminus may have evolved from these repressors, while the activators where the DNA-binding domain is located in the C-terminus evolved differently.
Previous work [96, 97] has led to the conclusion that the transcription binding sites inherent to each TF could be indicative of it’s function: all the activators would bind upstream from the transcription start site, while in the case of the repressors, only about two thirds showed to bind upstream from the transcription start site, the remaining binding downstream. Babu M. et al [97] has even suggested that protein domains and families did not directly relate to the TF’s regulatory function.
1.4 O B J E C T I V E S
Understanding the interactions between TFs and specific regions of DNA and the mechanisms by which TFs modulate transcription is a central challenge for understanding the functioning of cells. The goals of this work are:
• Classify TFs according to their regulation type;
• Explore and classify the functional domains of E. coli’s TFs;
• Investigate what protein features are specific to TFs with different functions; • Analyse the relationship between the TFs’ function and protein structure.
2.1 P I P E L I N E
In this section, an overview of the work’s development is given. All of the methodologies de-scribed here are explained with detail during this chapter.
In figure 2.1 there’s a flowchart with a simple pipeline of the methods. A dataset from Regu-lonDB [56] with a list of 200 E. coli’s transcription factors was used as the input data. The first main objective was to study the functional domains of each TF. To do so, information of the TFs was retrieved using UniProtJAPI, a JAVA library that allows remote access to UniProt [98], which was used as the main database. This data comprised the functional domains, that was the information that this work aimed for, as well as information about the protein families of the TFs, structural motifs and conserved sites. The manual curation process consisted of the removal of the latter (protein families, motifs and conserved sites), as well as the removal of duplicated domains. In this phase, domains that were missing from the structure of the TFs were also added. The classification of the domains consisted of dividing the functional domains according to their molecular function. The TFs were classified according to their regulation type into activators, repressors or dual regulators, using another dataset from RegulonDB with the TFs’ binding sites. Both the data retrieved about the domains and their classification was integrated and analysed together with the information of the classification of the TFs. To understand the relationships between the functions of the TFs and their domains, the statistical analysis and hierarchical clus-tering were obtained through R, an environment of statistical computing.
2.2 D ATA M I N I N G
UniProtJAPI is a JAVA library that allows remote access to the UniProt data, and was used in the present work as a tool to capture the functional domains of the TFs. Since JAVA is the language it is written in, the same language was adopted for the following developed code.
Two different methods from UniProtJAPI were particularly important: queryService and queryServiceProtein. These methods allow to access the information of the individual entries from the UniProt database and have different functions built in that return complementary infor-mation.
Figure 2.1: General pipeline for the analysis of transcription factors and their domains. A list of 200 TFs from RegulonDB was firstly filtered. UniProt was accessed through a remote JAVA API and information of the TFs was extracted. This information, in addition to the functional domains that were the main goal of this research, had also information on the protein families of the TFs, structural motifs as well as conserved sites. This was considered excess information and was manually curated, process that also comprised completing missing information on the TFs’ domains. The domains were classified according to their molecular function and the TFs were classified into activators, repressors and dual according to their regulation type, using another database from RegulonDB with the TFs’ binding sites. This informa-tion was integrated and to understand the relainforma-tionships between the TFs’ funcinforma-tions and their funcinforma-tional domains, a statistical analyse and clustering methods were performed in R software.
2.2.1 Filtering the RegulonDB’s list of TFs
Some of the TFs (17) did not return any information when using UniProtJAPI with either of the methods (queryServiceProtein or queryService). The following list describes the problems and solutions found through the work
• Some TFs had different names in UniProt than the ones being used in RegulonDB’s list
UniProt used different TFs’ names for some TFs (10) when referring to some of the entries from the list used from RegulonDB and for this reason weren’t being found in the database. For these cases, EcoCyc [55], which is a database for Eschierichia coli K-12, was consulted to investigate, of the different names a TF can be referred to, the one being used by UniProt. Replacing the TFs’ names in the list and simply redoing the query solved this problem.
• Some entries in the list were not names of TFs
Five of the entries in the list of TFs were not names of transcription factors, four of which referred to two-component systems instead of single TFs’ names. The TFs that were part of these two-component systems were already listed, and, therefore, these 5 entries were removed.
• Some entries were not annotated in UniProt
One of the TFs did not have any annotation in UniProt for E. coli and was disregarded in the domain analysis.
• Some entries had text characters that weren’t recognized by the UniProtJAPI’s meth-ods
H-NS’ text character ”-” was removed, since it didn’t allow the UniProtJAPI’s methods to function correctly.
2.2.2 Data Curation
The data obtained with the UniProtJAPI was raw and hard to read for this work’s purpose (re-trieving each transcription factor’s domains), therefore, strategies to extract and clean up the information were developed. Figure 2.2 shows the procedures adopted in order to manually cu-rate the data and obtain the relevant information. In a first instance, the way how the domains were annotated in the data obtained by the queries was investigated, so that it was possible to develop regular expressions to easily capture them. With this process, a list of 211 unprocessed supposed domains was obtained.
Each UniProt entry referring to gene products or proteins has several types of information divided into categories, such as ”Names and taxonomy”, ”Subcellular location”, ”Sequence”, ”Interaction”, among others. The category of interest for the current work, was the ”Family and domains”, since, as the name indicates, it provided information on the family of the protein, its functional domains, but plus, it also provided information on conserved sites and motifs. When
the information obtained using the UniProtJAPI was analysed, it was visible that the information that was relevant for this study was mixed with the excess data referred above. Moreover, de-pending on the database, the same domain had different names and therefore, were duplicated (2.3). InterPro [99] and Pfam [100] were the databases used to retrieve all domains. ProSite [101] was then used for manual curation and classification of protein domains.
Figure 2.2: Domain data processing scheme. The data obtained with UniProtJAPI was analysed and the information of the TFs was retrieved using regular expressions. The collected that was curated manually, since it had not only information about TFs’ features other than the wanted domains, as well as duplicated domains that had to be removed. The results were analysed in order to understand if the information for each TF was complete. The missing information was added by hand. The complete list of domains was then ready to be classified.
Figure 2.3: UniProt entry example: ChbR. The used methods retrieved information from the ”Family and domains” category from each UniProt entry. In addition to the functional domains of the entry, that was the goal information of this process, this category also provided the TFs’ protein families, structural motifs and conserved sites. In the curation process, all of the information other than the functional domains was disregarded. Plus, as can be seen in the figure, the Enzyme domain has three different designations that had to be filtered to only one annotation, in the final list of domains. Adapted from [102].
The identification of repeated domains with different annotations required an exhaustive anal-ysis. The databases had to be consulted in order to confirm the duplication, and the following removal of the excess data had to be extended to all TFs.
A list containing only unique domains that were present in the TFs’ structure was obtained after the manual curation (Appendix A.1). However, it was noticeable that in the results some TFs had only one domain. It was thought that it was due to some lack of information. This was true for some cases and the information was manually added and corrected.
2.3 C L A S S I F I C AT I O N O F T H E T R A N S C R I P T I O N F A C T O R S’S F U N C T I O N
For the classification of the Transcription Factors into activators, repressors or dual, an extra dataset available on RegulonDB (TF binding sites) was used. In this dataset, there was informa-tion on every known gene/operon that each TF regulates, its binding site and if the regulainforma-tion is positive, negative or dual, among other less relevant information for this analysis.
The TFs were classified as activators, if they exclusively regulated genes positively, as repressors, if they exclusively regulate genes negatively or dual if they performed both types of regulation. As auto-regulation cases describe exceptional roles and so, were disregarded.
2.4 D O M A I N C L A S S I F I C AT I O N
The classification process consisted of manually analysing the domains’ information in the on-line databases, such as UniProt, InterPro [99], PFam [100] and ProSite [101].
The domains were classified according to their molecular functions within the cell (table 2.1): The DNA-binding domain (DBD) refers to domains that interact with nucleic acids; enzyme do-main (END) refers to dodo-mains with enzymatic characteristics; protein interaction dodo-main (PID) groups domains that bind to proteins and domains that may perform oligomerization reactions in proteins; receiver domain (RED) classification refers to domains that receive cellular signals, usually a phosphate group. Small molecule binding domain (SMD) are domains that bind to small molecules such as ions.
Table 2.1: Domain classification according to their molecular function. DNA-binding domains (DBD) are schematically represented by a yellow hexagon; enzyme domains (END) are schematically represented by a red diamond shape; protein interaction domains (PID) are schematically represented by a pink pentagon; receiver domains (RED) are schematically represented by a green rectangle; small molecule binding do-mains (SMD) are schematically represented by an orange triangle; dodo-mains with unknown function (UNK) are represented by a blue round shape.
Abbreviation Classification Schematic Representation DBD DNA-binding Domain
END Enzyme Domain
PID Protein Interaction Domain RED Receiver Domain
SMD Small Molecule-binding Domain UNK Unknown function
2.5 I N F E R E N C E R E L AT I N G T O T H E F U N C T I O N O F T R A N S C R I P T I O N F A C T O R S A N D F U N C T I O N A L D O M A I N S
For the inference of the relationship between the function of transcription factors and functional domains, domains that were present in the structure of a sufficient number of TFs were selected. Only domains that were present in the structure of 5 or more TFs with a known function were con-sidered, since domains with a smaller sample of TFs could not be grouped with much confidence.
2.6 D ATA A N A LY S I S
For the results analysis we used R, an environment for statistical computing. The used packages were VennDiagram [103], clValid [104] and limma [105].
2.6.1 Hierarchical Clustering
Clustering methods are used in data mining to identify groups within large amounts of data, called clusters. The individuals within are supposed to be more similar to each other than to any other individuals in another cluster [106].
Hierarchical clustering was the clustering method chosen for analysing the similarity between TFs, considering the domains in their structure. The results of an hierarchical clustering method
are usually represented in dendrograms or trees [106], with each node representing a point where two subclusters merge.
The data had first to be organized in a way that made clustering possible with R. A binary table was used, as exemplified in table 2.2, where, if a given TF had a certain domain in its struc-ture, a ”1” would be added in the table, else, a ”0” would be added instead.
Table 2.2: Exemplifying binary data table. For a given TF, if a certain domain was present in its structure, a ”1” would be added, if not, a ”0” would be added instead.
TFs/ Domains Dom1 Dom2 Dom3
TF1 1 1 0
TF2 0 1 0
TF3 0 0 1
TF4 1 0 1
As the hierarchical clustering agglomerates the data according to its similarity, domains that were only present in one TF would not be adding much value to the cluster, instead, they were dividing them further. With these domains removed, TFs that didn’t have any domains (either the TFs didn’t have noted domains on UniProt or, after the previous step, their domains were deleted) were also removed.
For the hierarchical clustering, the Manhattan distance was used and the linkage criteria was the complete-linkage, since it defines the proximity of two clusters as the maximum distance between two points of each cluster [107] and is less susceptible to noise and outliers [106].
The validation metrics considered to support the selection of the number of clusters were Connectivity, Dunn and Silhouette. These metrics intend to analyse how compact the clusters are, how within the same cluster, the entries are closely related to each other [108]. And, at the same time, how well separated from each other the clusters are [109].
3.1 R E S U LT S O V E RV I E W
In the present study, a list of 200 E. coli’s transcription factors from RegulonDB [56] were con-sidered. These TFs were studied and information about their functional domains was retrieved, with the objective to analyse if these domains and the TFs’ structure could be related to their regulation type. UniProt was chosen as the main database to obtain the information about the domains, and a JAVA API (UniProtJAPI) was used to obtain the data which was later curated and studied.
Some TFs weren’t returning any information by UniProtJAPI and the reasons for this to happen were cleared. The strategies used to solve each of these problems are explained in the Material and Methods chapter.
It was not possible to retrieve any information from UniProt, regarding some entries in the initial TFs’ list (figure 3.1). For the analysis of the TFs regarding their functional domains, 17 entries from the initial list from RegulonDB were disregarded for the reasons pointed out in figure 3.1 a). Hence, 183 TFs were considered for this analysis. On the other hand, as can be seen in figure 3.1 b), the number of TFs used for the TFs’ classification according to their functional regulation type sums 195.
3.1.1 Data Curation
In a first instance, before the first part of the manual curation of the domains’ information (re-moval of duplicated domains, protein families, structural motifs and conserved sites), a total of number 211 supposed domains was counted, 31 of which retrieved by the queryService and 180 by the queryServiceProtein method.
The data curation was rather exhaustive, because it had to be performed manually, since the names of the functional domains, the protein families, motifs and conserved sites did not have any special features in their annotation that would distinguish them from one another. Therefore, it wasn’t possible to develop automatic scripts to remove them.
Moreover, the removal of duplicated domains was complicated, since the same functional domain would often be addressed differently by different databases. And, in the same database,
Figure 3.1: Number of TFs used to perform the different analysis. a) Number of domains used for analysis comprising the TFs’ functional domains. Of the list of 200 entries: (i) 11 TFs did not have any domains annotated in UniProt’s database; (ii) 5 entries in the list did not refer to TFs; (iii) 1 TF did not have an entry in UniProt’s database. This sums 17 entries that were disregarded and 183 TFs used to analysis that comprised the TFs’ functional domains. b) Number of TFs classified according to their regulation type. Of the list of 200 entries: (iv) 5 entries did not refer to TFs and were disregarded. 195 TFs were classifying according to their regulation type.
it was often referred to with more than one designation, referring to different structural properties in the protein.
For example, the case of a domain with enzymatic functions that was referred to as: ”P-loop containing nucleoside triphosphate hydrolase”, ”AAA+ ATPase domain” and ”RNA polymerase sigma factor 54 interaction domain”. The P-loop containing nucleoside triphosphate hydrolase referred more specifically of the structure of the domain, which consisted of a P-loop NTPase fold that catalyses hydrolysis reactions [110]. On the other hand, the AAA+ ATPase domain, was a more specific function of this domain, that, in this case, has an ATPase activity [111]. The RNA polymerase sigma factor 54 interaction domainrefers to the specific domain that interacts with the RNA polymerase associated to the σ-54 and has an ATPase activity [112].
All of these terminologies referred to the same domain activity, with different levels of speci-ficity. To chose which domain should be considered or not was even more difficult due to the fact that some TFs would have the same P-loop domain but not the RNA polymerase σ-54 interaction one. Ignoring the particular case of the RNA polymerase σ-54 interaction domain and consider-ing all of the referred domains as the P-loop containconsider-ing nucleoside triphosphate hydrolase could
result in a loss of results’ specificity. On the other hand, dividing these cases could result in divergences in the relationships between the TFs that had these domains, when, in fact, they had the same type of functional domains.
After the manual curation of the domains’ data, 88 unique functional domains were obtained. In the second phase of the manual curation, techniques to complete the missing information of certain TFs were developed which resulted in an increase of the number of domains to 96. The final list of domains can be found in Appendix A.2.
3.2 T R A N S C R I P T I O N F A C T O R S A N D D O M A I N S
3.2.1 Transcription Factors’ and Domains’ Classifications
Unlike what has been found in previous studies that said that the majority of TFs were activators [47] and that the repressors were scarcer, we found that the functions were more or less evenly distributed. 31% are activators, 36% are repressors and 33% are dual, as can be seen in table 3.1.
Table 3.1: Classification of the transcription factors according to their functional regulation type. 62 TFs were classified as activators, 69 were classified as repressors and 64 were classified, which sums to a total of 195 TFs classified according to their functional regulation type.
TF Function Number of TFs Activators (A) 62 Repressors (R) 69 Dual (D) 64
TOTAL 195
The vast majority of TFs have two or less domains (88%) while the remaining 12% have three domains or more, up to five (fig.3.2 a)), which supports the idea that the TFs are two headed components [48]. TFs that have been assigned only one domain could be the result of incomplete domain annotation by UniProt or loss of information during the work’s development.
The domains were classified according to the methodology explained in the Materials and Methods chapter. The results can be seen in figure 3.2 b), where the largest group of domains is the DBD with a total of 48 domains, followed by END, SMD and PID with 15,13 and 12 domains respectively while the RED group is the smallest with only 2 domains. On the other hand, 6 domains with unknown functions have been found, in a total of 96 unique domains.
![Table 1.2: List of common protein motifs and the secondary structures that form them. Adapted from [2]](https://thumb-eu.123doks.com/thumbv2/123dok_br/17555836.816997/28.892.108.733.190.358/table-list-common-protein-motifs-secondary-structures-adapted.webp)