GOLD AS SAFE HAVEN OR SPECULATIVE
INVESTMENT
Iryna Kovinska
Project submitted as partial requirement for the conferral of Master in Finance
Supervisor:
Prof. Sofia Brito Ramos, ISCTE Business School, Finance Department
G
O
L
D
A
S S
A
FE
H
A
V
E
N
O
R SP
E
C
U
L
A
T
IV
E
IN
V
E
ST
ME
N
T
Iry
na
K
o
v
in
sk
a
Resumo
O ouro é considerado um investimento seguro porque em tempos de turbulência económica mantem o seu valor. Para fazermos um bom investimento em ouro, temos que saber quais os factores relevantes que afectam o seu valor. Neste estudo, analiso os retornos das cotações do ouro e da prata bem como as de seis ETFs baseados no ouro, e de cinco ETFs baseados na prata. É analisada a forma como o retorno do S&P 500, VIX, de retorno da taxa de câmbio do dólar americano, da taxa de juro, da taxa de inflação e de retorno do petróleo bruto podem afectar do ouro e da prata retornos, no período entre Janeiro de 2000 e Dezembro de 2013. Os resultados empíricos obtidos permitem concluir que retorno do dólar americano permite explicar o retorno do ouro e da prata, mais especificamente quando o retorno do dólar americano aprecia, os retornos de ouro e da prata depreciam, e vice-versa. O retorno do S&P 500, VIX, taxa de juro e taxa de inflação não afectam os retornos do ouro e da prata. O retorno do petróleo bruto não tem nenhuma relação com o retorno de ouro, mas parecem afectar o retorno de prata. Embora de forma fraca que taxa de inflação é parece explicar para o retorno de ETFs baseados na prata. Os baixos R-quadrado parecem ser explicados pelo fato de os coeficientes variarem ao longo do tempo.
Palavras-Chave: Investimento em ouro; Prata; Exchange-Traded Funds; Regressão; Factores macroeconómicos;
Abstract
Gold is considered a safe investment options, because in times of turbulence keep its value. To make a good investment in gold we need to determine the relevant factors that affect the price of gold. In study this I analyse the returns of gold, silver and returns of six gold ETFs and five silver ETFs. I analyse whether the return of S&P 500, VIX, return of US dollar exchange rate, interest rate, inflation rate and return of crude oil are factors affect gold and silver returns in the period from January 2000 to December 2013.
The empirical results find that return of US dollar explains the gold and silver returns, more specifically when return of US dollar appreciates, the gold and silver returns depreciate and vice versa. The return of S&P 500, VIX, interest rate and inflation do not affect the returns of gold and silver. The return of crude oil has no relationship with return of gold, however it has a weak affect the return of silver. The variation of inflation rate allows us to explain changes of returns of silver ETFs. The low R-squared values are explained by the fact that coefficients vary over a long time.
Keywords: Gold investment; Silver; Exchange-Traded Fund; Regression; Macroeconomic factors;
Acknowledgments
Foremost, I would like to express sincere thanks to my supervisor, Sofia Brito Ramos for the guidance and constant support throughout the study, despite a busy schedule. Without her help it would not be possible to complete.
I am also grateful to my friends for support and to members of my family for their patience and daily understanding.
I
TABLE OF CONTENTS
1. INTRODUCTION ... 4
2. LITERATURE REVIEW ... 5
2.1 Investing in Gold ... 5
2.2 Investing in Gold ETFs ... 7
3. DEMAND AND SUPPLY OF GOLD ... 9
3.1 Jewellery Demand ... 10
3.2 Investment Demand ... 11
3.3 Supply ... 12
4. DATA AND METHODOLOGY ... 13
5. EMPIRICAL FINDINGS ... 15
5.1 Structural breaks for Gold and Silver Prices ... 15
5.2 Descriptive Statistics ... 16
5.3 Regression Analysis ... 21
5.4 Rolling Window Estimation ... 26
6. CONCLUSION ... 30
II
Index of Figures
Figure 1. Historical gold prices per ounce in pounds since 1265 ... 4
Figure 2. Gold demand by category (tonnes) and price of gold ... 10
Figure 3. Gold investment demand (tonnes) ... 11
Figure 4. Gold supply over the period from 2000 to 2012 ... 12
Figure 5. Price of Gold Bullion on LBM over the period from January 2000 to December 2013 ... 15
Figure 6. Price of Silver Bullion on LBM over the period from January 2000 to December 2013 ... 16
Figure 7. Rolling Window Regression for gold ... 27
III
Index of Tables
Table 1. List of gold ETFs traded in the USA ... 8
Table 2. Comparison of gold ETFs with physical gold ... 9
Table 3. Data sources for gold variables ... 13
Table 4. Exchange –Traded Funds Sample ... 14
Table 5. Summary statistics ... 16
Table 6. Correlations ... 17
Table 7. Summary statistics of Exchange-Traded Funds returns ... 18
Table 8. Correlations between return of gold and gold ETFs returns ... 20
Table 9. Correlations between return of silver and silver ETFs returns ... 20
Table 10. Linear Regression for gold variables ... 21
Table 11. Linear Regression for silver variables ... 22
Table 12. Gold regression explained by gold ETFs returns ... 23
Table 13. Regression for gold variables explained by gold ETFs returns ... 24
Table 14. Silver Regression explained by silver ETFs returns ... 25
4
1. Introduction
“Gold is a dense, soft, shiny metal and the most malleable and ductile metal known.” - Spall, Jonathan (2009) Gold has played an important role in political events as well as in the world economy, because it is used as: jewellery, currency, an industrial input and as money base. Individuals held gold as in form of jewellery, bars or coins, governments and central banks around the world held gold as monetary reserve assets and small bars as insurance against currency devaluation.¹
Figure 1
Historical gold prices per ounce in pounds since 1265
Source: Bank of England Goldman Sachs global ECS research
Like no other precious metal, gold has a fascinating history that began around 5,000 years ago. Historically gold has been seen as more attractive investment than stocks and bonds or other assets classes, not only for the positive returns but also as safe haven in time of difficulty. On Figure 1, we see that in deep 1265 price of gold was very volatile. Later, over period 1500 - 1965 gold had a bear market, as a consequence price declined by almost 80%. However, in the 1970s the gold price began to rise and created a bull market for investors and a possibility to freely trade on the markets. In middle of 2007 of the beginning financial crisis the nominal price of the gold has risen by 42%.
¹ Silver & Gold, Energy and Environmental Profile of the U.S. Department of Energy, available online at http://energy.gov/sites/prod/files/2013/11/f4/gold-silver.pdf
5 Shafiee and Topal (2009) point out that over 2007 the price of gold moved in the same manner as in 1978. However the price of gold is still turbulent. It has ups and downs from time to time due to the economic conditions, political uncertainties and condition on financial markets. Thus it is very important for investors to know the current price of gold. In order to take advantages on when to buy gold at a lower price and sell at higher price. Therefore, we need to analyze the relevant factors that may have an effect on gold price in order to determine appropriate time when investors can make investment in gold.
In this study analyze the effect of return of S&P 500, VIX (volatility), return of US dollar exchange rate, inflation rate, interest rate, and return of crude oil on returns of gold and silver, returns of silver ETFs and gold ETFs. The analysis will use method of Ordinary Least Squares with data over period from January 2000 to December 2013.
This paper consists of following sections: Section 2 makes a brief literature review about investing in gold and gold Exchange-Traded Funds. In Section 3, describes the demand by categories: jewellery and investments, and gold supply. Section 4 describes the data and methodology used in the study. Section 5 provides the empirical findings: structural breaks for gold and silver prices, descriptive statistics for returns of gold, silver, returns of six gold ETFs and five silver ETFs. Moreover, section shows the regression analysis, to determine which variables have an effect on returns of gold, silver and returns of gold ETFs, silver ETFs and rolling window estimation to see how the gold variables change over time.
2.
Literature Review
2.1 Investing in Gold
Goodboy (2013) argues that in recent years gold and silver have been the favourite precious metals of most investors. Moreover, they are the most enduring form of currency and investment in the world. They serve as a medium of monetary exchange and store of value. Despite their differences and similarities as a commodity, investors prefer to own gold than silver. The reason is that silver is used mostly for industrial purposes, whereas gold is used for investment and jewellery.² Singh and Nadda (2013) note that an investor has various investment options: mutual funds, stock markets, hedge funds, gold and commodities.
6 However, higher risks provide the possibility of higher return. One of the reasons people still prefer to invest in gold than stock market is because of the safe and growth characteristics. They also found that gold has been one of the best performing asset classes. Greenwood and Steiner (2011) state that from 2000 to 2010 gold increased in value by a cumulative 398%. Furthermore, over the same period, gold outperformed emerging markets, bonds, Treasury bills, commodities, oil and platinum.
Traditionally, gold investment can be made in few different ways: physical gold, gold Exchange-Traded Funds (ETFs), gold mutual funds and other form of gold investments through buying gold certificates or through gold accounts.³ According to the World Gold Council physical gold is one of the most direct ways of investing in gold, and it can be done by buying: gold bullions, coins and jewellery.
Numerous studies have examined the status of gold as investments: Feldman (2010) argues that an investor has a few ways to use gold as part of his investment strategy: potential “safe haven” during political or economic uncertainty also supports (Baur and Lucey (2010), Baur and McDermott (2010), Hood and Farooq (2013) and Harmston (1998)), hedge against the US dollar devaluation also pointed (Reboredo (2013)), portfolio diversification over both long and short-term horizons and hedge against inflation also provides (Worthington and Pahlavani (2006), Blose (2010)). While Brier (2012) argues that gold is purely speculative investment what makes big swings in price of gold.
Baur and Lucey (2010) examine “hedge” and “safe haven” assets, i.e. assets that are uncorrelated or negatively correlate with the other types of asset classes. Therefore, gold is referred as “safe haven” during negative market events that give opportunity investors protect their wealth.
Baur and McDermott (2010) examine gold as strong “safe haven” for most developing markets during market turmoil. During the stock market crash in 1987, gold showed a strong “safe haven” for the major Eurozone market, but not "safe haven" for Asian and Australian emerging markets. They also pointed out ability gold be “safe haven” for stocks but not for bonds.
7 Beckmen and Czudaj (2012) discuss gold investments as hedge against inflation in a long-run for the USA and United Kingdom economies. Reboredo (2013) and Hood and Farooq (2013) describe investment in gold as a strong “safe haven” for oil market movements and as a hedge against movements of US dollar.
The World Gold Council argues that gold also plays strategic diversification investment role. The investment allocation on gold depends on the level of risk. Small allocation adds diversification benefit to the portfolio with a low level of risk (1%-3%). Helmersson, Kang and Scold (2008) conclude that by including gold to the portfolio, it could improve an investor performance by increasing return or minimize in risks. That makes it more attractive especially in times of recession. Shafiee and Topal (2010) and McCown and Zimmerman (2006) describe gold investment as an insurance against stock market losses.
Baur (2013) pointed out that over the historical period from 1980 to 2010 gold prices showed significant positive returns especially in the months between September and November according to the season anomaly called the “autumn effect”. The extreme periods of gold prices for investors occurred: Stock markets crashed (October, 1987), Asian Financial Crises (October, 1997), Global Financial Crises (September and October, 2008).
2.2 Investing in Gold ETFs
According to the World Gold Council, gold Exchange-Traded Funds (ETFs) were launched in the early part of 21st century and emerged as a better gold investment for portfolio diversification. Gold ETFs are open-ended mutual funds, whose securities listed and traded on the stock exchange based on the price of metal. The upside of gold ETFs is that they are traded like stocks and move as spot futures.⁴
The world’s largest gold Exchange-Traded Fund is SPDR Gold Shares ETF (GLD), founded in 2004. The SPDR was developed to track the gold price and as an alternative to owning physical gold. SPDR is listed on the New York Stock Exchange (NYSE), but also traded in: Japan (TYO), Hong Kong (SEHK) and Singapore (SGX) an average of 24 million shares on a daily basis representing 2.4 million ounces of gold.⁵
⁴ Pierce, E. 2012. Buying Silver vs. Gold as an Investment – What is better? Money Crasher.
⁵ Drakoln, N. 2010. Gold Futures vs. Gold ETFs: Understanding the Differences and Opportunities, CME Group, Chicago Board of Trade.
8 There are many others successful gold ETFs traded in the USA (see Table 1).
Table 1
List of gold ETFs traded in the USA
Symbol Name Price Assets * Avg. Vol YTD
GLD SPDR Gold Trust $128.11 $34,400,48 8,000,982 +10.33%
IAU iShares Gold Trust $12.88 $7,066,312 4,459,049 +10.27%
SGOL ETFS Physical Swiss
Gold Shares $130.57 $1,144,746 46,984 +10.32%
DGP PowerShares DB Gold
Double Long ETN $30.37 $187,988 159,559 +21.00%
DGL PowerShares DB Gold
Fund $44.62 $180,400 55,823 +10.56%
UGL ProShares Ultra Gold $49.89 $152,100 78,867 +20.92%
GLL ProShares UltraShort
Gold $84.02 $103,231 119,856 -18.84%
DZZ PowerShares DB Gold
Double Short ETN $6.19 $71,938 430,482 -19.51%
AGOL ETFS Physical Asian
Gold Shares $132.00 $59,522 478 +12.56%
* Assets in thousands of the US Dollars. Assets and Average Volume as of 22/10/2013
Source: ETF database
On Table 1, we can see the list of major gold ETFs currently traded in the USA. By column we describe: symbol, name and price, assets in US dollars, average volume and yield to returns. Mallika and Sulphey (2013) point out that, typically, 1 gram of the gold price is equal to each unit of the ETF. Moreover, there is another Quantum gold ETF, where each unit equal to ½ a gram of gold.
Many studies pointed out the beneficial characteristics of investing in gold ETFs. Carty (2001), Gallagher and Segara (2005) and Nedeljkovic (2005) describe risk diversification, cost efficiency and safe characteristics, whereas Prashanta and Suhitra (2010), Singh and Nadda (2013) note that gold ETFs offer investors the benefits of lower taxes and zero storage costs. Nedeljkovic (2005) also describes gold ETFs as highly liquid investments with no credit risk. They are simple an accessible option to the investors. Wang, Hussain and Adnan (2010) argue that gold ETFs are highly valuable investments and extremely successful of basket securities. They offer investors to trade the portfolio easily and quickly with no high transaction costs. Agyei-Amapomah, Gounopoulosb and Mazouz (2014) note that gold ETFs
9 are more liquid than investment in physical gold through buying: gold bullion, jewellery or bars and coins (see Table 2).
Table 2
Comparison of gold ETFs with physical gold
Gold ETF Jewellery Bank
How Gold is held Electronic form Physical (Bar /Coin
/Jewellery) Physical (Bar/Coin)
Transparency Very high Very low High
Impurity risk Nil High Nil
Wealth tax No Yes Yes
Quantity to Buy/ Sell)
Minimum is ½ or 1 gram according to the fund Available in standard denomination Available in standard denomination
Resale At Secondary Market
Prices
Conditional and economical
Banks do not buy back
Convince buying/selling
More convenient as held in electronic from under demat account
Less convenient, as gold needs to be physically moved Less convenient, as gold needs to be physically moved Buying Premium
above gold price Likely to be less Likely to be more Likely to be more Security of Assets Fund house take
responsibility Investor are responsible
Investor are responsible
Bid Ask Spread Very low Very high Can’t sell back
Risk of Theft No Yes Yes
Long Term Capital
Gains Tax After 1 year Only after 3 years Only after 3 years
Source: Gold Exchange Traded Fund – Equity Bulls
Table 2 shows gold ETFs compared with investments in physical gold. By columns, we describe: gold ETFs, jewellery and bank investments in gold. By rows, we have main investment parameters.
3.
Demand and supply of gold
Dorgan (2013) argues that gold and silver depend more on the supply and demand situation then others commodities or asset classes. However, gold reacts slowly, whereas silver and crude oil reacting faster on demand and supply situation. Lampinen (2007) and Greenwood and Steiner (2011) argue that gold is used for: physical purposes (jewellery, electronics),
10 investor purposes (both government and private) and also industrial applications (including dental and medical uses). The World Gold Council separates total gold demand into few categories: jewellery demand, investment demand, technological demand and demand of central banks.
Figure 2
Gold demand by category (tonnes) and price of gold
Source: LBMA, Thomson Routers GFMS, World Gold Council
On Figure 2, shows annual gold demand by categories during the period 2003-2012. The growing demand came from: jewellery and investment. Following Baur and McDermott (2010) the largest component of gold demand is jewellery, determined by consumers speeding power.
3.1 Jewellery demand
Gold as jewellery has been used for a very long time, over five thousands of years. The largest world customers of gold jewellery in 2012 were: China with customer demand of 800 tonnes, followed by India with 720 tonnes and the United States, with 128 tonnes.⁶
Chilkoti and Crabtree (2013) argue that in India gold is viewed as a charming national quirk driven by elaborate weddings and religious offerings. During the Hindi festivals, Diwali religious holidays gold purchasing power increases very fast with further pressure on external
11 financing. According to the World Gold Council, both India and China generates almost 56% of total annual jewellery demand in 2012, higher by 8% compared to 2011. Far Eastern markets generated a low demand, while Russia which was fourth largest jewellery market in 2012 has a growth tendency in demand. Customer jewellery demand increased by 20% with value of $183.9 billion and reached to 3,757 tonnes during the first three quarters 2013. The most growth in demand came from Turkey and Middle East region.
Greenwood and Steiner (2011) pointed out that the biggest effect on gold jewellery was the period of worldwide recession 2008-2009. Demand on jewellery shrank by 9% in 2008 and 20% in 2009. Moreover, that time demonstrated negative impact on spending in the USA and western markets.
3.2 Investment demand
The World Gold Council argues that gold investment had represented as strong growth source in demand, since 2003. However, in 2012 investment demand significantly declined as result of divergence between the retail and institutional investor’s behaviour. Greenwood and Steiner (2011) point out that investment demand can be split into retail investments, including the purchase and hoarding of gold bars and coins, medals and Exchange-Traded Funds (ETFs) and similar products. During period from 2001 to 2010, retail investors were responsible for 14% of global gold demand, and ETFs for 6%. Wang, Hussein and Adnan (2010) discuss that demand for gold ETFs showed the higher growth rate than industrial consume or jewellery, in 2009.
Figure 3
Gold investment demand (tonnes)
Source: World Gold Council Report
-600 -400 -200 0 200 400 600 800 1000 1200 1400 Total bars and coins Physical bars Official coins Gold Medals ETFs T o nn es 2012 Q1 2013 Q2 2013 Q3 2013
12 Figure 3 shows gold investment demand during 2012 and first three quarters of 2013. Total gold ETFs demand in 2012 rose by 137.8 tonnes, while during first three quarters of 2013 market saw a big reversal in which demand fell by 697.4 tonnes. The total demand for bars and coins and physical bars continues to growth and tends to be as long term holders argues Dove (2011). According to the World Gold Council, over the first nine months of 2013 big growth in demand for bars and coins were generated in Middle East. The strong performance has been also in Turkey and Egypt, whereas demand in western market and the United States shown fall.
3.3 Supply
Baur and McDermot (2010) note that gold supplies are relatively inelastic, owing to the difficult extraction process and the tedious establishment of new mines. However, gold supply stays relatively stable, while the gold demand is rapidly changing in response to global economic events. According to the World Gold Council, supply coming from gold mine production, recycled gold and central banks sales of gold. In 2012 the largest producers of gold were: China, Australia, the United States, Russia and South Africa. Figure 4 shows that total gold supply has been growing since 2006, reaching a record of 120 million ounces in 2011 or 4,511.85 metric tonnes.⁷
Figure 4
Gold supply over the period from 2000 to 2012
Source: DataStream Thomson Routers
⁷ James, L. 2012. Gold Supply Crunch is coming? Chief Metals & Mining Investment Strategist 0 500 1000 1500 2000 2500 3000 3500 4000 4500 5000 2000 2002 2004 2006 2008 2010 2012 T o nn es
13 However, in 2012 gold supply has been decreased to 4,494.67 metric tonnes. Mine production falls to a 10-years low in 2008, while recycled gold supply shown growth. In 2012, the mine production increased to 2,860 metric tonnes, since 2000, while the recycle gold had declined to 1,633.7 metric tonnes, since 2009. For years, central banks were net sellers of gold. However, in 2009 the first time central banks became the net buyers of gold bullion, since 1988. In 2012 net purchases of gold by central banks around the world was 500 metric tonnes. Greenwood and Steiner (2011) find that during 2002-2010, gold production was responsible for 60% of supply recycled gold for 30% of supply and central bank sales was responsible for 10%.
4. Data
and Methodology
In the analysis I use observations from the first day of the month over period of 13 years starting from January 2000 to December 2013. Gold price, silver price and also six gold ETFs and five silver ETFs are as dependent variables and I analyze the effect of several macroeconomic factors such as: currency, stock market, interest rate, inflation rate, crude oil and volatility. Data description can be seen in Table 3. Table 4 describes the features of ETFs sample.
Table 3
Data sources for gold variables
Factors effecting the dependent
variables Independent variables
Currency US dollar Index
Stock market S&P 500 price Index
Interest rate US LIBOR 1 Week
Inflation rate US CPI Inflation
Crude oil WTI Cushing U$/BBL
Volatility CBOE Gold Volatility Index Source: DataStream Thomson Routers
For the further calculations I will work with monthly logarithmic rate of return for all gold variables, gold ETFs and silver ETF except interest rate and VIX (volatility). The rate of return is computed in the following way:
[
14 Where refers return of variable j at time t and is the price for variable j at time t,
is the price for variable j at time (t+1).
Table 4
Exchange –Traded Funds Sample
Panel A: Gold Exchange-Traded Funds
Ticker
Symbol Short name
Launch
date Leverage β target
Annual
free Holdings
GLD SPDR GOLD SHARES 19-Nov-04 Long 1 0.40% Physical
gold
IAU ISHARES GOLD TRUST 21-Jan- 05 Long 1 0.25% Physical
gold DGL POWERSHARES DB GOLD FD. 5-Jan-07 Long 1 0.79% Swaps Futures GDX MARKET VECTORS
GD.MINERALS ETF 22-May-06 Long 1 0.55% Stocks
PHAU
ETFS
MTL.SECS.PHYC.(LON) GOLD U$
24-Apr-07 Long 1 0.39% Physical gold
GBS GOLD BULLION
SECS.(LON) ETF 15-Apr-04 Long 1 0.40%
Physical gold
Panel B: Silver Exchange-Traded Funds
Ticker
Symbol Short name
Launch
date Leverage β target
Annual
free Holdings
SLV ISHARES SILVER TRUST 28-Apr-06 Long 1 0.50% Physical
Silver
DBS POWERSHARES
DB.SIL.FD 5-Jan-07 Long 1 0.79%
Swaps, Futures
PHAG ETFS METAL SECS.
PHYSICAL SILVER 1-Apr-07 Long 1 0.49%
Physical Silver
ZSIL ZKB SILVER ETF 10-May-07 Long 1 0.60% Physical
Silver
SLVR ETFS CMOD.
SECS.SILVER 27-Sep-06 Long 1 0.49%
Futures, Forwards
Table 4 describes the features of our sample of Exchange-Traded Funds. Panel A describes sample of gold ETFs that track the price of gold and Panel B describes sample of silver ETFs that track the price of silver on the London Bullion Market.
The methodology that has been used to achieve the objective of the study is Ordinary Least Square. The Ordinary Least Square (OLS) is statistical technic was used to examine an effect of the several independent variables on the dependent variable. The model is as follow:
15 Where, refers to the value of the dependent variable, refers to the values of independent variables that explained by , is a constant value and are coefficients for independent variables, is the error term. Standardized beta for an independent variable indicates the expected increase or decrease in the dependent variable, in standard deviation units, given a one standard deviation increase in independent variable with all other independent variables held constant, explained Nathans, Oswald and Nimon (2012). Later I present standardized beta ( :
,
for j = (2,3…n) (3)All statistical calculations have been performed with help of STATA 12.0 version.
5. Empirical Findings
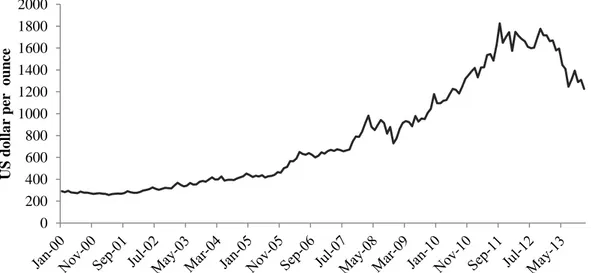
5.1 Structural breaks for Gold and Silver Prices Figure 5
Price of Gold Bullion on LBM over the period from January 2000 to December 2013
Figure 5 shows movement of the gold bullion price per ounce. Figure indicates that the bull market on gold price begin from April 2001 and for the next ten years rose very fast. During finance crisis 2008-2009 there was big downturn, when gold price fell from $981.35 to $727.35. But then subsequently recovers all the losses with the price $1,826.35 per ounce in September 2011 on the London Bullion Market (LBM). The second downturn occurred over period from October 2012 to December 2013, the gold prices showed dramatic fall from $1,777 to $1,227 per ounce. 0 200 400 600 800 1000 1200 1400 1600 1800 2000 US do lla r per o un ce
16
Figure 6
Price of Silver Bullion on LBM over the period from January 2000 to December 2013
Figure 6 shows movement of silver bullion price per ounce. The silver price from July 2003 indicates the dramatic growth until May 2011 with the highest price reached of $48.7 per ounce on the London Bullion Market (LBM). During the Great Recession of 2008-2009 was first downturn when the silver price went from $20.16 to $10.05, and then started increasing even faster. Over the period from May 2011 to December 2013 occurs next fall of silver price from $48.7 to $19.75 per ounce. On Figures 4 and 5, we can see that over 13 years prices of gold and silver generally move in the same direction.
5.2 Descriptive Statistics
Table 5
Summary statistics Variables
Obs. Mean Std. Dev. Min. Max.
Gold 167 0.00897 0.04909 -0.12223 0.11307 S&P 500 167 0.00111 0.04923 -0.16880 0.10283 VIX 168 21.3817 8.39389 11.2400 53.6800 Interest rate 168 0.00191 0.00179 0.00011 0.00552 Inflation 165 0.40014 0.61156 -1.88200 2.25501 US dollar 167 -0.00134 0.01746 -0.04784 0.06469 Silver 167 0.00796 0.09257 -0.28852 0.25788 Crude oil 167 0.00825 0.09267 -0.25952 0.19011
Table 5 describes the summary statistics for gold variables over the sample period. The return of gold is dependent variable includes 167 observations. Mean and std. deviation is 0.00897
0 10 20 30 40 50 60 U S dol lar per ounce
17 and 0.04909 respectively. Minimum value negative is (-0.12223), while the maximum value is 0.11307. The return of silver has 167 observations with monthly mean and std. deviation is 0.00796 and 0.09257 respectively. Minimum value negative is (-0.28852), while maximum value is 0.25788.
Next we considered summary statistics of gold variables. The first variable is return of S&P 500 has 167 observations. Mean is 0.00111 and std. deviation is 0.04923. Maximum and minimum values are 0.10283 and (-0.16880) respectively. The second variable is VIX (volatility) has 168 observations. Mean is 21.3817 and std. deviation is 8.3939. Maximum value is 53.68 and minimum value is 11.24. The third variable is interest rate has 168 observations. Maximum value is 0.00552 and minimum value is 0.00011. Monthly mean is 0.00191 and std. deviation of 0.00179. The fourth variable is inflation has 165 observations. Maximum value is 2.25501, while minimum value negative is (-1.88200). Std. deviation and mean is 0.61156 and 0.40014 respectively. The next variable is return of US dollar has 167 observations. Mean is negative (-0.00134), while std. deviation is 0.01746. Minimum and maximum values are (-0.04784) and 0.06469 respectively. Lastly, we have the return of crude oil. The number of observations is 167. Std. deviation and monthly mean is 0.09267 and 0.00825 respectively. Maximum value is 0.19011, while minimum value negative is (-0.25952).
Table 6
Correlations Gold S&P 500 VIX Silver
Crude oil Interest rate Inflation US dollar Gold 1.0000 S&P 500 0.0432 1.0000 VIX 0.0051 -0.4436 1.0000 Silver 0.7479 0.1863 -0.1160 1.0000 Crude oil 0.2012 0.3525 -0.2686 0.2969 1.0000 Interest rate 0.0091 -0.0980 -0.2093 -0.0279 -0.0083 1.0000 Inflation 0.2457 0.2218 -0.2858 0.2705 0.5935 0.0886 1.0000 US dollar -0.2671 -0.2134 0.0831 -0.2537 -0.2714 0.0796 -0.2938 1.0000
Table 6 describes correlation between return of gold and return of gold variables over the full sample period. We can see there is no correlation between return of gold and return of S&P 500, VIX and interest rate. Correlations coefficients are 0.0432, 0.0051, and 0.0091
18 respectively. There is weak positive correlation between return of gold and inflation rate and between return of crude oil and return of gold, correlation coefficients are 0.2457 and 0.2012 respectively. The negative correlation occurred between return of gold and return of US dollar, correlation coefficient is (-0.2671).
Meanwhile, strong positive is correlation observed between return of gold and return of silver, coefficient we get is 0.7479. Furthermore, moderate positive correlation occurs between inflation rate and return of crude oil, correlation coefficient we get is 0.5935. The moderate negative correlation occurs between return of S&P 500 and VIX, correlation coefficient is (-0.4436).
Table 7
Summary statistics of Exchange-Traded Funds returns
Panel A: Gold Exchange-Traded Funds Ticker
Symbol Variable Obs. Mean Std. Dev. Min. Max.
GLD SPDR GOLD SHARES 108 0.00882 0.05677 -0.18991 0.13426
IAU ISHARES GOLD TRUST 106 0.00974 0.05703 -0.19106 0.13403 DGL POWERSHARES DB GOLD FD. 82 0.00549 0.06018 -0.19055 0.12371 GDX MARKET VECTORS GD.MINERALS ETF 90 -0.00679 0.11623 -0.47457 0.40931 PHAU
ETFS
MTL.SECS.PHYC.(LON) GOLD U$
79 0.00725 0.06165 -0.18652 0.12264 GBS GOLD BULLION SECS.(LON) ETF 115 0.00959 0.05516 -0.18897 0.12296
Panel B: Silver Exchange-Traded Funds
Ticker
Symbol Variable Obs. Mean Std. Dev. Min. Max.
SLV ISHARES SILVER TRUST 91 0.00314 0.11009 -0.31774 0.22070 DBS POWERSHARES DB.SIL.FD 82 0.00209 0.11298 -0.32332 0.22663
PHAG ETFS METAL SECS.
PHYSICAL SILVER 79 0.00439 0.11973 -0.30309 0.27107
ZSIL ZKB SILVER ETF 78 -0.00008 0.10477 -0.23697 0.23873
SLVR ETFS CMOD. SECS.SILVER 86 0.00413 0.11717 -0.30757 0.27227
Table 7 describes summary statistics of the ETFs returns. Panel A presents the summary statistics of the returns of gold ETFs. The number of observations is different since ETFs have different creation date. The first largest fund is SPDR GOLD SHARES. Observations range
19 from December 2004 to December 2013. Mean and std. deviation is 0.00882 and 0.05677 respectively. Maximum value is 0.13426, while minimum value is negative equal to (-0.18991). The next is ISHARES GOLD TRUST. Observations range from February, 2005 to December, 2013. Mean of the fund is 0.00974, while std. deviation is 0.05703. Maximum value is 0.13403 and minimum value is negative (-0.19106).
Next three gold ETFs such as: MARKET VECTORS GD.MINERALS ETF following by POWERSHARES DB GOLD FD and ETFS MTL.SECS.PHYC. (LON) GOLD U$ are relatively new.
The maximum value of return of MARKET VECTORS GD.MINERALS ETF is 0.40931, while minimum value is negative (-0.47457). Mean and std. deviation is (-0.00669) and 0.11623 respectively. Observations range from June 2006 to December 2013. The next is POWERSHARES DB GOLD FD. Observations range from February 2007 to December 2013. Mean and std. deviation is 0.00549 and 0.06018 respectively. Maximum value is 0.12371, while minimum value is negative (-0.19055). The next is ETFS MTL.SECS.PHYC (LON) GOLD U$. Observations range from May 2007 to December 2013. Maximum value is 0.12264, while minimum value negative is (-0.18652). Mean and std. deviation is 0.00725 and 0.06165 respectively. The last and oldest gold ETF is GOLD BULLION SECS. (LON) EFT USD. Observations range from May 2004 to December 2013. Maximum and minimum values are 0.12296 and (-0.18897) respectively. Mean is 0.00959 and std. deviation is 0.05516.
On Panel B, we have summary statistics of the silver ETFs returns.
The first largest silver ETF is ISHARES SILVER TRUST. Observations range from May 2006 to December 2013. Mean is 0.00314, while std. deviation is 0.11009. Maximum value is 0.22070 and minimum value is negative (-0.31774). The next is POWERSHARES DB.SIL.FD. Observations range from February 2007 to December 2013. Maximum value is 0.22663 and negative minimum value is (-0.32332). Mean and std. deviation is 0.00209 and 0.11298 respectively. The third is METAL SECS. PHYSICAL SILVER. Observations range from May 2007 to December 2013. Std. deviation is 0.11973 and mean is 0.00439. Maximum and minimum values are 0.27107 and (-0.30309) respectively. The next is ETF is ZKB SILVER ETF. Observations range from June 2007 to December 2013. Mean is 0.000075 and std. deviation is 0.1047743. Maximum value is 0.02387, while minimum value negative is
(-20 0.23697). The last is ETFS CMOD.SECS.SILVER. Observations range from October 2006 to December 2013. Mean and std. deviation is 0.00413 and 0.11717 respectively. Maximum value is 0.27227, while minimum value is negative (-0.30757).
Table 8
Correlations between return of gold and gold ETFs returns
Gold SPDR GOLD SHARES ISHARES GOLD TRUST POWER SHARES DB GOLD FD. MARKET VECTORS GD. MINERAL S ETF ETFS MTL.SEC S.PHYC. (LON) GOLD U$ GOLD BULLION SECS. (LON) ETF Gold 1.0000 GLD 0.9806 1.0000 IAU 0.9803 0.9999 1.0000 DGL 0.9787 0.9983 0.9984 1.0000 GDX 0.8063 0.8534 0.8535 0.8517 1.0000 PHAU 0.9905 0.9906 0.9903 0.9885 0.8293 1.0000 GBS 0.9899 0.9908 0.9905 0.9886 0.8299 0.9999 1.0000
On Table 8, we can see the result of correlations between return of gold and returns of gold ETFs. The return of gold has strong correlation with the returns of gold ETFs. The largest positive correlation occurs between return of gold and return of ETFS MTL.SECS.PHYC (LON) GOLD U$ (PHAU), correlation coefficient is 0.9905.
Meanwhile, there is strong positive correlation between returns of gold ETFs such as: SPDR GOLD SHARES (GLD) and ISHARES GOLD TRUST (IAU) and between ETFS MTL.SECS.PHYC (LON) GOLD U$ (PHAU) and GOLD BULLION SECS (LON) ETF (GBS).
Table 9
Correlations between return of silver and silver ETFs returns
Silver ISHARES SILVER TRUST POWER SHARES DB.SIL. FD ETFS METAL SECS. PHYSICAL SILVER ZKB SILVER ETF ETFS CMOD. SECS. SILVER Silver 1.0000 SLV 0.9631 1.0000 DBS 0.9606 0.9986 1.0000 PHAG 0.9807 0.9827 0.9814 1.0000 ZSIL 0.9351 0.9171 0.9180 0.9814 1.0000 SLVR 0.9818 0.9824 0.9811 0.9998 0.9431 1.0000
21 Table 9 shows correlations between return of silver and silver ETFs returns over the sample period. The return of silver is strong positively correlated with returns of silver ETFs.
Meanwhile, strong positive is correlation occurs between the returns of silver ETFs such as: ETFS METAL SECS PHYSICAL SILVER (PHAG) and ETFS CMOD.SECS SILVER (SLVR), and between ISHARES SILVER TRUST (SLV) and POWERSHARES DB.SIL FD (DBS) correlation coefficients are 0.9998 and 0.9985 respectively.
5.3 Regression Analysis
Table 10 provides the result of the linear regression with return of gold as dependent variable and several independent variables. The standard errors are robust. The number of observations is 165 and R-squared is 0.1125. The R-squared indicates that 11.25% of the variance in the S&P 500, US dollar returns, VIX, interest rate, inflation rate and return of crude oil are explained by the return of gold.
Table 10
Linear Regression for gold variables
Number of obs. 165 F( 5, 158) 2.82 Prob. > F 0.0122 R-squared 0.1125 Root MSE 0.04708 Gold Coef. Robust Std. Err. t P>t Standardized Beta S&P 500 -0.02552 0.098865 -0.26 0.797 -0.025702 VIX 0.00049 0.000578 0.83 0.409 0.085047 US dollar -0.59406 0.256181 -2.32 0.022** -0.212296 Interest rate 0.75539 2.062476 0.37 0.715 0.273970 Inflation 0.01320 0.008223 1.61 0.110 0.164595 Crude oil 0.41143 0.049663 0.83 0.409 0.077987 _cons -0.00921 0.014491 -0.64 0.526 .
Table 10 demonstrates that return of US dollar is statistically significant and has an effect on the return of gold. The significant value stands at 0.022 on 5% level. The standardized beta indicates that variation of one standard deviation in the return of US dollar, it is expected
t statistics in parentheses
22 variation in the return of gold by (-0.212). Meanwhile the return of S&P 500, VIX, interest rate, inflation rate and return of crude oil are statistically insignificant and do not affect the return of gold.
Table 11
Linear Regression for silver variables
Number of obs. 165 F( 5, 159) 4.65 Prob. > F 0.0002 R-squared 0.1327 Root MSE 0.08802 Silver Coef. Robust Std. Err. t P>t Standardized Beta S&P 500 0.127858 0.150294 0.85 0.396 0.068098 VIX 0.000001 0.001069 -0.10 0.999 -0.000169 US dollar -0.849454 0.377174 -2.25 0.026** -0.160511 Interest rate -0.898623 3.894136 -0.23 0.818 -0.017233 Inflation 0.017271 0.013998 1.23 0.219 0.113851 Crude oil 0.161235 0.086775 1.86 0.065* 0.161601 _cons 0.000682 0.028523 0.02 0.981 .
On Table 11, we can see the result of the linear regression with return of silver as dependent variable and several independent predictors. The standard errors are robust. The number of observations is 165 and R-squared is 0.1327. The R-squared indicates that 13.27% of the variance in the S&P 500, US dollar returns, VIX, interest rate, inflation rate and return of crude oil are explained by the return of silver. S&P 500 return, VIX, inflation rate, interest rate are statistically insignificant and do not affect the return of silver. The return of US dollar is statistically significant and has effect on silver return. The significant value stands at 0.026 on 5% level. The value of standardized beta is (-0.161). The beta coefficient indicates that variation of one standard deviation in the return of US dollar, it is expected variation in the return of silver by (-0.161). Meanwhile, return of crude oil has a weak effect on silver return at the 10% level.
Table 12 shows the result from regression with the return of gold ETFs as dependent variables and return of gold as independent variable. The return of gold is statistically significant at the 1% level and has effect on return of ETFs. The values of beta indicates that variation of one t statistics in parentheses
23 standard deviation in the return of gold, it is expected variation in SPDR GOLD SHARES by 1.017, ISHARES GOLD TRUST by 1.02, POWERSHARES DB. GOLD FD by 1.01, MARKET VECTORS GD.MINERALS ETF by 1.645, ETFS MTL.SECS.PHYC (LON) GOLD U$ by 1.030 and GOLD BULLION SECS (LON) EFT USD by 1.026. Thus, return of gold has greatest effect on return of MARKET VECTORS GD.MINERALS ETF. The adjusted R-squared for MARKET VECTORS GD.MINERALS ETF is 0.632. The result indicates that 63.2% of the variance of MARKET VECTORS GD.MINERALS ETF is explained.
Table 12
Gold Regression explained by gold ETFs returns
(1) (2) (3) (4) (5) (6) SPDR GOLD SHARES ISHARES GOLD TRUST POWER SHARES DB GOLD FD MARKET VECTORS GD. MINERALS ETF ETFS MTL. SECS.PHYC. (LON) GOLD U$ GOLD BULLION SECS. (LON) EFT USD Gold 1.017*** 1.020*** 1.010*** 1.645*** 1.030*** 1.026*** (31.01) (30.34) (27.14) (8.95) (33.25) (36.90) Constant -0.001 -0.001 -0.003* -0.020*** -0.001 -0.001 (-0.87) (-0.87) (-1.87) (-2.66) (-1.13) (-1.26) Observations 108 106 82 90 79 115 R-squared 0.958 0.960 0.956 0.636 0.981 0.981 Adjusted R-squared 0.958 0.960 0.956 0.632 0.981 0.980
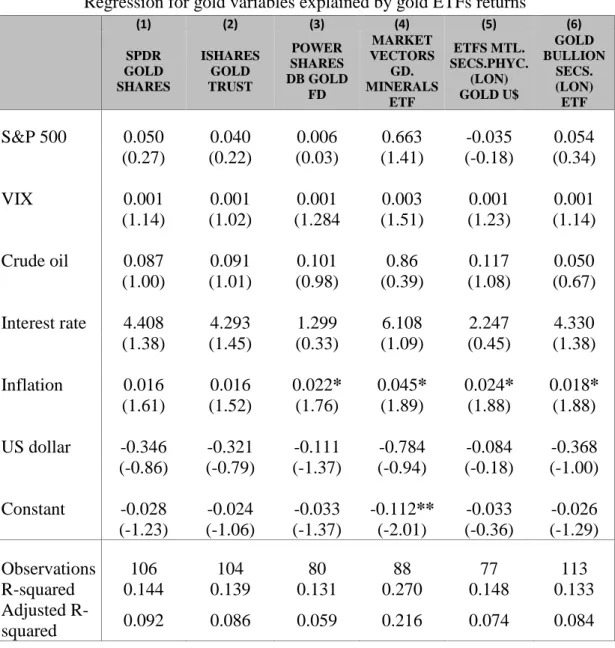
Table 13 describes the regression result with return of gold ETFs as dependent variables and gold variables as independent. The return of S&P 500, VIX, return of crude oil, interest rate and return of US dollar are statistically insignificant and do not affect the return of gold ETFs. Inflation rate is not statistically significant and has not effect on returns of SPDR GOLD SHARES and ISHARES GOLD TRUST.
However, inflation has a weak effect at the 10% level on returns of POWERSHARES DB GOLD FD, MARKET VECTORS GD.MINERALS ETF, and ETF MLT SECS PHYC (LON) GOLD U$, GOLD BULLION SECS (LON) ETF.
t statistics in parentheses
24
Table 13
Regression for gold variables explained by gold ETFs returns
(1) (2) (3) (4) (5) (6) SPDR GOLD SHARES ISHARES GOLD TRUST POWER SHARES DB GOLD FD MARKET VECTORS GD. MINERALS ETF ETFS MTL. SECS.PHYC. (LON) GOLD U$ GOLD BULLION SECS. (LON) ETF S&P 500 0.050 0.040 0.006 0.663 -0.035 0.054 (0.27) (0.22) (0.03) (1.41) (-0.18) (0.34) VIX 0.001 0.001 0.001 0.003 0.001 0.001 (1.14) (1.02) (1.284 (1.51) (1.23) (1.14) Crude oil 0.087 0.091 0.101 0.86 0.117 0.050 (1.00) (1.01) (0.98) (0.39) (1.08) (0.67) Interest rate 4.408 4.293 1.299 6.108 2.247 4.330 (1.38) (1.45) (0.33) (1.09) (0.45) (1.38) Inflation 0.016 0.016 0.022* 0.045* 0.024* 0.018* (1.61) (1.52) (1.76) (1.89) (1.88) (1.88) US dollar -0.346 -0.321 -0.111 -0.784 -0.084 -0.368 (-0.86) (-0.79) (-1.37) (-0.94) (-0.18) (-1.00) Constant -0.028 -0.024 -0.033 -0.112** -0.033 -0.026 (-1.23) (-1.06) (-1.37) (-2.01) (-0.36) (-1.29) Observations 106 104 80 88 77 113 R-squared 0.144 0.139 0.131 0.270 0.148 0.133 Adjusted R-squared 0.092 0.086 0.059 0.216 0.074 0.084
Table 14 presents the regression result with return of silver ETFs as dependent variables and return of silver as independent variable. The return of silver is statistically significant at the 1% level and has an effect on return of silver ETFs. The values of beta indicates that variation of one standard deviation in the return of silver, it is expected variation in SPDR SILVER SHARES by 0.959, POWERSHARES DB.SIL.FD by 0.958, ETFS METAL SECS. PHYSICAL SILVER by 1.024, ZKB SILVER ETF by 0.849 and ETFS CMOD SECS.SILVER by 1.032 standard deviations.
t statistics in parentheses
25 Thus, we conclude that return of silver has greatest effect on returns of ETFS.CMOD SECS SILVER ETFS and METAL SECS. PHYSICAL SILVER, while lowest effect on return of ZKB SILVER ETF.
Table 14
Silver Regression explained by silver ETFs returns
(1) (2) (3) (4) (5) ISHARES SILVER TRUST POWER SHARES DB.SIL.FD ETFS METAL SECS. PHYSICAL SILVER ZKB SILVER ETF ETFS CMOD. SECS.SILVER Silver 0.959*** 0.958*** 1.024*** 0.849*** 1.032*** (26.24) (24.35) (55.85) (19.74) (58.95) Constant -0.002 -0.002 -0.000 -0.004 -0.002 (-0.46) (-0.61) (-0.18) (-0.97) (-0.91) Observations 91 82 79 78 86 R-squared 0.916 0.918 0.962 0.875 0.965 Adjusted R-squared 0.915 0.917 0.962 0.874 0.964
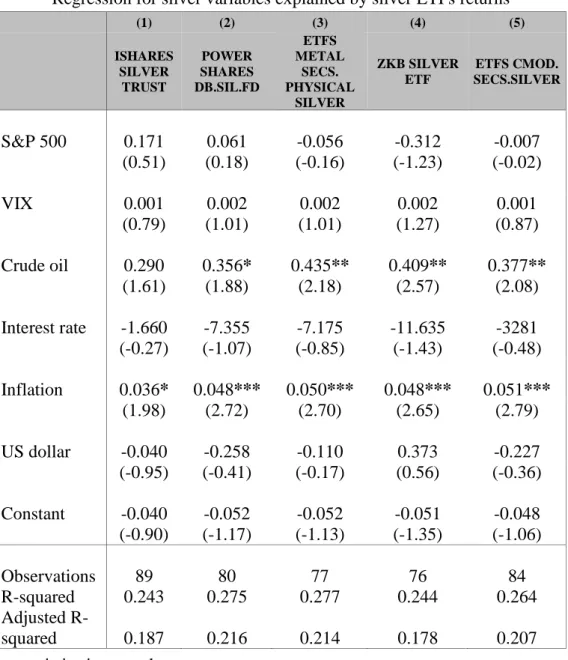
On Table 15, we can see the regression result with return of silver ETFs as dependent variables and gold variables as independent. Inflation rate is statistically significant at the 1% level and has a strong effect on returns of POWERSHARES DB. SIL.FD, ETFS METAL SECS PHYSICAL SILVER, ZKB SILVER ETF and ETFS CMOD SECS SILVER. Meanwhile inflation has weak effect on return of ISHARES SILVER TRUST, at the 10% level.
The return of crude oil is significant at the 5% level and has strong impact on returns of ETFS METAL SECS PHYSICAL SILVER, ZKB SILVER ETF and ETFS CMOD SECS SILVER. However return of crude oil has weak affect the return of POWERSHARES DB SILV FD at the 10% significant level and has not affect the return of ISHARES SILVER TRUST. The returns of S&P 500 and US dollar, VIX, interest rate are statistically insignificant and do not affect the return of silver ETFs.
t statistics in parentheses
26
Table 15
Regression for silver variables explained by silver ETFs returns
(1) (2) (3) (4) (5) ISHARES SILVER TRUST POWER SHARES DB.SIL.FD ETFS METAL SECS. PHYSICAL SILVER ZKB SILVER ETF ETFS CMOD. SECS.SILVER S&P 500 0.171 0.061 -0.056 -0.312 -0.007 (0.51) (0.18) (-0.16) (-1.23) (-0.02) VIX 0.001 0.002 0.002 0.002 0.001 (0.79) (1.01) (1.01) (1.27) (0.87) Crude oil 0.290 0.356* 0.435** 0.409** 0.377** (1.61) (1.88) (2.18) (2.57) (2.08) Interest rate -1.660 -7.355 -7.175 -11.635 -3281 (-0.27) (-1.07) (-0.85) (-1.43) (-0.48) Inflation 0.036* 0.048*** 0.050*** 0.048*** 0.051*** (1.98) (2.72) (2.70) (2.65) (2.79) US dollar -0.040 -0.258 -0.110 0.373 -0.227 (-0.95) (-0.41) (-0.17) (0.56) (-0.36) Constant -0.040 -0.052 -0.052 -0.051 -0.048 (-0.90) (-1.17) (-1.13) (-1.35) (-1.06) Observations 89 80 77 76 84 R-squared 0.243 0.275 0.277 0.244 0.264 Adjusted R-squared 0.187 0.216 0.214 0.178 0.207
5.4 Rolling Window Estimation
Figure 7 shows rolling window regression for gold of the 30 days moving window, to see how the gold variables change over the sample period. The S&P 500 has risen from January 2000 to March 2008 to almost 0.93 and showed the higher correlation with return of gold. Market crash always associate with the shocks and during the Great Recession 2008 return of market stock falls to almost (-0.64). In December 2013 the S&P 500 remains negative and indicates there is no correlation with return of gold.
Correlation between the return of gold and VIX over the period from January 2000 to December 2013 has range from 0.004 to (-0.006) respectively. The large decline occurred in
t statistics in parentheses
27 July 2007, correlation decreased from 0.002 to (-0.006), but in June 2009 increased to 0.004. The second downturn was in October 2012 to almost (-0.001). Thus, there is no correlation between return of gold volatility and VIX. Correlation between return of gold and interest rate from January 2000 to November 2010 was close to zero. Afterwards, we can see the first fast drop to 0.33) in August 2011 and the second downturn in September 2013 from 0.09 to (-0.39). The December 2013 correlation between return of gold and interest rate has gone from (-0.38) to 0.15 and indicates weak correlation. The first downturn in correlation between the return of gold and inflation rate occurs in June 2006 from 0.004 to (-0.014), but in October 2011 had shown increasing to almost 0.06. The December 2013 correlation remains positive but significant low and indicates that return of gold do not influenced by inflation rate. The first downturn in correlation between the return of gold and return of crude oil occurs in December 2005 from 0.09 to almost (-0.32). In March 2011, correlation decreased from 0.26 to almost (-0.14). To December 2013, return of crude oil was positive and showed weak correlation between gold.
The correlation between return of gold and return of US dollar, during 13 years ranges from (-1.75) to 1.12. We can observe strong decrease from (-0.10) to almost (-(-1.75) in August 2008. In September 2011 correlation increased to almost 1.12. However, in December 2013 return of US dollar decreased to almost (-0.57) and has shown negative correlation with return of gold.
Figure 7
Rolling Window Regression for gold
-0,8 -0,6 -0,4 -0,2 0 0,2 0,4 0,6 0,8 1 1,2 ju n /0 2 m ai/0 3 ab r/ 0 4 m ar /0 5 fev /0 6 jan /0 7 d ez /0 7 n o v /0 8 o u t/0 9 set /1 0 ag o /1 1 ju l/1 2 ju n /1 3 S&P 500 -0,008 -0,006 -0,004 -0,002 0 0,002 0,004 0,006 ju n /0 2 m ai/0 3 ab r/ 0 4 m ar /0 5 fev /0 6 jan /0 7 d ez /0 7 n o v /0 8 o u t/0 9 set /1 0 ag o /1 1 ju l/1 2 ju n /1 3 VIX (volatility)
28 On Figure 8, we can see rolling R-squared estimation for gold of 30 days moving window over period from January 2000 to December 2013. The R-squared for the return of S&P 500 was very volatile in range from 0.004 to 0.13, indicates that during 13 years change in stock market not cause of the change in return of gold. The same we can say about VIX with coefficient R-squared in range from 0.002 to 0.13. The R-squared for interest rate was in range from 0.006 to almost 0.25, while inflation rate in range from 0.0003 to 0.17 indicates that movements of interest rate and inflation rate do not impact gold much. R-squared for US dollar to September 2008 increased to almost 0.40, but to December 2013 occurred fall to 0.03 and indicates that return of US dollar cannot explain movement of return of gold. R-squared for return of crude oil over long period was in range from 0.005 to almost 0.30 indicates low correlation between returns of crude oil and gold.
-0,5 -0,4 -0,3 -0,2 -0,1 0 0,1 0,2 0,3 ju n /0 2 m ai/0 3 ab r/ 0 4 m ar /0 5 fev /0 6 jan /0 7 d ez /0 7 n o v /0 8 o u t/0 9 set /1 0 ag o /1 1 ju l/1 2 ju n /1 3 Interest rate -0,02 -0,01 0 0,01 0,02 0,03 0,04 0,05 0,06 0,07 ju n /0 2 m ai/03 ab r/ 0 4 m ar /0 5 fev /0 6 jan /0 7 d ez /0 7 n o v /0 8 o u t/0 9 set /1 0 ag o /1 1 ju l/1 2 ju n /1 3 Inflation rate -0,3 -0,2 -0,1 0 0,1 0,2 0,3 0,4 ju n /0 2 m ai/0 3 ab r/ 0 4 m ar /0 5 fev /0 6 jan /0 7 d ez /0 7 n o v /0 8 o u t/0 9 set /1 0 ag o /1 1 ju l/1 2 ju n /1 3 Crude oil -2 -1,5 -1 -0,5 0 0,5 1 1,5 ju n /0 2 m ai/0 3 ab r/ 0 4 m ar /0 5 fev /0 6 jan /0 7 d ez /0 7 n o v /0 8 o u t/0 9 set /1 0 ag o /1 1 ju l/1 2 ju n /1 3 US dollar
29
Figure 8
Rolling R-squared for gold
0 0,02 0,04 0,06 0,08 0,1 0,12 0,14 ju n /0 2 m ai/0 3 ab r/ 0 4 m ar /0 5 fev /0 6 jan /0 7 d ez /0 7 n o v /0 8 o u t/0 9 set /1 0 ag o /1 1 ju l/ 1 2 ju n /1 3 S&P 500 0 0,02 0,04 0,06 0,08 0,1 0,12 0,14 ju n /0 2 m ai/0 3 ab r/ 0 4 m ar /0 5 fev /0 6 jan /0 7 d ez /0 7 n o v /0 8 o u t/0 9 set /1 0 ag o /1 1 ju l/1 2 ju n /1 3 VIX (volatility) 0 0,05 0,1 0,15 0,2 0,25 0,3 ju n /0 2 m ai/03 ab r/ 0 4 m ar /0 5 fev /0 6 jan /0 7 d ez /0 7 n o v /0 8 o u t/0 9 set /1 0 ag o /1 1 ju l/1 2 ju n /1 3 Interest rate 0 0,02 0,04 0,06 0,08 0,1 0,12 0,14 0,16 0,18 0,2 ju n /0 2 m ai/0 3 ab r/ 0 4 m ar /0 5 fev /0 6 jan /0 7 d ez/0 7 n o v /0 8 o u t/0 9 set /1 0 ag o /1 1 ju l/1 2 ju n /1 3 Inflation 0 0,05 0,1 0,15 0,2 0,25 0,3 ju n /0 2 m ai/0 3 ab r/ 0 4 m ar /0 5 fev /0 6 jan /0 7 d ez /0 7 n o v /0 8 o u t/0 9 set /1 0 ag o /1 1 ju l/1 2 ju n /1 3 Crude oil 0 0,05 0,1 0,15 0,2 0,25 0,3 0,35 0,4 0,45 ju n /0 2 m ai/0 3 ab r/ 0 4 m ar /0 5 fev /0 6 jan /0 7 d ez /0 7 n o v /0 8 o u t/0 9 set /1 0 ag o /1 1 ju l/1 2 ju n /1 3 US dollar
30
6. Conclusion
In this study we examined the role of gold as an investment. In order to understand whether gold is a safe or speculative investment, were analyse the factors that may affect the prices of gold, silver, six gold ETFs and five silver ETFs. The relevant factors are: S&P 500, VIX (volatility), interest rate, inflation, US dollar and crude oil returns, from the period from January 2000 to December 2013.
The empirical findings find a weak negative correlation between returns of gold and US dollar. The positive correlation occurred between returns of gold and silver. Whereas weak positive correlation is between return of gold and inflation, return of crude oil and return of gold. The return of S&P 500, VIX and interest rate do not correlate with return of gold. The regression analysis in the study was performed by using Least Square Method, standard errors are robust. We found that return of S&P 500, VIX, interest rate and inflation do not have significant relationship to the returns of gold and silver. The return of US dollar has negative effect on gold and silver returns. When the return of US dollar appreciates (depreciates), this drives the return of gold down (up). The variation of one standard deviation in the return of US dollar, it is expected decrease in variation of returns of gold by 0.21 and silver by 0.16 standard deviations. The return of crude oil has no relationship with return of gold, but it has a weak affect the return of silver at the 10% significant level.
Finally, I checked whether the return of gold had strong affect the return of gold ETFs and the return of silver influences the return of silver ETFs at the 1% significant level. The variation in one standard deviation in the return of gold, it is expected strong variation in return of MARKET VECTORS GD.MINERALS ETF by 1.645. Whereas the variation in one standard deviations in return of silver, it is expected strong variation in returns of ETFS.CMOD SECS.SILVER ETFS by 1.024 and METAL SECS. PHYSICAL SILVER by 1.032 standard deviations.
The return of S&P 500, volatility, interest rate, US dollar and crude oil returns do not reflect the changes in return of the gold ETFs. However, inflation has weak affect the returns of POWERSHARES DB GOLD FD, MARKET VECTORS. GD MINERALS ETF, and ETF MLT SECS. PHYC (LON) GOLD U$, and GOLD BULLION SECS. (LON) ETF USD at the 10% significant level.
31 The return of few silver ETFs such as: POWERSHARES DB. SIL.FD, ETFS METAL SECS PHYSICAL SILVER, ZKB SILVER ETF and ETFS CMOD SECS SILVER are influenced by inflation at the 1% significant level. The variation of the inflation rate will cause immediate changes in returns of these ETFs. Meanwhile, the return of crude oil has strong effect on the returns of ETFS METAL SECS PHYSICAL SILVER, ZKB SILVER ETF and ETFS CMOD SECS SILVER, while it has a weak effect on the return of POWERSHARES DB SILV FD at the 10% significant level. The inflation and return of crude oil do not affect the return of ISHARES SILVER TRUST. The remaining variables are not statistically significant and their changes do not reflect the changes in the return of silver ETFs.
In summary, gold and silver are safe investments which provide diversification benefits for investment portfolio. Gold ETFs and silver ETFs are also an option for investors who seek the benefits from diversification, despite the fact that they are a new investment vehicle in the finance market.
However, the analyzed precious metals have ability to hedge against a weaker US dollar. Investors tend to invest more in gold when the US dollar depreciates which leads to higher prices for precious metals. However, when the US dollar appreciates, investors trust more in paper money rather than gold and silver. Moreover, gold and silver cannot provide strong hedge against inflation. But we believe that investment in gold and silver will provide to investors a possibility to protect their wealth in case of future possible inflation. Investment in gold ETFs provides a weak hedge against inflation. Whereas silver ETFs has ability hedge against inflation and hedge against adverse movements in oil prices.
32
Bibliography
Agyei-Ampomah, S., Gounopoulos, D. & Mazouz, K. 2014. Does gold offer a better protection against losses in sovereign debt bonds than other metals? Journal of Banking and
Finance, Elsevier, vol. 40(C):507-521
Baur, D. G., Lucey, B. 2010. Is gold a hedge or a safe haven? An Analysis of Stocks, Bonds and Gold. Financial Review, vol. 45(2): 217-229.
Baur, D.G. 2013. The autumn effect of gold. Research in International Business and Finance.
27(1): 1-11.
Baur, D.G., McDermott, T. K. J. 2010. Is gold a safe haven? International evidence. Journal
of Banking and Finance, no. 34: 1886-1898.
Beckmann, J., Czudaj, R. 2012. Gold as an inflation hedge in a time-varying coefficient framework. Ruhr Economic Paper: 362, Department of Economics, University of Duisburg-Essen.
Blose, L. E. 2010. Gold prices, cost of carry and expected inflation. Journal of Economics
and Business, 62(1): 35-47.
Brier, K. 2012. Gold is speculative but hardly a bubble. Stock Market News & Financial
Analysis. Seeking Alpha.
Carty, C. M. 2001. ETFs from A to Z. Financial Planning. May 1: 102-106.
Chilkoti, A. and Crabtee, J. 2013. India: Part of the fabric. The Financial Time. October 30. Dorgan, G. 2013. The six major fundamental factors that determine gold and silver prices.
Stock Market News & Financial Analysis. Seeking Alpha.
Dove, J. 2011. Are the Gold ETFs creating a bubble? Investment U research. September 6. Feldman, K. 2010. Insight into investing in gold. The London Bullion Market Association. Finance 27(1): 1-11.
Gallagher, D. R., Segara, R. 2005. The performance and trading characteristics of
Exchange-Traded Funds. Working papers. University of New South Wales.
Goodboy, D. 2013. Gold or silver: Which is better for your portfolio? Yahoo Finance. September 12.
Greenwood, R., Steiner, B. 2011. Gold in 2011: Bubble or Safe Haven Asset? Harvard
Business School Case: 211-095.
Harmston, S. 1998. Gold as a Store of Value. World Gold Council, Research Study, No.22. Helmersson, T., Kang, H. and Sköld, R. 2008. Gold during recessions. Unpublished Bachelor Thesis, Jonkoping International Business School.
33 Hood, M., and Farooq, M. 2013. Is gold the best hedge and a safe haven under changing stock market volatility? Review of Finance Economics, 22(2): 47-52
Lampinen, A. 2007. Gold investment and short-and long-rum price determination of the price
of gold. Unpublished Master’s Dissertation, Lappeenranta University of Technology.
Mallika, M .and Sulphey, M. M. 2013. Gold Exchange Traded Funds – A Behavioural Analysis of Retail Investors in Kerala, Journal of Empirical Research in Management, 1(2): 60-66.
McCown, J. R., Zimmerman J. R. 2006. Is gold a zero-beta asset? Analysis of the investment potential of precious metals, Social Science Research. Network Working Paper, no. 920396. Nathans, L., Oswald, F., and Nimon, K. 2012. Multiple Linear Regressions: A guidebook of variable importance. Practical Assessment, Research & Evaluation, (17): 1-19
Nedeljkovic, V. 2005. The Impact of ETFs on the Gold Market. The London Bullion Market Precious Association Metals Conference 2005, Johannesburg: 127-130.
Prashanta, A., Suhitra, K. 2010. Gold ETFs: An emerged investment option. Sri Krishna
International Research & Educational Consortium: 66-78
Reboredo, J. C. 2013. Is gold a hedge or safe haven against oil price movements? Resources
Policy, Elsevier, vol. 38(2): 130-137.
Shafiee, S., Topal E. 2010. An overview of global gold market and gold price forecasting.
Resources Policy, 35(3): 178-189.
Singh, B., Nadda, J. B. 2013. Gold vs. Stock Market: A Comparative Study of Risk and Return. International Journal of Management & Research, ISSN 2249-6920, 2(3): 103-110. Wang, L., Hussain, I., and Adnan, A. 2010. Gold Exchange-Traded Funds: Current developments and Future prospects in China. Asian Social Science, vol. 6 (7): 1-7.
Worthington, A. C., Pahlavani, M. 2006. Gold investment as an inflationary hedge: cointegration evidence with allowance for endogenous structural breaks. Applied Financial
Economics Letters, 3(4): 259-262.