Zohre Eskandari Alughare
Gold Nanorods Functionalized with DNA Oligonucleotide Probes
for Biosensing and Plasmon-Enhanced Fluorescence Detection
UNIVERSIDADE DO ALGARVE FACULDADE DE CIÊNCIAS E TECNOLOGIA
Zohre Eskandari Alughare
Gold Nanorods Functionalized with DNA Oligonucleotide Probes
for Biosensing and Plasmon-Enhanced Fluorescence Detection
Erasmus Mundus MSc in Chemical Innovation and Regulation Mestrado Erasmus Mundus em Inovação Química e Regulamentação
Trabalho efetuado sob a orientação de: Work supervised by:
Professor Ana Rosa Garcia (Universidade do Algarve) Dr. Pedro M. R. Paulo (Centro de Química Estrutural)
UNIVERSIDADE DO ALGARVE FACULDADE DE CIÊNCIAS E TECNOLOGIA
Zohre Eskandari Alughare
UNIVERSIDADE DO ALGARVE Faculdade de Ciências e Tecnologia
2017
Gold Nanorods Functionalized with DNA Oligonucleotide Probes for Biosensing and Plasmon-Enhanced Fluorescence Detection
Título: Nano-bastonetes de Ouro Funcionalizados com Oligonucleotídos de
ADN para Biosensores e Fluorescência Intensificada por Efeito Plasmónico
Resumo
Os nano-bastonetes de ouro são caracterizados por plasmões de superfície com frequências de ressonância bastante sensíveis ao índice de refração na proximidade da sua superfície. A funcionalização seletiva da superfície destas nanopartículas com bio-receptores é crucial para o desenvolvimento de sensores plasmónicos com resposta melhorada, pois permite a captura de analitos nas regiões mais sensíveis da nanopartícula. Em primeiro lugar foram preparadas superfícies com nano-bastonetes de ouro que depois foram funcionalizados com recetores biotina para ensaios modelo de deteção de estreptavidina. A funcionalização seletiva das extremidades dos nano-bastonetes foi conseguida através da proteção das suas paredes laterais com uma bicamada de tensioativo CTAB e usando uma biotina derivatizada com uma função tiól. O desempenho do sensor foi caracterizado por medidas da cinética de associação biotina-estreptavidina monitorizada por espectroscopia ótica de absorção. Em anos recentes, a infeção pelo vírus do Dengue DENV-2 tem sido relatada como a maior epidemia por este tipo de vírus, e a deteção precoce desta infeção poderia salvar a vida de muitos pacientes. Deste modo, foi desenhado um sensor plasmónico modelo para a deteção de sequências de ARN propostas como bio-marcadores para a infeção pelo vírus do Dengue. Para o efeito, foram funcionalizados nano-bastonetes de ouro com cadeias de oligonucleotídos de ADN complementares a uma sequência do ARN do vírus do Dengue. Como estratégia de amplificação de sinal foram usadas cadeias de oligonucleotídos alvo marcadas com biotina, de modo a ser possível num segundo passo ligar estreptavidina ou anticorpo anti-biotina com o objetivo de aumentar a resposta do plasmão de superfície dos nano-bastonetes de ouro.
A fluorescência intensificada por efeito plasmónico permite a deteção rápida e com elevado contraste de molécula única em microscopia de fluorescência. A interação entre os modos localizados de plasmão de superfície de nano-bastonetes de ouro e moléculas fluorescentes na sua proximidade pode induzir a aceleração das taxas de excitação, decaimento radiativo e não-radiativo, e conduzir a uma intensificação de fluorescência.Na terceira parte desta Dissertação, foram investigadas as interações entre nano-antenas de ouro e um cromóforo pouco fluorescente, a porfirina TMPyP. Esta interação foi mediada pela atração eletrostática entre a porfirina tetra-catiónica e o revestimento de ADN na superfície dos nano-bastonetes de ouro.
Ensaios preliminares de espectroscopia ótica foram realizados para caracterizar a interação em solução da TMPyP com sequências de ADN de cadeia simples ou duplacomplementares a uma sequência do ARN do vírus do Dengue. A constante aparente de equilíbrio para o complexo da TMPyP com as sequências de ADN de cadeia simples e dupla foram determinadas como sendo Ka= 3.9×10⁷ M-1and 4.5×10⁷ M-1, respetivamente. As alterações
dos espectros de absorção e emissão mostram uma forte interação, provavelmente intercalação, daTMPyPcom ods-DNA,etambém com o ss-DNA, devido ao elevado conteúdo em pares GC nas sequências escolhidas. Em seguida, a fluorescência intensificada por efeito plasmónico na TMPyP induzida por nano-bastonetes de ouro foi investigada por microscopia confocal de tempos-de-vida, tendo sido realizadas medidas de intensidade e espectro de emissão de nanopartículas, espectroscopia de correlação de fluorescência, traços temporais de intensidade de emissão e de decaimento de fluorescência.Os nano-bastonetes de ouro foram imobilizados em vidro e funcionalizados com um revestimento de oligonucleotídostiolados, enquanto que as moléculas de TMPyP difundem-se em solução e podem interatuar estocasticamente com a superfície da nanopartícula. Os traços de intensidade de emissão medidos em nanopartículas individuais mostram picos de fluorescência intensos quando as moléculas de TMPyP se aproximam do nano-bastonete de ouro em resultado do efeito de nano-antena.Foram calculados os fatores de emissão intensificada por comparação com a emissão não-intensificada da TMPyP nas mesmas condições experimentais e obtiveram-se valores surpreendentemente elevados de cerca de 60000 vezes para a emissão intensificada da TMPyP. Estes fatores de intensificação são duas ordens de grandeza mais elevados do que as estimativas teóricas calculadas para a intensificação da emissão da TMPyP pelos nano-bastonetes de ouro.
Palavras Chave: Nanopartículas de ouro, biosensores plasmónicos, deteção de ácidos nucleícos, fluorescência intensificada por efeito plasmónico, fluorescência de molécula única, porfirinas
Title: Gold Nanorods Functionalized with DNA Oligonucleotide Probes for
Biosensing and Plasmon-Enhanced Fluorescence Detection
Abstract
Gold nanorods display plasmon resonances that are very sensitive to the refraction index close to the particle’s surface. The site-selective functionalization of Plasmon hot-spots with bioreceptors is crucial to develop plasmonic sensors with improved response bycapturing the target species at the most sensitive regions of the particle. Firstly, we used surface immobilized biotin-functionalized gold nanorods for streptavidin sensing.The selective functionalization of the nanorods’ tips was achieved with a CTAB bilayer and using a thiol linker to attach the desired biotin functionality. The sensor performance was characterized by measuring binding kinetic assays. In the recent years, Dengue virus DENV-2 has been reported as the largest dengue epidemic type and early stage detection of this virus would save the life of many patients. Thus, a plasmonic model biosensor was designed for the detection of RNA sequences proposed as disease biomarkers for Dengue virus.For this purpose, we have functionalized gold nanorods with thiolated DNA oligonucleotide probes complementary to a RNA sequence of Dengue virus.As a signal amplification strategy, we have used biotin-labeled oligonucleotide target sequences, in order to bind streptavidin or anti-biotin antibody to increase the surface plasmon response.
Plasmon-enhanced fluorescence (PEF) microscopy provides fast, high-contrast, and low-background detection of single molecules. The interaction between the localized surface plasmon of gold nanorods and a fluorophore in their vicinity can induce the acceleration of excitation and decay rates thus leading to substantial fluorescence enhancements. In the third part of this Thesis, it was studied the interaction between gold nanorod antennas and a weakly fluorescence dye, TMPyP porphyrin. This interaction was mediated by electrostatic attraction between the tetracationic TMPyP and the DNA oligonucleotide coating on the nanorods’ surface.
Preliminary measurements of optical spectroscopy were carried out to characterize the interaction in solution of TMPyP and single or double-stranded DNA oligonucleotides complementary to a RNA sequence of Dengue virus.The apparent equilibrium constants for the complex of TMPyP with single and double-stranded DNA were determined to be Ka=
3.9×10⁷ M-1and 4.5×10⁷ M-1respectively. The spectral changes show a strong specific intercalation of TMPyP with ds-DNA and ss-DNA because of GC-rich sites in the selected
sequences. Next, the plasmon-enhanced fluorescence of TMPyP induced by gold nanorods was investigated using confocal fluorescence lifetime microscopy to perform measurements of nanoparticle emission intensity and spectrum, fluorescence correlation spectroscopy, emission intensity time trace and fluorescence decay. The gold nanorods were immobilized on glass and functionalized with a thiolated oligonucleotide coating, while TMPyP molecules are diffusing in solution and stochastically interact with the rod’s surface. The emission intensity traces measured on single particles show strong fluorescence bursts when TMPyP molecules come into close proximity of the nanorod. We have calculated the emission enhancement factors from a comparison with the non-enhanced emission of TMPyP in the same experimental conditions and found surprisingly large enhancement factors of around 60000-fold for TMPyP’s emission.These values of enhancement are two orders of magnitude larger than our calculated highest enhanced fluorescence expected for TMPyP molecule.
Key Words: Gold nanoparticles, plasmonic biosensors, nucleic acid detection, plasmon-enhanced fluorescence, single-molecule fluorescence, porphyrins
Subject Index
Cover and spine
Declaration of authorship and copyright
Acknowledgements
Abstract (Portuguese)
Abstract (English)
Figure Index Table Index
List of abbreviations and acronyms
1. Introduction 1
1.1 Dengue Virus disease 1
1.2 Gold Nanoparticles 1
1.3 LSPR 2
1.4 Gold Nanorods 5
1.4.1 Site-selective Functionalization of Plasmon Hot-Spots 6
1.5 SPR 6
1.5.1 LSPR and SPR Comparison 7
1.6 Biotin-Streptavidin 7
1.7 Label-Free Sensing 9
1.8 LSPR in nucleic acid sensing 10
1.9 Porphyrins 11
1.9.1 Porphyrin-DNA Interactions 13
1.9.2 Porphyrin-metal nanoparticles Interactions 14
1.10 Single Molecule Spectroscopy (SMS) 15
1.11 Confocal Microscopy 16
1.11.1 Laser-induced fluorescence 18
1.11.1.1 Data analysis of Lifetime in FLIM 18
1.11.2.1 Engineering of Plasmon-enhanced fluorescence 21
2. Experimental Methods 23
2.1 Materials and Instruments 23
2.2 Preparation of glass immobilized-gold nanorods 23
2.3 Tip-specific functionalization of gold nanorods with biotin receptors 24 2.4 LSPR Sensing of Streptavidin with Biotin-functionalized Gold Nanorods 24 2.5 Nucleic Acid Hybridization and Dengue Virus RNA Biosensing 25 2.6 Interaction of Dengue Virus DNA and TMPyP Porphyrin in solution 26
2.7 Single-Particle Spectroscopy of Gold Nanorods 27
2.7.1 Sample preparation 27
2.7.2 Confocal Fluorescence Lifetime Microscopy 27
2.7.2.1 Single gold nanorods interaction with TMPyP porphyrin 28 2.7.2.2 Gold nanorods functionalized with Dengue virus ss-DNA analogue sequence 28 2.7.2.3 Gold nanorods functionalized with Dengue virus ds-DNA analogue sequence 29 2.7.2.4 Gold nanorods functionalized with AUT interaction with TPPS porphyrin 29
3. Results and Discussion 30
3.1 Localized Surface Plasmon Resonance Sensing of Streptavidin using Biotin-
Functionalized Gold Nanorods 30
3.1.1 Localized Surface Plasmon Resonance Sensing of Streptavidin using Bare
Gold Nanorods 31
3.1.2 The Effect of Biotin Receptor Density in the Plasmonic Sensor Model 32
3.2 Interaction of Dengue Virus DNAand TMPyP+4 in solution 35
3.2.2 Double-strand Dengue Virus DNA oligonucleotide 36
3.2.3 Determination of association constant of TMPyP with Dengue Virus DNA 41 3.2.4 Time-Resolved Optical Spectroscopy of TMPyP interaction with Dengue
Virus DNA in solution 42
3.3 Functionalization of Gold Nanorods with DNA Probe for Dengue Virus RNA
Sensing 44
3.3.1 Tip Functionalization of Gold Nanorods with DNA Probe for Dengue Virus
RNA sensing 44
3.3.2 Full Functionalization of Gold Nanorods with DNA Probe for Dengue Virus
RNA sensing 46
3.3.3 Full Functionalization of Gold Nanorods with a mixed monolayer of DNA and
3.4 Single-Particle Spectroscopy of Gold Nanorods and Confocal Fluorescence
Lifetime Microscopy 52
3.4.1 Single gold nanorods functionalized with ss-DNA oligonucleotides and
TMPyP 52
3.4.1.1 Time Correlated Single Photon Counting (TCSPC) 57
3.4.1.2 Photoluminescence of single gold nanorods 58
3.4.2 Single gold nanorods functionalized with ds-DNA oligonucleotides and
TMPyP 60
3.4.2.1 Time Correlated Single Photon Counting (TCSPC) 66
3.4.2.2 Photoluminescence Intensity of glass-immobilized single gold nanorods 67 3.4.3 Single gold nanorods functionalized with AUT interaction with TPPS
Porphyrin 68
3.4.3.2 Photoluminescence Intensity of glass-immobilized single gold nanorods 72 3.5 Comparison of porphyrin emission enhancement on gold nanorods 73
3.5.1 LSPR 73
3.4.3.2 Photoluminescence Intensity of glass-immobilized single gold nanorods 74 3.5 Comparison of porphyrin emission enhancement on gold nanorods 76
3.5.3 Time Correlated Single Photon Counting (TCSPC) 76
3.5.4 Top Fluorescence Enhancement factor and Photoluminescence Intensity 78
4. Conclusions 80
Bibliography 81
Annexes 95
Figure Index
1.1 GNRs solutions with different aspect ratios that show different colors 3 1.2 (a) Schematic illustration of LSPR excitation for GNSs; (b) A typical LSPR
absorption band of GNSs 3
1.3 (a) Schematic illustration of LSPR excitation for GNRs; (b) LSPR absorption
bands of GNRs: longitudinal and transverse plasmon bands 4
1.4 (a) Plasmon near field (top) from simulation of a gold nanorod 30 nm × 10 nm irradiated at the LSPR wavelength;(b)Plasmon near field (top) from simulation of a gold nanorod 60 nm × 25 nm irradiated at the LSPR wavelength (~650 nm) using
the method of Discrete Dipole approximation. 6
1.5 (a) The dose_response curve for streptavidin detection with biotin-functionalized gold nanorods in PBS and 40% Human Serum; (b) The dose response curve for
ADDL (a marker against NP-anti ADDL. 9
1.6 (a) Structure of porphyrin and tautomerism; (b) Porphyrin’s powder and
solution. 11
1.7 Chemical Structure of
5,10,15,20-tetrakis(N-methylpyridinium-4-yl)-21H,23H-porphyrin (TMPyP4+) 12
1.8 Soret bond and Q-bonds of Porphyrin change to free base example in absorption
spectra 13
1.9 Jablonski diagram, when an electron absorbs a high energy, then the electron
relaxes fluoresces with a longer wavelength. 16
1.10 Principle of confocal microscopy 18
1.11 TCSPC histogram [201] 19
1.12 Schematic simplified plasmon enhanced fluorescence 20
1.13 (a) SEM image of gold nanorods; (b) Simulation of near field around a single nanorod; (c) Fluorescence imaging of single molecule detection that enhanced by
nanorods 21
3.1 (a) Absorption spectra of biotin-functionalized gold nanorods (30nm x 10nm)with PEG-4 linker(1 µM) in PBS before binding assay with streptavidin (black curve); (b) the same sample after binding assay with streptavidin solution of 100 nM concentration (red curve),and; (c) after binding assay with streptavidin solution of 1000 nM concentration (green curve) – spectra have been subtracted
froman offset. 30
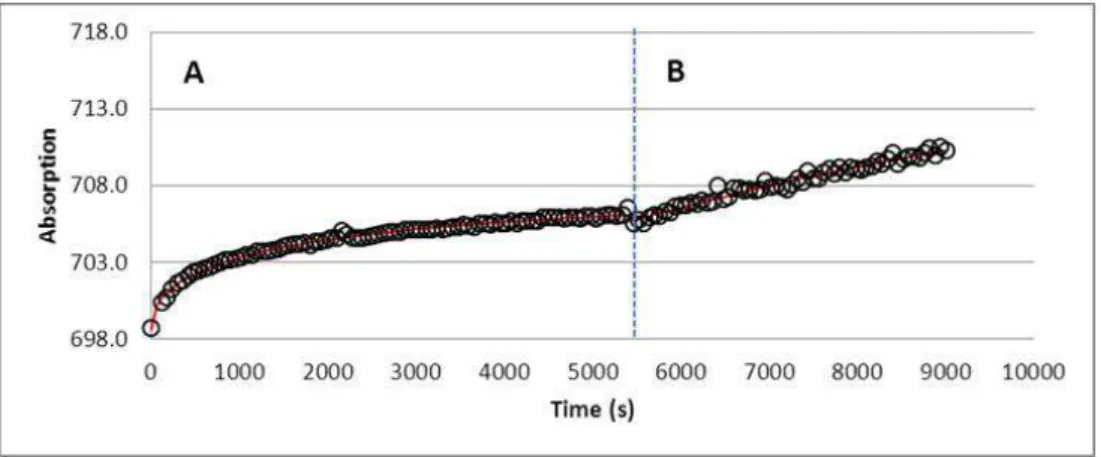
3.2 A) Binding kinetic curve of biotin-functionalized gold nanorods (30nm x 10nm) with PEG-4 linker (1 µM) with streptavidin solution 100 nM (black symbols) and fitted curve using a stretched-exponential (red color); B) Binding kinetic curve after increasing streptavidin concentration to 1000 nM (black symbols).
31 3.3 Plasmon peak shift for streptavidin sensing with gold nanorods functionalized with PEG-4 versus the linker concentration used in tip-specific functionalization and
also for full functionalization, as reported in reference [248]. The error bars represent the standard deviation for at least three independent measurements .
33
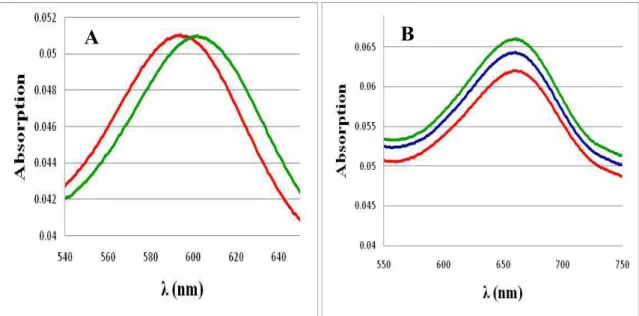
3.4 Plasmon peak shift for streptavidin sensing with gold nanorods functionalized with PEG-4 versus the linker concentrations used in tip-specific functionalization and also for full functionalization, as reported in reference [248]. The error bars represent the standard deviation for at least two or three independent measurements. 34 3.5 Absorption spectra in the Soret band region of TMPyP in the presence of Dengue Virus ss-DNA oligonucleotide for concentration ratios of 0.02, 0.01, 0.1, 0.2, 0.5, 1, 2 compared to the absorption spectrum of a TMPyP solution with 1µM
concentration in PBS buffer solution. 35
3.6 Absorption spectra in the Q bands region for TMPyP in the presence of Dengue Virus ss-DNA oligonucleotide for concentration ratios of 0.02, 0.01, 0.1, 0.2, 0.5, 1, 2 compared to absorption spectrum of a TMPyP solution with 1µM concentration in
PBS buffer solution. 36
3.7 Absorption spectra in the Soret band region of TMPyP in the presence of Dengue Virus ss-DNA oligonucleotide for concentration ratios of 0.02, 0.01, 0.1, 0.2, 0.5, 1, 2 compared to the absorption spectrum of a TMPyP solution with 1µM
concentration in PBS buffer solution. 37
3.8 Absorption spectra in the Q-bands’ region of TmPyP in the presence of Dengue Virus ds-DNA at concentration ratios of 0.02, 0.01, 0.1, 0.2, 0.5, 1, 2 compared to absorption spectrum of a TMPyP solution with 1µM concentration in PBS buffer
solution. 37
3.9 Emission spectra at 590 wavelength fluorescence emission of TmPyP in the TmPyP-Dengue-ss-DNA solutions with different concentration ratio of 0.02, 0.01, 0.1, 0.2, 0.5, 1, 2 compared to emission spectra of TmPyP solution with 1µM
concentration in PBS buffer solution. 38
3.10 Emission spectra excited at 410 wavelength fluorescence emission of TmPyP in the TmPyP-Dengue-ss-DNA solutions with different concentration ratio of 0.02, 0.01, 0.1, 0.2, 0.5, 1, 2 compared to emission spectra of TmPyP solution with 1µM
concentration in PBS buffer solution. 39
3.11 Emission spectra excited at 590 wavelength fluorescence emission of TmPyP in the TmPyP-Dengue-ds-DNA solutions with different concentration ratio of 0.02, 0.01, 0.1, 0.2, 0.5, 1, 2 compared to emission spectra of TmPyP solution with 1µM
concentration in PBS buffer solution. 40
3.12 Emission spectra excited at 410 wavelength fluorescence emission of TmPyP in the TmPyP-Dengue-ds-DNA solutions with different concentration ratio of 0.02, 0.01, 0.1, 0.2, 0.5, 1, 2 compared to emission spectra of TmPyP solution with 1µM
concentration in PBS buffer solution. 40
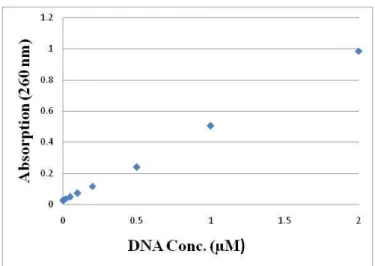
Figure 3.13 Absorbance at 260 nm versus the DNA concentration in Dengue-ds-DNA solutions with TMPyP at different ratios of 0.02, 0.01, 0.1, 0.2, 0.5, 1, 2. 41
3.14 Absorbance at 420 nm and 440 nm versus the DNA concentration in Dengue-ds-DNA solutions with TMPyP at different ratios of 0.02, 0.01, 0.1, 0.2, 0.5, 1, 2. 42 3.15 Absorbance at 420 nm and 440 nm versus the DNA concentration in Dengue-ss-DNA solutions with TMPyP at different ratios of 0.02, 0.01, 0.1, 0.2, 0.5, 1, 2. 42 3.16 Comparison of Fluorescence life time decay of TMPyP in solution (green), Complex-ss-DNA-TMPyP in solution (orange), Complex-ds-DNA-TMPyP in
solution (gray) 43
3.17 A) Tip functionalization of gold nanorods with thiolated ss-DNA probe sequence (blue and red curves are before and after functionalization, respectively, ∆LSPR =19.1 nm) , B) Plasmon peak before adding the target Dengue Virus RNA sequence in PBS solution (red curve), after adding the target sequence(100 nM) (green curve), and after increasing the target concentration (1000 nM) (blue curve),
∆LSPR =0. 45
3.18 A) Tip functionalization of gold nanorods with thiolated ss-DNA probe sequence (blue and red curves are before and after functionalization, respectively, ∆LSPR =28 nm) , B) Plasmon peak before adding the target Dengue Virus RNA sequence in PBS solution (red curve), after adding the target sequence (100 nM) (green curve), and after increasing the target concentration (1000 nM) (blue curve),
∆LSPR =0. 45
3.19 A) The proposed biosensor system for tip functionalization of gold nanorods with a thiolated ss-DNA probe sequence using a CTAB protective layer. Then, it is shown the hybridization with a biotin-labeled target RNA sequence from Dengue virus and amplification through binding of streptavidin, B) The CTAB makes a positive charge bilayer and the electrostatic attraction between CTAB and negatively charged DNA makes a thick layer on the surface of the gold nanorod. 46 3.20 A) Full functionalization of gold nanorods with thiolated ss-DNA probe sequence (red and green curve is before and after functionalization, respectively), ∆LSPR =7.8 nm, B) Plasmon peak before adding complementary Dengue virus target RNA in PBS buffer solution (red curve), after adding target sequence (100 nM) (green curve), and after increasing concentration of target sequence (1000 nM)
(blue curve). 47
3.21 A) kinetics assay for hybridization sensing of fully-functionalized gold nanorods with ss-DNA probe upon adding the complementary Dengue virus RNA sequence (100 nM) during 90 mins (∆LSPR = -0.5 nm) and fitting function (red line), B) kinetics assay after increasing concentration of complementary RNA sequence (1000 nM) during 60 mins (∆LSPR = -0.3 nm), C) kinetic binding assay upon exposing the previous surface to streptavidin toward signal amplification
(∆LSPR =2 nm). 48
3.22 A) Full functionalization of GNRs with single strand Dengue Virus DNA receptor (red curve is before functionalization and green curve is after functionalization), ∆LSPR =9.1 nm, B) Plasmon response before adding non-complementary sequence Dengue Virus RNA in PBS buffer solution (red curve),
plasmon response after adding non-complementary sequence Dengue Virus RNA (100 nM) (green curve), plasmon response after adding non-complementary
sequence Dengue Virus RNA (1000 nM) (blue curve). 49
3.23 A) kinetics assay for hybridization sensing of fully-functionalized gold nanorods with ss-DNA probe upon adding the non-complementary sequence Dengue Virus RNA (100 nM) during 90 mins (∆LSPR = -0.8 nm) and fitting function (red line), B) kinetics assay after increasing concentration of the non-complementary sequence Dengue Virus RNA (1000 nM) during 60 mins (∆LSPR = -0.3 nm), C) kinetic binding assay upon exposing the previous surface to streptavidin toward
signal amplification (∆LSPR =2.7 nm). 49
3.24 The design of our biosensor system for full functionalization of gold nanorods with a ss- DNA probe (binded non-specifically) and plasmonic sensing with complementary RNA sequence from Dengue Virus and a non-complementary sequence, and binding of streptavidin (non-specifically) toward amplification of
plasmon response. 50
3.25 Full functionalization of gold nanorods with ss-DNA probe sequences in a mixed monolayer with a thiolated PEG-4-SH spacer for both complementary RNA sequence and a non-complementary sequence, anti-biotin antibody binding assay. 51 3.26 Scanning confocal image of glass immobilized single gold nanorods immersed
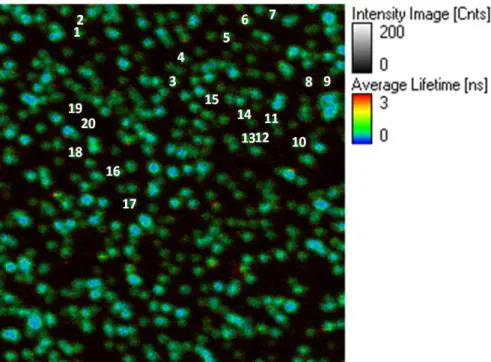
in PBS buffer excited at 480 nm. 53
3.27 LSPR band of single gold nanorods in PBS (5 particles shown here) fitted with
a Lorentzian function. 53
3.28 Lorentzian fitting function to calculate the LSPR of single gold nanorods after
Functinalization with Single Strand Dengue Virus DNA 54
3.29 Fluorescence intensity versus the time of TMPyP interacting with a gold nanorod functionalized with ss-Dengue DNA analogue sequence showing intense fluorescence bursts with aximum of 120 counts/ms (red) and control measurement on the same nanorod showing the background signal measured before adding
TMPyP in solution (blue) 55
3.30 Fluorescence intensity versus the time of TMPyP interacting with anon-functionalized single gold nanorod showing a weak fluorescence burst with a
maximum of only 36 counts/ms. 55
3.31 Histograms of frequency versus emission intensity of TMPyP porphyrin on gold nanorods functionalized with ss-DNA (blue) and fitted Gaussian function (green).
56 3.32 Top fluorescence enhancement factor of ss-Dengue Virus DNA functionalized single gold nanorods on glass with TPMPyP solution compared to the calculated maximum fluorescence enhancement factor of single gold nano rods with TMPyP 57
3.33 Fluorescence decay of TMPyP’s emission on a single gold nanorod
functionalized with Dengue Virus ss-DNA analogue sequence. 58
3.34 Photoluminescence Intensity of glass-immobilized single gold nanorod for an
excitation wavelength of 480 nm 59
3.35 The TEM image of gold nanorod sample used as purchased. 59 3.36 Top fluorescence enhancement factors versus the photoluminescence intensity of single gold nanorods excited at 480 nm (left graph) and excited at 640 nm (right
graph. 60
3.37 Scanning confocal image of glass immobilized single gold nanorods excited at
480 nm in PBS buffer. 61
3.38 LSPR band of single gold nanorods in PBS (5 particles shown here) fitted with
a Lorentzian function. 61
3.39 Lorentzian fitting function to calculate the LSPR of single gold nanorods after Functinalization with Double Strand Dengue Virus DNA (5 particles) 62 3.40 Fluorescence intensity versus the time of TMPyP interacting with a single gold nanorod functionalized with ds-Dengue DNA analogue sequence showing intense fluorescence bursts with a maximum of 120 counts/ms (red) and control measurement on the same nanorod showing the background signal measured before
adding the TMPyP in solution (blue). 63
3.41 Gaussian fitting graph of single gold nanorod-TMPyP system (green graph), ds-Denv2-TMPyP functionalized single gold nano particles (blue graph) 64 3.42 Top fluorescence enhancement factor of ds-Dengue Virus DNA functionalized single gold nanorods on glass with TPMPyP solution compared to the calculated maximum fluorescence enhancement factor of single gold nanorods with TMPyP 64 3.43 Comparison of top fluorescence enhancement of Complex ds-Dengue DNA-TMPyP functionalized single gold nanorods –DNA-TMPyP (20 nM) (red), ds-Dengue DNA functionalized single gold nano rods-TMPyP (20 nM) (blue) 65 3.44 Fluorescence decay of TMPyP’s emission in the presence of single gold nanorod Functionalized with Dengue virus ds-DNA analogue sequence 66 3.45 Photoluminescence intensity of glass immobilized single gold nanorod at laser
excitation wavelength of 480 nm 67
3.46 Top fluorescence enhancement factor versus the photoluminescence intensity of single gold nanorods excited at 480 nm (left graph) and 640 nm (right graph).
67 3.47 A) Chemical structure of 11-amino-1-undecanethiol (AUT) used as a positively-charged spacer, and B) TPPS used as a negatively-charged porphyrin. 68
3.48 Comparison of absorption and emission spectra of TPPS4-and TMPyP4+porphyrins [253].
69 3.49 Scanning confocal image of glass-immobilized single gold nanorods excited at
480 nm in PBS buffer. 70
3.50 Top Fluorescence enhanced (fluorescence burst) with maximum counts of 44 photons of AUT functionalization of single gold nano particles with TPPS (100 nM) 71 3.51 Top Fluorescence Enhancement Factor of AUT-functionalized single gold nano particles with TPPS (100 nM) versus their plasmonic resonance wavelength. 72 3.52 Photoluminescence intensity of glass immobilized single gold nanorod at laser
excitation wavelength of 480 nm 72
3.53 Top fluorescence enhancement factor versus the photoluminescence intensity of single gold nanorods excited at 480 nm (left graph) and 640 nm (right graph). 73 3.54 Comparison of top fluorescence enhancement of Complex ds-Dengue DNA-TMPyP functionalized single gold nanorods –DNA-TMPyP (20 nM) (red), ds-Dengue DNA functionalized single gold nano rods-TMPyP (20 nM) (blue), ss-Dengue DNA functionalized single gold nanorods-TMPyP (20 nM) (green), calculated maximum fluorescence enhancement for single gold nanorods –TMPyP (pink) 74 3.55 Comparison of TCSCP of Complex ds-Dengue DNA-TMPyP functionalized single gold nano rods –TMPyP (20 nM) (red), ss-Dengue DNA functionalized single gold nano rods-TMPyP (20 nM) (blue light), ds-Dengue DNA functionalized single gold nano rods-TMPyP (20 nM) (blue dark), Complex-ss-DNA-TMPyP in solution (orange), Complex-ds-DNA-TMPyP in solution (gray), TMPyP in solution (green). 78 3.56 Top fluorescence enhancement factor versus the photoluminescence intensity of single gold nanorods excited at 480 nm for Complex-ds-DNA-TMPyP-Functionalized single GNRs (red), ds-DNA -Complex-ds-DNA-TMPyP-Functionalized single GNRs -TMPyP (blue), ss-DNA -Functionalized single GNRs -TMPyP (green), AUT-functionalized
single GNRs-TPPS (black) 79
3.57 Top fluorescence enhancement factor versus the photoluminescence intensity of single gold nanorods excited at 640 nm for Complex-ds-DNA-TMPyP-Functionalized single GNRs (red), ds-DNA -Complex-ds-DNA-TMPyP-Functionalized single GNRs -TMPyP (blue), ss-DNA -Functionalized single GNRs -TMPyP (green), AUT-functionalized
Table Index
1.1 Overall Comparison of SPR and LSPR sensors 7
3.1 Plasmon peak shifts with standard deviations for streptavidin sensing with gold nanorods functionalized with different concentration of PEG-4 linker 31 3.2 Comparison of fluorescence life time decay of free TMPyP solution with
complex-ss-DNA-TMPyP and complex-ds-DNA-TMPyP in solution.
43 3.3 Full Functionalization of gold nanorods with a mixed monolayer of thiolated
DNA and PEG-4-SH and results from plasmonic sensing. 52
3.4 Fluorescence lifetime values and relative contributions of TMPyP’s emission on a single gold nanorod functionalized with Dengue Virus ss-DNA analogue sequence. 58
3.5 Comparison of photophysical properties of TPPS4- and TMPyP4+ porphyrins [253].
69
3.6 Comparison of LSPR changes for the porphyrin-gold nanorod systems 73
3.7 Comparison of top fluorescence enhancement factor for the porphyrin-gold
nanorod systems 74
3.8 Comparison of TCSCP of free TMPyP solution with the fluorescence burst in
List of abbreviations and acronyms
A Adenosine
AUT 11-Amino-1-Undecanethiol
C Cytosine
CD Circular Dichroism
CLSM Confocal Laser Scanning Microscopy CTAB Cetyltrimethylammonium Bromide DENV_2 Dengue Virus Typ II
DNA Deoxyribonucleic acid
Ds-DNA Double Strand Deoxyribonucleic acid DDA Discrete Dipole Approximation FCS Fluorescence correlation spectroscopy FLIM Fluorescence-Lifetime Imaging Microscopy
G Guanine
GNPs Gold Nanoparticles
GNSs Gold Nanosphares
GNRs Gold Nanorods
LEDs Light-Emitting Diodes LIF Laser-induced fluorescence
LOD Limit of Detection
LPB Longitudinal Plasmon Band
LSPR Localized Surface Plasmon Resonance
MNPs Metal Nanometals
NSOM Near-field scanning optical microscope PBS Phosphate-Buffered Saline
PEF Plasmon-enhanced fluorescence
PEG Polyethylene Glycol
PL Photoluminescence
RNA Ribonucleic acid
SA Streptavidin
SEM Scanning Electron Microscopy
SPR Surface Plasmon Resonance
Ss-DNA Single Strand Deoxyribonucleic acid
T Thymine
TCSPC Time-Correlated Single-Photon Counting TEM Transmission Electron Microscopy
TMPyP4+ 5,10,15,20-tetrakis(N-methylpyridinium-4-yl)-21H, 23H-porphyrin
TPB Transverse Plasmon Band
TPPS Tetraphenylporphyrin Sulfonate Uv-Vis UltraViolet-Visible
1
1. Introduction
Biosensors are being developed for many applications including clinical diagnostics, medical and pharmaceutical developments, drug detection, quality control of food and environmental [1]. In the recent years, the fields of nanotechnology and diagnostics have opened up new perspectives in biosensor development [2].
1.1 Dengue Virus Disease
Over the last decades, the discovery of biomarkers has played a prominent role for the creation of new diagnosis tools towardthe early detection of diverse diseases [3].
More than half population of the world in 100 countries suffers from the endemic Dengue disease [4-5]. Dengue is a viral mosquito-borne disease from the Flavivirus genus with four serotypes (DENV1-4) that cause fever in the patients infected with dengue virus at tropic and subtopic regionsof the earth [6]. In the recent years, DENV-2 has been reported as the largest dengue epidemic type. Early stage diagnosis of Dengue Virus allows for a better control of diseaseby giving time to prevent the disease’s spread [7]. Various types of biosensors have been applied to detect biomarkers for the diagnose of dengue [8]. However, most of these methods are not adequately sensitive and specific for a stand-alone diagnostic tool, so new efforts and biosensing tools especially nanotechnology-based tools are still required [9].
1.2 Gold Nanoparticles
Nano-structured materials have different physical and chemical properties compared to the bulk materials, and these differences have paved the way for multiple applications in the fields of medicine, electronics, catalysis, etc…[10]. Nano-biotechnology is one of the fastest advanced areas of biomedical research. In recent years, nanoparticles have been successfully employed in hyperthermia or radiotherapy cancer treatments, photodynamic therapy, as drug carriers to tumors, and labels for bio-imaging [11]. Nanoparticles ofsmall size can be compared to biological molecules such as antibodies, receptors, and enzymes. Nanomaterials or nanoparticles interact with the biological environment and change the surrounding biological activity.Thestudy of these interactions can be employed for biosensor technology, diagnostic and therapeutic application. A biosensor is an analytical device that basically
2
consists of two components: a recognition element to attach the target analyte, and a transducer to convert the subtle biomolecular interactions into adetectable signal, mostly as electrical signal. Biosensors based on metal nanoparticles have shown an enormous growth in the recent years [12-13].
One of the most important metal nanoparticles are gold nanoparticles (GNPs). Many research and advanced applications of gold nanostructures have been developed only in the recent decades. Engineering of gold nanoparticles have been employed to developsystems of targeted delivery of drugs and imaging labels,thus overcoming many biological, biophysical, and biomedical obstacles. The historical background of gold nanoparticles comes back to the ancient Chinese and Egyptians in the fifth or fourth century B.C [16]. Some evidences have shown that the ancient Romans used gold colloids to stain glass red or mauve [17].
Gold nanostructures have specific properties interesting for different areas of applied science and technology, which comprise optical and electronic properties, a large surface-to-volume ratio, and flexibility of surface modification.These unique properties have brought intensive focus on the development of simple and effective methods in nanotechnology for diverse biomedical applications, including diagnostic assays, gene and drug delivery to target tissues or tumors and as enhancers/sensitizers of radiotherapy [18]. In recent decades, many research works have been developed to tailor the properties of GNPs for specific applications, especially in sensor development [19]. Different synthetic methodologies provide various properties such as morphology, solubility, stability and surface functionality [20-22].
Gold nanoparticles can be synthesized with a variety of shapessuch as gold nanospheres, nanorods, nanoshells, and nanocages. One of most common methods to synthesize gold nanospheres (with sizes of 2 nm to over 100 nm in diameter) is the facilereduction of an aqueous HAuCl4 solution in the presence of different reducing agents under various
conditions [23].
1.3 LSPR
When incident light interacts with metal nanoparticles, it launches a collective coherent oscillation of the surface conduction electrons of the metal.This phenomenon is termed Localized Surface Plasmon Resonance (LSPR). The light interaction with the metal nanoparticles causes a charge separation between the free electrons and their ionic metal core
3
and the strong coulomb attraction acts as the restoration force for the motion of free electrons, which results in the collective LSPR oscillation [24-25].
The strong absorption of light by the MNPs with different shapes, sizes, and compositions shows different absorption properties for LSPR and these display different colors, such as shown in Figure1.1 [26]. In this figure, aqueous solutions gold nanorods (GNRs) of varying aspect ratios show a range of different colors.
Figure 1.1 GNRs solutions with different aspect ratios that show different colors
Figure 1.2 (a) illustrates the excitation of LSPR for a spherical nanoparticle. The optical absorption spectrum of gold nanosphares (GNSs), shows only one band, Figure 1.2 (b) [26].
Figure 1.2 (a) Schematic illustration of LSPR excitation for GNSs;(b) A typical LSPR absorption band of GNSs
But GNRs (Figure 1.3 (a) and 1.3 (b)), have two extinctionbands including longitudinal plasmon band (LPB) and the transverse plasmon band (TPB), that are related to the electron oscillation along the long and the short axes of the GNR, respectively [26].
4
Figure 1.3 (a) Schematic illustration of LSPR excitation for GNRs; (b) LSPR absorption bands of GNRs: longitudinal and transverse plasmon bands
The LPB resonance wavelength of GNRs is the most sensitive to the surrounding refractive index.Moreover, by increasing the aspect ratio of GNRs, the LPB shows a red-shift and of the sensitivity to the local refractive index also increases. Consequently, the properties of the LSPR are dependent on the size, shape and dielectric propertiesof the metal, as well as those of the local surrounding medium [27-30]. The sensitivityof LSPR to the change of refractive index in the surrounding environment can give useful information about binding of analytes to the surface of nanoparticle. In many sensor schemes, the change of the peak wavelength in the optical spectrum of MNPs is used to signal molecular recognition events [31-32].
Light absorption by LSPR ofspherical MNPs can be theoretically describedby the Mie solution to Maxwell’s equations. According to Mie theory for well separated spherical nanoparticles with a radius R (this being much smaller than the wavelength of light, R/λ <0.1), the extinction cross-section, Cext, can be expressed as:
Cext = (1/λ) (24π2R3Nεm3/2) [εi/((εr + 2εm)2 + εi2)] Equation 1
In this formula, εm is the dielectric constant of the surrounding environment, εr is the real part,
5
unit volume. As indicated by Eq. 1, the plasmon resonance wavelength occurs when εr= −2εm. For gold and silver spherical nanoparticles, their plasmon absorption bands are located in the visible region, making these materials particularly suitable for many sensor applications.
In accordance to the Mie theory, when radius (R) of spherical particles is smaller than the wavelength of light (λ), the magnitude of the scattering cross-section will be proportional to R6, and that of the absorption will be proportional to R3. So due to these prefactors, the LSPR extinction of small particles is dominated by absorption, and upon increasing theparticle size, then scattering takes over.
The sensitivity of metal nanoparticles to the refractive index is dependent not only to the material composition and particle size, but also on the aspect ratio. Elongated nanoparticles such as gold nanorods and gold nano-bipyramids are well-described by spheroidal models, for example, in gold nanorods with radius of 10 nm, the sensitivity increases from 157 to 497 nm/RIU when aspect ratio increases from 1.0 (spheres) to 3.4. For nanorods with the same aspect ratio but different sizes, the larger nanorods have higher refractive index sensitivity [33-34].
LSPR sensors have the flexible design with the low cost in terms of sensor fabrication and it does not require prisms or other optical components. In addition, LSPR sensors can either be fabricated by immobilizing MNPs on a hard substrate, such as glass slide or an optical fiber, or soft flexible substrate such as paper or by suspending MNPs in solution to form a solution-phase based LSPR sensor [35-40]. Moreover, LSPR sensors can even be fabricated based on single nanoparticle, because LSPR is highly localized at each individual MNPs. There are some LSPR biosensors that have superior sensitivity compared to the traditional bulk metal film based SPR biosensors. These advantages of LSPR biosensors over SPR have significantly prompted effort to develop sensitive LSPR biosensors and numerous promising LSPR biosensor designs continue to be reported in the literature [41-42].
1.4 Gold Nanorods
Because of the easy synthesis of spherical gold nanoparticles and their high sensitivity to localrefractive index, many LSPR biosensor had been focused on the GNS, however, the recent developments in LSPR are based on other shapes of MNPs to reach higher
6
sensitivities. Gold nanorods (GNRs) have demonstrated unique optical properties, such as higher refractive index sensitivity and a tunable longitudinal plasmon band that show excellent characteristics as LSPR biosensors [26]. Moreover, GNRs have also been applied in many other fields such as SERS sensing, chemical imaging and in cancer therapy [43-45].
1.4.1 Site-selective Functionalization of Plasmon Hot-Spots
The tips of gold nanorods are hot-spots of plasmon field enhancement for the longitudinal LSPR mode. The sensitivity to local refractive index is much higher at the plasmon hot-spots. This unique property can be used for designing of plasmonic model sensor in which tip functionalization of nanorods with receptor provides more sensitivity and selectivity for the target sensing [46-47]. Figure 1.4, demonstrates plasmon near field using the method of Discrete Dipole approximation from simulation of a gold nanorod of 10 nm irradiated at the LSPR wavelength (~700 nm) that is much higher than for a gold nanorod 25 nm irradiated at the LSPR wavelength (~650 nm). As it can be concluded these hot spots are also dependent onthe aspect ratio of nanorods, which can be tunedto enhance the sensitivity of model sensor [48-49].
Figure 1.4 (a) Plasmon near field (top) from simulation of a gold nanorod 30 nm × 10 nm irradiated at the LSPR wavelength; (b) Plasmon near field (top) from simulation of a gold nanorod 60 nm × 25 nm irradiated at the LSPR wavelength (~650 nm) using the method of
Discrete Dipole approximation.
1.5 SPR
SPR (surface plasmon resonance) is similar to LSPR, but instead of localized plasmon modes, it is based on surface plasmon polaritons on a gold film.The SPR sensitivity to thelocal refractive index is probed by a change in reflected laser light passed through a prism and reflected off from the back of the film. SPR is an important surface analytical technique
7
because it allows detecting sub monolayer quantities of analyte at the gold film surface and it also allows to measure kinetics data through continuous optical measurements [50]. However, one disadvantage of SPR sensors is lack of localized sensing volume, consequently, it usually needed a thick polymer layer or matrix to cover the gold film surface that must be functionalized with the capture antibodyor other similar bio-receptor. Even though SPR is widely used to study the biomolecular interactions especially for antibody screening regarding to diagnostic and therapeutic applications, it is not widely used in clinical immunoassays or other non-research applications, because it has a lower sensitivity compared to other techniques, and it requires complex optical instrumentation and precise temperature control [51-53].
1.5.1 LSPR and SPR comparison
LSPR sensing with nanoparticle substrates have considerable advantages over the SPR such as simple optical extinction measurement, no temperature sensitivity and requiring common simple laboratory equipment that greatly broaden the scientific and technological applications of LSPR compared to SPR[16]. In addition, nanoparticles have a highly LSPR sensing volume, so LSPR does not need a polymer matrix to trap molecule of interest in contrast to SPR (Table 1.1) [54].
Table 1.1 Overall Comparison of SPR and LSPR sensors
Comparison Parameter LSPR SPR
Bulk dielectric Sensitvity (nm/RIU) 102 106
Sensing Distance (nm) 10 1000
Temperature Sensitive No Yes
Simple Instrument Yes No
1.6 Biotin-Streptavidin
Biotin−streptavidin linkages are useful tool in nanobiotechnology because the association of streptavidin with biotin is among the strongest known noncovalent protein-ligand interactions (2.5 × l013 M-1) with exceptionally low dissociation rate [55]. This extremely high binding
8
affinity of the noncovalent interaction isused for many diagnostic assays that require the formation of an irreversible and specific linkage between biological macromolecules [56]. Although the nature of the biotin-streptavidin interaction is not fully understood. Many research works based the structural and biophysical analysis of the biotin-streptavidin system reveal that the high affinity between Biotin and Streptavidin is due to the multiple hydrogen-bonding interactions, coupled with a deep hydrophobic pocket formed by aromatic residues [57-59]. For example, six H-bonds between the biotin’s bicyclic frame and streptavidin,as well as five contacts with the urea functionality and one with thethioether has been determined, in addition, four tryptophan aromatic rings make up the biotin-binding site and shape a deep hydrophobic pocket in streptavidin.
Another reason for importance of streptavidin-biotin couple is thatstreptavidin (SA) has four equivalent sites to bind with biotin (two biotin can interact on one side of the protein and two on the opposite). These sites can be used to link streptavidin irreversibly to up to four biotinylated molecules. The biotin bindinghas minimal impact on the biological properties (recognition specificity, catalytic activity, etc.) of the secondary molecules. So, streptavidin has been identified as a molecular linker in many assays, sensors, purifications and in biotechnology [60].
Site-directed mutagenesis techniques are a new way to alter most of the direct binding contacts to biotin, in which off-rates increase with lower binding affinities making facile capture and release properties compared to the native streptavidin.This strategy is useful for delivering cancer therapeutics through the faster dissociation kinetics and exchange of blocking endogenous biotin with the biotinylated therapeutic [61]. Moreover, these sites are useful for immobilizing secondary molecules chemically modified with biotin without impact on the biological activity (e.g., specificity) of the immobilized molecules. Biotin-streptavidin is especially used in LSPR sensing because biotin with small volume is binded to the nanoparticle surface and after interaction with the larger streptavidin protein it can be detected through the contrast of refractive index. Many LSPR assays of biotin strepatividin interactions have been published, namely, biotin-containing binary alkylthiolate monolayers (BTMs) on gold surfaces immobilize SA with high coverage, specificity, and activity. This makes these SA monolayers as convenient substrates for the development of advanced biosensors [16].
9
The detected concentrations of streptavidinare in broad range of picomolar to micromolar concentrations because of variations in the observed Keq of the dose response curves due to
different affinity obtained upon different experimental conditions. In solution, binding constant of the biotin streptavidin is on the order of 1014M-1 that in principle it would provide femto molar sensitivities. The reduction of affinity can be related to the effects of conjugation of biotin to the nanoparticle surface such as steric hindrance and limited mobility. However, biotin- functionalized nanorods do not show any plasmonic response upon exposure to non specific targets such as bovine serum albumin, antibodies, and biotin-saturated streptavidin which demonstrates the specificity of this sensing system. Streptavidin detection has also been tested in serum and dilute blood as shown in Figure 1.5 [62-63].
Figure 1.5 (a) The dose_response curve for streptavidin detection with biotin-functionalized gold nanorods in PBS and 40% Human Serum; (b) The dose response curve for ADDL (a marker for Alzheimer’s disease) against NP-anti ADDL.
1.7 Label-Free Sensing
One advantage of LSPR sensing make it more interesting for the biological and biomedical assays is that it can performed in label-free conditions. In a LSPR sensor, the target molecule is directly detected because of the target’s refractive index [64-67]. This is in contrast to the wide majority of biological sensors based on labels to amplify the target signal [69]. Label-free techniques provide kinetics data but label-based techniques are necessarily carried out as end point assays in that the target is detected through a signal measured before and after analyte exposure. However, labeling strategies for sensors provide biologists considerable signal from small amounts of sample through great amplification and for this purpose many different kind of dye molecules are previously activated for targeting proteins. In labeled sensors, the labels can be radioisotopes, fluorophores, or enzymes [70-71]. In terms of
10
immunoassays, label-based methods usually require two or more antibodies to the target molecule, whereas label-free assays require only one.
1.8 LSPR in nucleic acid sensing
Nucleic acid sensing finds interest in various fields of life science such as pathology, genetics, clinical diagnosis, the food & drug industry, and environmental monitoring.The specific feature is a robust and specific interaction between complementary nucleic acid sequences [72-73]. In recent decade noble metal nanoparticles have been using broadly for nucleic acid detection along with nucleic acid-controlled self-assembly [74]. For the detection ofbiomarker, gold nanoparticles interact with biomolecules, such as nucleic acids, antibodies, proteins and make a stable and benign nanoparticle bioconjugates, while keeping their optical characteristics [75-76]. GNPs coupled to Deoxyribonucleic acid (DNA) or Ribonucleic acid (RNA) probes are well known as platforms for designing of new advanced DNA and RNA sensors, because of biocompatibility, easy functionalization, and stability in many solutions including the biological matrices. Additionally, these particles are useful for enhancement of the precision and accuracy down to single biomolecule sensitivity.As a consequence, a new generation of nucleic acid sensors based on these nanoparticles have been developed [77-80].
These nanosensors have been designed based on different kind of detection techniques encompassing plasmonic scattering, Raman scattering, colorimetric, luminescence, and electronic detections of nucleic acid [81].
In fact, the nanoparticles are used to act as a light source to modulate energy transfer to/from biomolecules closed the particle’s surface. Importantly, the plasmons of gold nanoparticles (AuNP) can behave as an energy sink to account for the hybridization of target DNA or RNA [82-85].
Three common sensing platforms using the LSPR of noble metal nanoparticlesthathave been developed consist of colloidal homogeneous sensing, surface-confined heterogeneous array sensing, and surface-confined heterogeneous single nanoparticle sensing. Each method has its own advantages over the others. For example, colloidal methods are fast and simple, while single plasmon biosensors increase the limit of detection (LOD) and make possible the study of biological process at the molecular level [40].
11
There are three main sensing categories based on the application of LSPR of metallic nanoparticles in nucleic acid detection, comprise detection by absorbance, scattering, and LSPR energy. In all of three categories, the main factors that greatly influence on the detection efficiency are types of plasmonic nanoparticles, the nucleic acids, the recognition length, as well as the buffers. The detection efficiency is described by the detection time, lowest sensing concentration (LOD), to assess thesensitivity, and single-base mismatch (SBM), to assessselectivity [86].
1.9 Porphyrins
Porphyrins and related families are unique and stable organic modules containing macrocyclic tetra-pyrrole connected by the methine bridges. Porphyrins show rapid tautomerism due to the two inner pyrrolic protons delocalizing in four pyrole rings (Figure1.6 (a)). Most of these aromatic macrocycles are purple powders and have visible colour in solutions (Figure1.6 (b)). They are usually synthesized by acid-catalyzed condensation of pyrrole and aldehyde building blocks followed by oxidative treatment [87].
Figure 1.6 (a) Structure of porphyrin and tautomerism;(b) Porphyrin’s powder and solution.
Modification of the porphyrin core with various functional groups and other elements provide them unique optical, electronic and magnetic properties making them interesting moleculesto focus on their interactions with other molecules and external stimuli, especially for the sensing applications [88]. Among several porphyrin families, the water-soluble cationic porphyrin, 5,10,15,20-tetrakis(N-methylpyridinium-4-yl)-21H,23H-porphyrin (TMPyP4+)
(Figure 1.7) has been used in diverse fields because of its physicochemical properties 91].
Figure 1.7 Chemical structure
The optical spectrum of porphyrins 500 nm corresponding to a π–
This absorption band is named Soret or B set ofother electronic absorption
known as Q-bands. For free-base porphyrin
because of D2hsymmetry ofits macrocyclic structure, but in
usually there are only
twoQ-bands both arise from π–π* transitions based on the four molecular orbitals (HOMO and LUMO orbitals). These absorption bonds can
with many parameters such as kind of interactions with
hydrogen bonding, donor–acceptor, coordination bonds and interactions at the macrocyclic core and periphery.Some examples of these interactions are
porphyrins, tautomerization, and/or physical properties comprising temperature, pH
porphyrins structure can be can be assayed by the UV sensing applications [92].
has been used in diverse fields because of its physicochemical properties
structure of 5,10,15,20-tetrakis(N-methylpyridinium porphyrin (TMPyP4+)
porphyrins showa sharp and intensive absorption band –π* transitions with molar extinction coefficients 4
This absorption band is named Soret or B-band, as shown in Figure 1.8. Moreover, there is lectronic absorption bands with weak intensity in the range of 500
base porphyrins,four Q-bands are found in absorption
its macrocyclic structure, but in the case of metalloporphyrins, -bands, due to an increase to D4hsymmetry. The Soret and Q
π* transitions based on the four molecular orbitals (HOMO and LUMO orbitals). These absorption bonds can change in terms of both location and intensity with many parameters such as kind of interactions with other molecules
acceptor, coordination bonds and interactions at the macrocyclic .Some examples of these interactions are assembly/disassembly of porphyrins, tautomerization, and/or physical properties of surrounding environment pH and solvent polarity. The influence of these parameters on structure can be can be assayed by the UV-Vis spectroscopy that is
12
has been used in diverse fields because of its physicochemical properties
[89-
methylpyridinium-4-yl)-21H,23H-absorption band around 400– π* transitions with molar extinction coefficients 4× 10⁵M-1cm-1.
8. Moreover, there is a with weak intensity in the range of 500–700 nm bands are found in absorption spectrum case of metalloporphyrins, symmetry. The Soret and Q-π* transitions based on the four molecular orbitals (HOMO and
in terms of both location and intensity other moleculeswhich can be acceptor, coordination bonds and interactions at the macrocyclic assembly/disassembly of of surrounding environment and solvent polarity. The influence of these parameters on spectroscopy that is very useful for
13
Figure 1.8 Soret bond and Q-bonds of Porphyrinchange to free base example in absorption spectra
1.9.1 Porphyrin-DNA Interactions
The DNA hybridization technique is widely used in diagnostic laboratories for biosensing of infectious disease pathogens and genetic variations.The use of DNA technologies for sensing applications provides sensitive, easy-to-use, fast, inexpensive, and miniaturized analytical devices. Moreover, the characterization of organic moleculesthat specifically interact with DNA and their molecular mechanisms underlying the machinery of living cells could be highly relevant fordrug design [93-94]. Porphyrin have been increasingly used as water soluble cationic porphyrin studied for optical DNA diagnostics and many research workhas been focused on Porphyrin-DNA interactions. In this regard,cationic porphyrin, 5,10,15,20-tetrakis(N-methylpyridinium-4-yl)-21H,23H-porphyrin (TMPyP4+) (Figure 1.7) has received substantial interest, because of its specificity in DNA binding, as well as its potential applicability in photodynamic therapy [95-99]. For example, many reports in the literature strongly support the specific intercalation of TMPyP4+which binds to the major groove of Adenosine (A)-Thymine (T)-rich DNA through electrostatic interaction between positively charged N-methyl pyridinium moieties of TMPyP4+ and negatively charged phosphodiester backbone of AT pairs of DNA [100-105].
A simple binding strategy to DNA through electrostatic interactions between the ionic side groups of DNA and water soluble cationic conjugated polymers is of considerable importance to gain an insight for drug design as well as the biosensor systems that benefit from the light harvesting properties along the conjugatedpolymer backbone.
14
The porphyrin is a multifunctional anchor that can act as an electron and/or energy transfer component and as a ligand docking site for potential coordination interactions. Furthermore, the size, shape, and hydrophobicity of porphyrins are quite similar to cholesterol, suggesting similar physical interaction for these two molecules in the lipid membrane [106-107]. Porphyrins have been covalently attached to DNA: at the 3' or 5' group of the sugar; on the phosphate backbone; on an adenine base; and as a base replacement. Circular dichroism (CD) has been the method of choice to study these chiral porphyrin systems [108-110].
1.9.2 Porphyrin-metal nanoparticles Interactions
Metal nanoparticles and chromophores have been widely studied as components of thin film hybrid materials for photovoltaic, optoelectronic, and bioanalytical applications. Different chromophores, for example, pyrenes and porphyrins, have been assembled on the surfaces of gold nanoparticles [111-115]. The process following the excitation of the chromophore can be energy or charge transfer to the gold nanoparticles [116-118]. Besides changing the nonradiative decay rate, the proximity of nanoparticles can also change the radiative decay rate of the chromophore [119]. The relaxation path of the excited chromophore depends: on the distance between the chromophore and the gold nanoparticle; on the orientation of the molecular transition dipole moment of the chromophore relative to the gold nanoparticle surface; and on the gold nanoparticle size [120-123]. The excited gold nanoparticles can also act as energy donors to chromophores. The preparation of chromophore-functionalized gold nanoparticles requires modification of the chromophore with a linker for covalent attachment to the gold nanoparticle surface [124-126]. Alternative ways to assemble chromophores in close contact with gold nanoparticle surfaces are, for example, spin coating and Langmuir-Blodgett methods [127]. Langmuir films of gold nanoparticles have been transferred to solid substrates, and they form ordered structures. Solid devices combining gold nanoparticles and chromophores have been already built, for example, for photovoltaic devices and light-emitting diodes (LEDs) [128-131]. The optimization of these solid devices requiresunderstanding the interaction mechanism between chromophores and gold nanoparticles in solid assemblies and, thus, is an important issue to investigate [132-133]. Many optical instruments and techniques, such as steady-state fluorescence, time-resolved fluorescence (nanosecond time scale), and transient absorption (picoseconds and microsecond time scales) provide beneficial details about the charge and energy transfer processes between
15
porphyrin and gold nanoparticle films. Two important points for this approachthat should be taken into account are, firstly, the film composition of porphyrins and gold nanoparticles, for the successful film deposition and, secondly, the molecular density to obtain a strong interaction. The usual mechanism of fluorescence quenching of chromophores by gold nanoparticles is energy transfer, and thus, it can be expected that energy transfer plays also a role in films of porphyrins and gold nanoparticles [134-139].
In addition to solid films, many research works about chromophore-functionalized gold nanoparticles have been performedin solution, in which the fluorescence of the chromophore can be quenched by either energy or electron transfer. The life time enhancement of fluorescence in chromophore is induced by changes both in the radiative and non-radiative decay rates [92].
1.10 Single Molecule Spectroscopy (SMS)
In recent years, advances in ultrasensitive optical instrumentation have opened a new experimental window for single-molecule detection [140-153]. The first single molecules were studied by absorption [154] and fluorescence excitation [155] made high photostability as well as the absorption cross-section provided the recording of both excitation and emission spectra of individual molecules [156-158].
Optical detection of single molecules comprises both frequency-modulated absorption and laser-induced fluorescence.
A single molecule emits the fluorescence in four-step cycle including [159]:
1. Transition of electron from the ground state to an excited state;
2. Internal relaxation within the vibration states in the excited state;
3. Relaxation from the excited state to the ground state through radiative or nonradiative decay that is measured as the excited-state lifetime. The excited-state lifetime and the absorption time been determined in the short range of sub-nano to nanosecond.
4. Internal relaxation in the ground state through the both vibrational and rotational relaxations which for small molecules in the condensed phase usually are in the range of picosecond nanosecond range.
The Jablonski diagram (Figure relaxation of a molecule’s excited
Figure 1.9 Jablonski diagram, when an electron absorbs a high energy relaxes fluoresces with a longer wavelength.
For weak excitation powers, fluorescence will depend linearly powers, thefrequency of absorption lifetime, thus leading to the onset
becomes weakly dependent on laser power. Finally, when the excitation of power is high, the absorption time is shorter than the excited
fluorescence is determined by the excited power. For example, the optical excitation
about 107–108 per second with 1.0 mW laser beam focused to the
1.11 Confocal Microscopy
Among the various single-molecule technologies, the detection with optical methods standsout because of its advantages, such as greater sensitivity, electrical passiveness, and robustness. Moreover, the optical detection of single molecules can also be use
range of concentrations. There are several optical methods have been developed to study single molecules [163].Confocal microscopy have employed for imaging and time
microscopy of single molecules at a polymer
extended to study single-molecule dynamics at room temperature especially for analysis of The Jablonski diagram (Figure 1.9) shows the mechanism of fluorescence based on the
excited-state [160].
Jablonski diagram, when an electron absorbs a high energy, t relaxes fluoresces with a longer wavelength.
For weak excitation powers, the frequency of absorption events and the intensity of depend linearly on thelaser excitation power. For intermediate excitation
absorption events begins to become limited by the
thus leading to the onset of optical saturation, and the intensity of fluorescence weakly dependent on laser power. Finally, when the excitation of power is high, the tion time is shorter than the excited-state lifetime, consequently, the signal of is determined by the excited-state lifetime, and so it will not depend on the laser For example, the optical excitation-emission cycle rates for many flu
per second with 1.0 mW laser beam focused to the diffraction limit
molecule technologies, the detection with optical methods standsout because of its advantages, such as greater sensitivity, electrical passiveness, and robustness. Moreover, the optical detection of single molecules can also be use
range of concentrations. There are several optical methods have been developed to study single molecules [163].Confocal microscopy have employed for imaging and time
microscopy of single molecules at a polymer-air/liquid interface, this technique have been molecule dynamics at room temperature especially for analysis of
16
) shows the mechanism of fluorescence based on the
then the electron
and the intensity of intermediate excitation begins to become limited by the excited-state the intensity of fluorescence weakly dependent on laser power. Finally, when the excitation of power is high, the state lifetime, consequently, the signal of depend on the laser emission cycle rates for many fluorescent dyes are diffraction limit [161-162].
molecule technologies, the detection with optical methods standsout because of its advantages, such as greater sensitivity, electrical passiveness, and robustness. Moreover, the optical detection of single molecules can also be used over a wide range of concentrations. There are several optical methods have been developed to study single molecules [163].Confocal microscopy have employed for imaging and time-resolved his technique have been molecule dynamics at room temperature especially for analysis of