How much is worth a non-listed company?
SATA Group Valuation
Maria Rouxinol Furtado de Medeiros Borges
Project submitted as a partial requirement for the conferral of
Master in Finance
Supervisor
Prof. João Francisco Baptista Colaço Sobral do Rosário, Prof. Auxiliar
convidado, ISCTE Business School, Departamento de Finanças
- Spine -
H
ow
to val
ue a
no
n-liste
d
com
pan
y? SA
T
A
G
roup
V
alu
at
ion
Ma
ri
a R
ou
xin
ol
Fu
rt
ad
o
Medei
ro
s
Bo
rges
Resumo
A SATA (Sociedade Açoriana de Transportes Aéreos) é uma companhia aérea açoriana fundada em 1941 por cinco açorianos que ambicionavam tornar os Açores independentes e, ao mesmo tempo, ligar o arquipélago ao resto do Mundo. A verdade é que hoje em dia é uma companhia que cumpriu os seus objetivos de longevidade. A SATA é atualmente constituída por 6 empresas e detém 12 aeronaves, sendo que a sua principal atividade é o transporte aéreo de passageiros.
A companhia aérea açoriana tem sofrido algumas alterações nos seus resultados principalmente entre os exercícios de 2013 a 2015. Estas alterações advêm de fatores externos como a crise e sazonalidade da indústria embora estas não sejam as principais causas. Para analisar o agravamento dos resultados da SATA é necessário ter em conta fatores internos (gestão interna), bem como gestão de rotas, de funcionários, de frota e, principalmente, de passageiros.
Com intuito de avaliar esta empresa e perceber as causas e consequências dos últimos resultados da empresa, foi decidido elaborar uma análise a partir de dois métodos distintos: Discounted Cash Flows (Free Cash Flows to the Firm e Free Cash Flows to the Equity) e Múltiplos.
É expectável que o Grupo SATA melhore os seus resultados a partir de 2015 e por aí em diante, embora seja necessário perceber o que levou a empresa à crise e que objetivos necessitam atingir para conseguirem obter os melhores resultados possíveis.
JEL Classifications: G32, L93
Abstract
SATA is an airline company founded in 1941 by five Azorean friends who desired to transform the Azores in an independent archipelago and, at the same time they want to expand the Azores and the Azoreans to the World. The fact is that nowadays SATA is a group of 6 companies owning 12 aircrafts and its main business is the transportation of passengers from and to the middle of the Atlantic (Azores archipelago).
Between 2013 and 2015 this company suffered some changes in their financial results, which, probably, some of the causes were due to external factors as the crises and the seasonality. However, the true/main factors that led SATA to a distress situation are related with internal management: routes, employees, fleet management and, as well, and mainly, the passengers.
Aiming to understand the causes and consequences of those results, we decided to evaluate this Azorean airline through two different methods: Discounted Cash Flows (Free Cash Flows to the Firm and Free Cash Flows to the Equity) and Multiples.
It is expectable that the SATA’s results will get better, however it is necessary and urgent to understand what was wrong and how the company would do to get the best possible earnings.
Classificações JEL: G32, L93
Table of Contents
RESUMO ... I ABSTRACT ... II TABLE OF CONTENTS ... III INDEX OF TABLES AND FIGURES ... IV EXECUTIVE SUMMARY ... VI
1. INTRODUCTION ... 1
2. REVIEW OF LITERATURE ... 4
2.1. CORPORATE FINANCE AND VALUATION ... 4
2.2. PRIVATE FIRMS ... 5
2.3. DISCOUNTED CASH FLOWS (DCF) ... 6
2.4. CAPM(CAPITAL ASSET PRICING MODEL) ... 7
2.5. WACC ... 8
2.6. RELATIVE VALUATION OR MULTIPLES ... 9
3. INDUSTRY OVERVIEW ... 10
3.1. AIRLINE BUSINESS MODELS ... 10
3.2. MARKET SUPPLY IN SEATS OFFERED ... 11
4. SATA – SOCIEDADE AÉREA DE TRANSPORTES AÇORIANOS ... 16
4.1. EXTERNAL ENVIRONMENT ... 16
4.1.1. International environment ... 16
4.1.2. National and Regional Environment ... 17
4.2. SATAGROUP (AZORES AIRLINES)–INTERNAL ANALYSIS ... 17
4.2.1. Business Model ... 18
4.2.2. Fleet ... 19
4.2.3. Routes, Destination and Human Resources... 20
4.2.4. Competitors ... 20
4.2.5. Financial Analysis ... 21
4.2.6. SATA’s News ... 22
5. SATA GROUP (AZORES AIRLINES) VALUATION ... 24
5.1. DISCOUNTED CASH FLOWS MODEL (DCFMODEL) ... 24
5.1.1. Free Cash Flow to the Firm (FCFF) ... 25
5.1.2. Free Cash Flow to the Equity (FCFE) ... 35
5.2. MULTIPLES VALUATION METHOD ... 39
5.3. DECLINING AND DISTRESSED COMPANIES ... 42
6. CONCLUSION ... 46 7. BIBLIOGRAPHY ... 48 7.1 BOOKS ... 48 7.2 ARTICLES ... 48 7.3 REPORTS ... 49 8. ANNEXES ... 50
8.1. SATAGROUP BALANCE SHEET ... 50
8.2. SATAGROUP PROFIT AND LOSS STATEMENT ... 51
8.3. COST OF CAPITAL COMPUTATION... 52
Index of Tables and Figures
Table 1 - GDP’s annual change rate (%) (Source: SATA Group annual report 2014) ... 16
Table 2 - SATA's Operational Data (Source: SATA Group annual report 2014) ... 20
Table 3 - SATA's Financial Performance (Source: SATA Group annual report 2014) ... 21
Table 4 - Revenues growth between 2010 and 2014 ... 26
Table 5 - Revenues growth between 2015 and 2019 ... 26
Table 6 - Return on Sales ... 27
Table 7 - Revenues, ROS and EBIT(1-t) forecast ... 27
Table 8 - Net Capex forecast ... 28
Table 9 - NWCN forecast ... 29
Table 10 - FCFF (Free Cash Flow to the Firm) ... 29
Table 11 - Inflation rates (Source: Pordata) ... 31
Table 12 - CAPM items ... 32
Table 13 - WACC calculation ... 34
Table 14 - Free Cash Flow to the Firm and Discounted FCFF ... 34
Table 15 - Termina Value, Enterprise Value and Equity Value (FCFF) ... 35
Table 16 - Debt Variation ... 36
Table 17 - Interest Expense after taxes ... 36
Table 18 - Free Cash Flow to the Equity calculation ... 37
Table 19 - Terminal Value, Enterprise Value and Equity Value (FCFE) ... 38
Table 20 - EV/EBITDA comparables ... 40
Table 21 - EV/EBITDA (SATA's Equity value) ... 41
Table 22 - EV/EBIT comparables ... 41
Table 23 - EV/EBIT (SATA's Equity value) ... 42
Table 24 - Equity value by each different analysis ... 44
Table 25 - SATA Group Balance sheet ... 51
Table 26 - SATA Group Profit and Loss statement ... 52
Table 27 - Cost of capital computation ... 52
Table 28 - Beta unlevered computation ... 52
Figure 1 - Number of available seats per week within geographical Europe ... 11
Figure 3 - Travel market at different stages of development ... 13 Figure 4 - Network development (city-pairs and frequencies) ... 14 Figure 5 - The real cost's fall of air transport ... 15
Executive summary
The airline industry is one of the industries with the biggest evolution through the years since its existence. While some decades ago only a limited niche of people could travel (it was very expensive, a luxury, and only people classified as the high society would be willing to pay that money), today everybody could go everywhere and for too many reasons: from a business trip or even to a weekend trip bought in one of the low cost companies. However, air transportation is one of the industries more affected by the seasonality’s consequences. It is quite obvious that the majority of the travellers would more probably prefer and choose to travel at summer holidays, at Easter breaks, or even in Christmas and New Year’s Eve than to travel in January, for example. This is one of the reasons pushing down some airline’s results all over the world, even in the Azores.
SATA Group is an Azorean airline founded in 1941 and it was named as “Sociedade
Açoriana de Transportes Aéreos” (“Azorean Society of Air Transports”), which means SATA.
The Azorean company increased and nowadays owns 6 companies (SATA Air Açores, SATA
Internacional, SATA Express, Azores Express, SATA SGPS and SATA Gestão de Aérodromos) and also 12 aircrafts flying around the Azores (SATA Air Açores), Lisbon,
Oporto, North America and some European cities, mainly. This company is extremely important for the Azorean people since it was created by five Azorean friends and during all the firm’s lifetime (at least until 2015) the company was the only linking the Azores and their people to the World.
Unfortunately, in the last years SATA has been decreasing its results: its revenues have been continuously decreasing and since 2013 its operating expenses have been significantly increasing. Due to these facts, SATA’s airlines earnings are negative from 2013 on. The true is that there are some influent factors for what happened to SATA. At least during 5 years (2010-2015) SATA made some unfortunate management decisions: while the number of passengers was decreasing they were increasing the number of destinations/flights per years and also the number of employees, causing some instability for the firm.
All the facts above briefly describe our big motivation in developing this work, strengthening the fact of the huge concerning that the Azorean people have with SATA’s results, since their freedom and link to the World depends on this company.
1. Introduction
In 1899 Wilbur Wright wrote a letter affirming that the human flight was possible. From that moment on, he and his brother (Orville Wright), who developed very early their interest on aviation and possessed a great technical ability and, as well, solving problems in mechanical design, started working on this industry. They opened a bicycle store and built their own bicycles too, but the biggest brother’s dream was to build their own airplane, which was accomplished. In 1900 they looked for a place to test their first glider, however it was not successful as they thought, furthermore in 1901 and 1902 Wilbur and Orville Wright tried over and over again and it was finally getting better. Lastly, in 1903 they designed a new aircraft, which was successfully tested in December of that year. In 1908 there was a public trip to France for the first time and by the following year Wilbur and Orville funded the Wright Company to build and sell their fleet.
The 20th century was a revolutionary year for the aviation market, because the most important events since they born happened in that millennium. After the first flight conducted by Wright brother, in 1920 the first transcontinental mail came from San Francisco, arriving in New York City 33 hours later. Since then on, even in the World War II period (between 1939 and 1945) the aviation development led to the creation of different types of aircrafts being designed and built, getting better, faster and flying all over the World. (http://www.history.com/this-day-in-history/first-airplane-flies)
We can affirm that the air transport is one of the industries that has been transforming the World by enabling the globalization that shapes the business world and the individual’s experiences. Conversely, the majority of the airline companies, nowadays, are only able to pay their suppliers and service their debt, having nothing left to pay investors, who are a very important element nowadays in this industry since they link the implementation of new technologies and the customer’s new experiences. However, there is a big issue around it, the high taxation and all the costs involved in the business, so a partnership between airlines and the government would be crucial to maximize their profit.
During all these years the demand for air transport services has been increasing much faster than the others services in the whole World, since this industry is the one responsible for increasingly linking more and more cities and creating value for all the customers, who usually
travel for their own experience or even for work, and, in order to make the airline a more competitive industry their prices have been declining a lot.
It was supposed that the investor’s return in this type of companies rose (in consequence of their fast development and growing demand), however it has been difficult to make an adequate level of profit. What they really expect to earn and be paid for is the difference between the Return on Invested Capital (ROIC) and the Weighted of Average Cost of Capital (WACC), nonetheless at least in the last 20 years of this industry’s life the WACC has been much higher than ROIC meaning that the investors, instead of gaining, are losing value. Conversely to this conclusion, it is expected that in the following years, in order to support the development of emerging economies, this business area triple or quadruple its services, consequently more aircrafts will be imperative that the capital increase in $4-5 trillion to improve the required ROIC. Since this represents what an investor gains for providing capital, to make a good investment, he ought to compare this value to what will he gain if he was investing in another asset with a similar risk, with the WACC. It is quite obvious that the higher the return, the higher will be the investor’s capital injection, and vice-versa.
Nonetheless, there are some important factors that may be taken into account when analyzing the power of this kind of industry, and, in this case, there are two very important issues: fuel and labor. In one hand, even with better resources and technologic advances to reduce the quantity of fuel consumption, airlines generate a significant part of the profit of the fuel’s companies as their prices are really high and they have a very high bargaining power relatively to the airlines and, on the other hand, the flight and cabin crew are another two major costs supported by this industry, since are the ones creating more value for each company. The 2008 global recession was devastating for the airline industry, since it affected negatively the air travel demand and, as well, pushes down the fuel prices (what is not necessarily adverse for the industry). Due to this crisis, new business models, in this area starts appearing, just like the low-costs, for example.
As far as passengers are concerned, some of them already prefer the low-cost companies and others are still loyal to the traditional ones. The loyalty is the highest level of commitment and it is based on some elements. To build a solid loyal affection between these two parties there are some qualifications to be worked on: satisfaction, trust and perceived level.
SATA is a non-listed Azorean airline that was created sixty years ago and nowadays is composed by six companies: SATA SGPS (integrated management), SATA Air Azores (flights between the nine Azorean Islands), SATA International (routes from Azores to Europe and North America), SATA Airfield (management of aircraft infrastructure in Graciosa, S.Jorge,
Pico and Corvo) SATA Express (tour operator in Canada) and SATA Azores Express (tour operator in USA). During the last years this group has been facing some difficulties, since their revenues have been continuously decreasing from 2010 until now. Despite this, the entrance of new (low-cost) companies in Azorean routes (more specifically in S. Miguel island) caused some impact in their results, since they were the only airline able to fly to the archipelago. Thus, in 2015 the monopoly finished.
Because of the facts described above, we think that it is important to study and analyze how much is worth this company, as well as the ways to realize it, by answering to some questions about this project, like “Is SATA so unqualified as people think?” or “Did the
low-cost competitors affect the company in some way?” or even if “Is SATA capable to handle the price competition?”. SATA Group has been appearing in several newspapers due to its bad
results, because they are reducing their fleet, also because their employees are unsatisfied with its policies and, nonetheless, there are a lot of complaints from their customers. Thus, it is necessary to study and show the real value of SATA Group in order to get some conclusions.
Furthermore, all those issues described above - all of those company’s problems - had also a big importance in my decision, since this evaluation can really answer to a lot of questions from all the community in touch with SATA and that are unhappy with its services, policies and, consequently, its results. On the other hand, my interest for Corporate Valuation and, as well, for Corporate Finance was another motivation to go ahead with this thesis, since the methods used to estimate company’s values are essential issues in this subject and its first principle is to maximize the value of the business by investing in the right assets, investing in the right kind of debt or by returning the cash to owners if there is no great investments.
So, to tackle this Project it is extremely important to keep up with the company’s history, website information, newspaper/magazine news, and, since it is a financial analysis, SATA’s reports and accounts couldn’t be out of margin. As it was mentioned before, the results, the policies and the strategy of the company during all these years are also very important for this work, as it provides us with an idea of business’s development or decline, comparing with their competitors. Notwithstanding, the Corporate Finance methods and theories have to be applied - taking into account that SATA is a private company - to get the company’s value and make our conclusions about this evaluation.
2. Review of Literature
2.1. Corporate Finance and Valuation
As we have already mentioned in this document, the first principle of corporate finance is to maximize the value of a business. Thus, at the same time that the firm value is maximized, it is necessary also to maximize the equity value, the stock price. In order to make it work, the managers have to be connected with stockholders, bondholders, financial markets and society, but it is not always easy to concretize, since, for example, manager’s interests are above of stockholder’s or even manager delay bad news to financial markets. Basically, corporate finance theory will not work as it was supposed if there’s some kind of conflict between manager and stockholder’s interests, if the markets are inefficient or even if there are significant social costs. Choosing a different mechanism for corporate governance or, as well, a different objective to the firm could really result in great recovery strategies.
According to Mota and Custódio (2008) the value creation has been declared as the greater financial management dimension, since it evaluates how the companies manage their resources in order to avoid the firm’s damage, protecting its profitability or its survival. Thus, nowadays, what really makes the difference between a good company’s financial decision from their competitor’s is how they characterize and treat its problems, identifying suitable solutions and analyzing its impact. A big company must find more alternatives in an easily way than the little and medium ones but, anyway, their methodologies and the way that they get results should be the same to all companies. Finally, it is suitable to reach a conclusion: in corporate finance decisions, the manager is not the only responsible anymore. All those important deliberations have to include the stockholders and the other ones with interests in the company.
“There is nothing as dangerous as the pursuit of a rational investment policy in an irrational world”
John Maynard Keynes
Some investors have been arguing that their perceptions, instead of cash flows or earnings, are the main determinants for the market prices. Damodaran (1994) affirms that investor’s perspective matters, however there are other necessary issues to take into account and also that knowing the value of an asset is imperative to make intelligent decisions.
It is obvious that different assets need different details of valuation, since the uncertainty associated with them varies, but the core procedures remain the same. However, some people keep arguing that the value depends on the investor’s insight and it can be justified if some others were willing to pay that price, which is absurd since “(…) the price paid for any asset
should reflect the cash flows that asset is expected to generate” (Damodaran, 2012: 8).
The maximization of firm value is the greatest motivation in corporate finance, thus the relation between decisions, strategy and firm value has to be studied, because, following Damodaran’s perception, “valuation is not an objective exercise, and any preconceptions and
biases that an analyst brings to the process will find its way into the value” (Damodaran, 2012:
9).
2.2. Private Firms
“The process of valuing private companies is not different from the process of valuing public companies”
Aswath Damodaran
Despite the fact that the principles of valuation remain the same, valuing a private firm could not always be as simple as valuing a public one, since its information available tends to be more limited. According Damodaran it is possible to “estimate cash flows, attach a discount
rate based upon the riskiness of the cash flows and compute a present value”. Nonetheless, just
like the public companies, it is possible to measure the entire firm value of a private one or even its equity value, by discovering the average cost of capital and the cost of equity, respectively.
However, there are some obstacles against the non-listed companies in order to value them. The first one is the fact that the majority of these types of companies (private ones) do not have accounting standards, so it can cause a big discrepancy between them. The second one is that, since those companies do not need to provide reports on revenues and earnings, there is less information available about them or, on contrary, if it exists it is likely not to be updated or detailed. Because of that, it is hard to find historical data and an updated price for equity, which is one of the biggest problems on valuing private firms.
Hence, Aswath Damodaran affirms that a good start for the process to value private firms is choosing the right model, then estimating the discount rates followed by the cash flows and, finally, complete the valuation (depending on the reason why the valuation is being done).
The owner of the firm does not usually hire managements to role the company; they are the ones who take care of this issue, investing their own wealth on it. All these issues lead to problems on estimating discount rates and cash flows.
Finally, we should find comparable firms – with similar structure and operations - to make this analysis. Sometimes it can cause different levels on business risk, on growth potential or even on margins, but it can be justified by the size or nature of these comparable firms.
2.3. Discounted Cash Flows (DCF)
According to Mota and Custódio (2008), in order to valuate a company, it should be considered, not only its internal business but, also the external environmental variables. Furthermore, a firm valuation needs to take into account its historical data and performance, since it is a fundamental item to any forecast.
DCF is an important model that estimates the value, or the potential value, of an investment, an asset or an enterprise by the present value of expected future cash flows. Its general approach is:
𝑃𝑟𝑒𝑠𝑒𝑛𝑡 𝑉𝑎𝑙𝑢𝑒 = 𝐶𝐹1 (1 + 𝑟)+ 𝐶𝐹2 (1 + 𝑟)2+ 𝐶𝐹3 (1 + 𝑟)3+ ⋯ + 𝐶𝐹𝑛 (1 + 𝑟)𝑛 Where,
n = Life of the asset
CF = Future cash flows in multiple periods r = Discount rate
According to Mota and Custódio (2008) the DCF model consists in valuate a company through its potential wealth generation, which only depends on its future potential cash flows.
Taking into account that this is just a general rule, it is important to consider the two ways of getting the present value, depending on what is more interesting for the investor. The first is to value just the equity stake, (FCFE – Free Cash Flow to Equity), which gives us the equity value directly and the second is to value the whole firm (FCFF – Free Cash Flow to Firm), which expresses the market value of operating capital.
The differences between these two approaches are essentially in the cash flows and in the discount rate. In the first one, FCFE, the expected cash flows are obtained after meeting all
expenses, tax obligations and principal payments, on the other hand, the appropriate discount rate is the cost of equity, as the next equation shows:
𝑃0 = 𝐶𝐹1 (1 + 𝑟𝑒) + 𝐶𝐹2 (1 + 𝑟𝑒)2 + 𝐶𝐹3 (1 + 𝑟𝑒)3 + ⋯ + 𝐶𝐹𝑛 (1 + 𝑟𝑒)𝑛
In the second one, FCFF, the expected cash flows of the business are independent of its financing and interests or dividends should not affect it. In this case, the appropriate discount rate is the Weighed Average Cost of Capital:
𝑃0 = 𝐶𝐹1 (1 + 𝑊𝐴𝐶𝐶)+ 𝐶𝐹2 (1 + 𝑊𝐴𝐶𝐶)2+ 𝐶𝐹3 (1 + 𝑊𝐴𝐶𝐶)3+ ⋯ + 𝐶𝐹𝑛 (1 + 𝑊𝐴𝐶𝐶)𝑛
Using this model to evaluate a private company could be a problem, since the measurement of risk usually requires historical prices information, which does not exist in this case. A solution for this could be to use comparable publicly traded companies to measure risks.
2.4. CAPM (Capital Asset Pricing Model)
This is an important model, since it works in order to price an individual security or portfolio and help investors calculate risk and what will be their expected return from the investment. Investors should be compensated in two different ways: by time value and by risk. In other words, to make an investment (with the same profit) without risk (“risk free”) is better than making one with a systematic risk. But, if the profit in this second investment increases, both will worth the same. What about an investment with an even bigger risk?
𝑟𝑒 = 𝑟𝑓+ 𝛽(𝑟𝑚− 𝑟𝑓), Where:
re = cost of equity
rf = risk free rate
= Beta, a risk measure rm – rf = risk premium
Basically, this expression is the most acceptable way to calculate the cost of equity and represents, if we assume an investor well diversified, the risk added to the market risk on an investment, represented by the risk premium multiplied by the Beta, this is, the additional expected return demanded by the investors if they are exposed to additional risk. Beta represents the volatility of the investment compared to the movement of the market. In this case, as SATA is a non-listed company, it is not possible to compute the Beta, however a solution for it could be making an average of Betas of comparable companies.
In conclusion, if the expected return does not make the risk worth it, the investment should not be executed.
2.5. WACC
Companies, generally, finance its assets through debt or equity and WACC (weighted average cost of capital) measures their financings. Furthermore, this measure is used by firms to evaluate the profitability to finance new projects, and also by investors to value company’s shares, but some of them prefer to appeal to other methods, since this is a complicated formula and requires a lot of company’s information:
𝑊𝐴𝐶𝐶 = 𝑅𝐸 × 𝐸 𝐸 + 𝐷+ 𝑅𝐷 × 𝐷 𝐸 + 𝐷 × (1 − 𝑡), Where: RE = cost of equity RD = cost of debt
E = Market value of the firm’s equity D = Market value of the firm’s debt t = corporate tax rate
The higher the WACC, the less likely it is that the company is creating value, because it is a signal that we face a risky company and indicates that they are spending a large amount of money with the borrowing costs.
2.6. Relative Valuation or Multiples
The value of multiples can be calculated by two ways: by Enterprise Value (EV) – the market value of operating/investing capital - or by Price (P) – market value of outstanding shares. For instance, according to Bernström (2014), equity could be calculated on a direct approach, by P multiples, or indirectly, by EV multiples, although one way or another must show the same result.
Some examples of the most frequently used EV multiples (firm approach) are: EV/Sales: relation between market value of invested capital and revenues EV/EBITDA: relation between market value of invested and earnings before
interest, taxes and amortization
EV/FCFF: relation between market value of invested and free cash flow to firm. Bernström (2014) also refers that the numerator (EV) represents the market value of the capital structure and the denominator (Sales, EBITA, FCFF) represents the return for the investors.
The equity approach (P) also has some most frequently used multiples:
P/EBT: relation between market value of equity and earnings before taxes P/FCFE: relation between market value of equity and free cash flow to equity. In this case, “as the numerator (i.e. P) represents the market value solely of the equity
capital, the denominator (i.e. the earnings or the cash flow measure) should therefor exclude income belonging to other types of investors or financers” (Bernström, 2014: 42).
3. Industry Overview
3.1. Airline Business Models
The airline industry is one of the whole industries that have been changing the most all over the years. From the 90’s until now new kinds of airlines have emerged, like the Low-Cost carriers (LCC), and the number of mergers and different types of alliances have been increasing too.
The most traditional type of airlines is the “legacy” or, in other words, “full service network” carrier. These companies regularly provide “a wide range of pre-flight an on-board” services and they often work as hub-and-spoke1 airlines Air France, Lufthansa, British Airways or others with domestic, European and worldwide routes (with a huge range of Origin and Destinations) are examples of this type of airline. Some characteristics points of the legacy carriers are:
The load factor2 of these companies often increase or decrease according to the number
of O&D’s (Origins and Destinations);
There are economies of scale – if the demand increase, consequently larger equipment is requires, however the unit costs per seat decline;
The higher the number of the incoming and outgoing passengers at the hub, the higher the possible O&D markets to serve;
The complexity of the connecting flights, the hub busy hours (peaks of arriving and departing) or even their consequent delays are some of the weaknesses of the full service network carriers.
Regarding the LCC’s, they are relatively new for the travellers, offering low fares to their clients and arranging strategic measures to reduce their unit costs. One of the most intriguing things for all travellers in general is when they think in what kind of measures the LCC’s adopt to reach extremely low fares, since they still are an airline, which involves a lot of fixed costs. The “Analysis of the European air transport market” report lists some of them.
1It is a distribution paradigm to airlines. It allows passengers of knowing what is the central airport and the strategic routes of some airline.
The use of young fleet of medium sized aircraft decreases the fuel, maintenance, staff and capital costs;
The high-density seating (the fact that the LCC’s do not provide the most commodious aircrafts) reduce the unit costs of all the referred categories;
Low-cost companies only fly to small and uncongested airports, thus the delays are reduced;
The smaller the airport, the smaller the fee; These types of companies only sell online tickets;
LCC’s earn extra revenues by selling other types of services and products on-board. The truth is that, due to all of the advantages these types of companies have been bringing for their customers their competition is increasing and, instead of focusing all their services only on short-haul3, they are extending it to medium-haul services also.
In addition, there are also other types of airlines comparable to the LCC’s, however they are even smaller and only represent a market niche. Holiday carriers and Regional carriers are two examples of them. The first one focuses their services on the transportation of tourists and it was called “charter airline” in the past. The latter, “uses smaller aircrafts and restrict their flight routes to a geographically limited area” according to “Analysis of the European air transport market” report.
3.2. Market Supply in Seats Offered
Figure 1 - Number of available seats per week within geographical Europe (Source: Analysis of the European air transport market)
The image presented above shows us how obvious the growth of this industry, in general, is. More specifically, during that decade (between 1998 and 2008), the airline industry’s growth was of 71%. This quick rise was mainly due to the second half of that decade or, in other words, between 2003 and 2005, since only during these years the airline sector rose 46%.
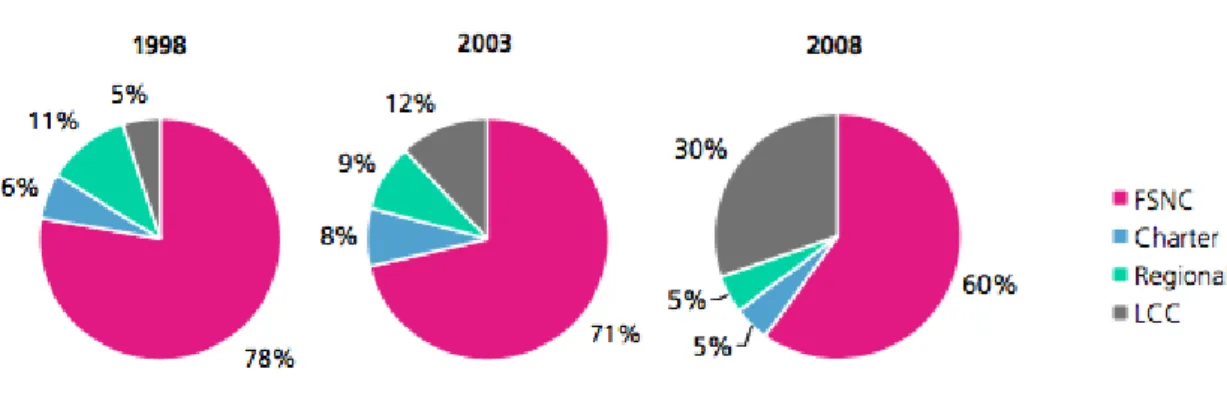
As far as the industry growth is concerned, the full service network carrier and the Low-cost carrier have been playing a good role in it, as it could be observed through the figure presented. Contrary, holiday and regional carriers show a decrease on their number of available seats per week, at lea least in the second half of that decade (-12% and -20%, respectively).
Regarding the LCC’s boom, it is quite obvious, essentially from 2003 on. Ironically in the very beginning (counting from 1998) these companies were significantly below the holiday and the regional carriers. However, suddenly after the first five years it occurs their big boom. While between 1998 and 2003 the Low-cost airlines only grew 15%, between 2003 and 2008 it just boomed to 272%. In one hand, this sharp growth in the low-cost market was the mainly factor influencing positively the entire industry, on the other hand their success is an approach of the regional airlines services replacement. As for holiday carriers, it would lead to their decline in the market and, finally, for FSNC, they maintain their positive growth due to their long-haul services.
Figure 2 - Market share development
(Source: Analysis of the European air transport market)
The presented image demonstrates exactly what was explained previously – the boom of the LCC’s, the maintenance of the FSNC and the decrease of holiday (charter) and regional carriers.
According to all the facts spoken until now, it is possible to affirm that this industry has been developing rapidly. Taking into account IATA Vision 2050, it is clear that, in the past 40 years, the revenue passenger kilometres (RPKs) expanded 10 times, which means an extension three times greater than the growth of the world’s economies. Air travel has been one of the fastest growing sectors from since ever.
In the very beginning of air travel boom, this sector grew faster than the world trade. However, between 1999 and 2000, travel markets matured and from that time on the industry starts growing slowly, comparing to the world trade.
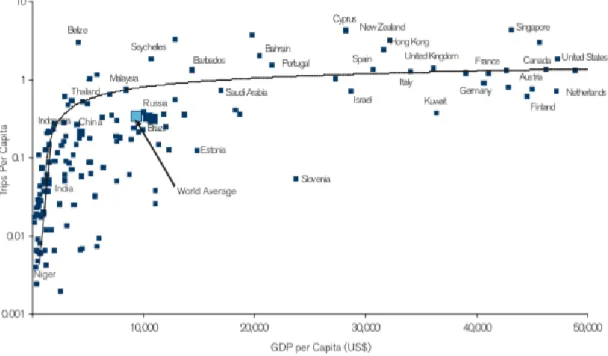
Figure 3 - Travel market at different stages of development (Source: IATA Vision 2050)
What’s more, through the figure 3 it is obvious to see that, initially, it happens the same as with the world trade - the air travel industry grew much faster than the GDP per capita. Though, while the GDP per capita achieved, approximately, between $10,000 and $15,000, the number of trips per capita, instead of growing faster than GDP, it simply levelled out. This stability was due to the air travel’s market maturity.
When it comes to the air freight, initially, this factor also grew faster than the world trade, which reflects the globalization of the business and increase international trade.
As far as the air transport network is concerned, it is all about “linking cities and urban agglomerates”, which, in consequence, contributes to the development of the industry.
Figure 4 - Network development (city-pairs and frequencies) (Source: IATA Vision 2050)
Regarding the consumers, they are the ones who have been benefiting from it, since over the past years the number of weekly frequencies increased more than twice, the service quality has improved and the “non-stop city-pair origin-destinations” doubled, as it is translated in the figure 4.
Moving on to the costs and flight prices, and succeeding the air travel development, since 1970 we have been assisting to an improvement of the new aircraft’s efficiency, to a greater utilization and a better performance of airlines. Thus, during the past 40 years, the cost of offered air travel services has fallen more than 60% and, due to the inflation effect in the prices for consumers, it has fallen by a similar percentage, where it is proven by figure 5.
Figure 5 - The real cost's fall of air transport (Source: IATA Vision 2050)
Next to an overview through the air travel industry, IATA Vision 2050 presents a forecast where it is predicted how the airline industry will be and who will be their customers in 2050. IATA (International Air Transport Association) expects that the air transportation sector grow twice the rate of GDP growth, which means that the number of passengers will be increasing too and yet, that the technological advances will transform the industry. In 2050 travelling in an airplane will be even faster and safer. Nonetheless, the mobile technology affects the consumer’s behaviour when they travel and also on-board entertainment is no longer available in the aircrafts, since all passengers have their own entertainment needs available to take on board.
Regarding the customers in 2050, in one hand they will be older than before and, in the other hand, younger travellers are, normally, frequent fliers since ever and since early they establish their preferences concerning airlines brand and loyalty.
4. SATA – Sociedade Aérea de Transportes Açorianos
4.1. External environment
4.1.1. International environment
Before start SATA’s Group descriptive analysis, it will be given a brief World’s economic overview. Once aware of the current economic situation, it becomes easier to understand the way that SATA operates, and, as well their results.
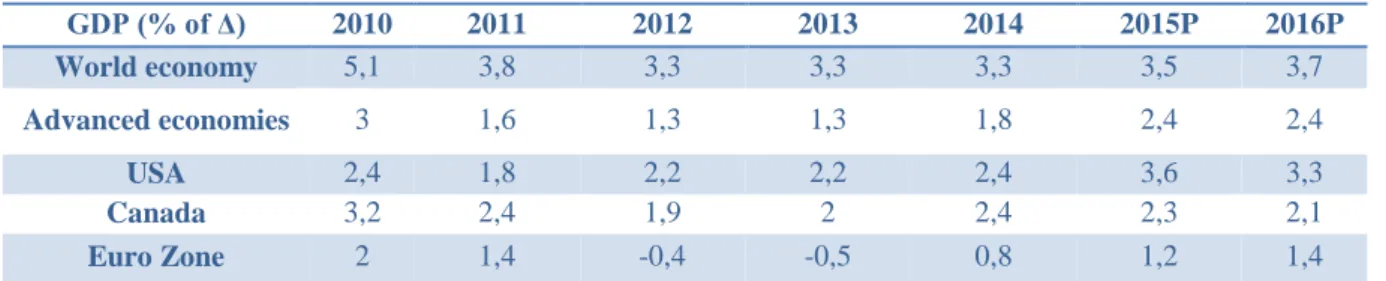
In the following table are presented the GDP from different countries and, as well, from the World’s economy in general. As it can be observed in the first item, the World economy, there was a moderate recovery of the GDP’s variation from 2011 until 2016, apparently. The economy mainly slowed down because of the high levels of uncertainty that leads to high volatility in the financial markets causing loss of trust in economic agents. However, the recovery since 2011 has been caused, mainly, for the drop in the fuel prices.
The USA, due to the property market stabilization, private credit expansion, low unemployment rate and smoother inflation, has been showing a growth tendency. In Canada, they are facing a strong recovery due to more favourable financing condition, less pressure from fiscal consolidation and commodity boom.
GDP (% of Δ) 2010 2011 2012 2013 2014 2015P 2016P World economy 5,1 3,8 3,3 3,3 3,3 3,5 3,7 Advanced economies 3 1,6 1,3 1,3 1,8 2,4 2,4 USA 2,4 1,8 2,2 2,2 2,4 3,6 3,3 Canada 3,2 2,4 1,9 2 2,4 2,3 2,1 Euro Zone 2 1,4 -0,4 -0,5 0,8 1,2 1,4
Table 1 - GDP’s annual change rate (%) (Source: SATA Group annual report 2014)
During 2012 the Euro Zone suffered a decline in the economic activity because of the uncertainty relatively to some countries regarding the suitable appliance of policies to fight against the crises. Fortunately, until 2014 there was a recovery, even not so good as it was supposed to be due to the low investments and the reduction of inflation expectations.
4.1.2. National and Regional Environment
Since 2008 Portugal has been facing an aggressive economic crisis. From that year until now, a lot of measures were implemented to mitigate the situation. In 2012 all the processes were ongoing to reach the evolution of the economic activity. However, due to that measures, Portuguese families had to carry some consequences – increase in the price of some services, credit access restrictions and deterioration of the labor situation.
In 2014, fortunately, the economic activity was stabilized, at least better than the previous years, despite the adjustment process of macroeconomic unbalances went on.
Comparing with 2010 and 2011, it was recorded in 2012, in Região Autónoma dos
Açores, that the Agriculture sector positively encouraged the economy. Nonetheless, the
secondary and tertiary sectors brought a negative impact (due to a decrease in the electric energy production), just as well the touristic activity (there was an increase in the number of available rooms in the hotels).
Two years later the scenario has been moderately recovered. The unemployment and inflation rate dropped and the employment rate raised in all the sectors, followed up with an increase in the tourist activity.
4.2. SATA Group (Azores Airlines) – Internal Analysis
“The Atlantic and You”
SATA Group Slogan
SATA is an Azorean airline founded in 1941, which five friends named “Sociedade
Açoriana de Estudos Aéreos, Lda” (“Azorean Society of Aerial Studies”). Six years later (1947)
this society realized the first flight in a plane with seven passengers and a crew composed by two people, so their name changed to “Sociedade Açoriana de Transportes Aéreos” (“Azorean
Society of Air Transports”) - SATA. After this, partners wanted to increase the number of the
aircrafts and in 1964 they already had a plane with a capacity for 26 passengers. As consequence of all the company’s improvements, in 1977 SATA Group had already transported 1 million passengers.
During all this years and until now this company was able to reach a lot of employees and by now is composed by 6 enterprises:
SATA International (it links the Azores with all the other destination abroad) SATA Express (flights between Canada and Azores)
Azores Express (flights between EUA and Azores)
SATA Gestão de Aeródromos (Airport infrastructures management in Pico, Graciosa, Corvo and S. Jorge islands)
SATA SGPS (Management of the Azorean’s air transport)
Despite all of the success, as all the others companies sometimes things do not always go as planned. Some of SATA’s aircrafts suffered some accidents, which caused some victims. The first one was in the beginning of SATA’s story in 1948, the second one in 1999 (the biggest accident, with more victims) and the last in 2009 (without victims).
4.2.1. Business Model
SATA operates in four business units – air transportation, airplane assistance, aerodrome management and touristic operation. In order to make it works, SATA evolve all the company in critic activities – revenues management, handling operations -, working with their partners and attending to all their customers’ needs through their sales channels.
SATA Group has the objective of bringing the World into Azores and taking the Azores to the World, aiming to be a referent company all over the international commercial aviation world. Reliability, sympathy and innovation are their values that SATA believes that will lead them to reach all their strategic objectives – cost reduction, SATA’s promotion in their activity markets, and operational innovation.
Since, at least, 2011 SATA have been working on their strategic objectives and, due to the financial liability tightening during these years, the first thing to carry on are the cost reduction. Some of the procedures in 2014 were contract renegotiation with Handling Agents, optimizing their consumption and fuel supply and flight plans, workshop areas development (instead of buying external services), improve sales through the SATA website and flight training carried by internal examiners. Another important issue to SATA Group is to improve and be aware of their operating market, since they work a lot on routes improvements. By now, SATA gives the Azoreans the opportunity to fly to over 30 destinations promoting the Azores around the World. Thus, the company should support the promotion by being present in several international travel events: SATA was present in 37 international fairs; realized the “Fly to
linkages in North of Europe via Munich and Frankfurt; focus on direct regular flight between Ponta Delgada and Madrid.
To make it all work and to emphasize SATA between all their competitors, they might be conscious about the importance of new technologies. Thus, 2012 and 2013 were two revolutionary years in terms of technology - SATA launched resident’s promotional tariff and SATA4Agents, the Online Insurances, a new Website, the resident’s Web Check-in and SATA Connect and “Passbook” apps. Aligned with all of these progresses, it is emerged a company with more corporate, personal and social development, higher quality services, more efficiency and with greater economic development and competitiveness. To concur with these developments, 2014 was characterized as a developer of the new products and website functionalities, as well of the client’s relation and information management and internal systems improvements, e.g. PayPal is a new way of online payment or SATA4Agents website’s optimization.
4.2.2. Fleet
2010 was a very tough year to the aviation sector, including for SATA due to 4 aspects: the European macroeconomic environment; the National economic situation; some atypical incidents that brought down the sector and the closure of the European air space (due to a volcanic crisis). Despite this, 2010 was the year when SATA concretized, in the right timing, with the expected budget and with safety, the fleet renewal project. The entrance of 4 Bombardier Q400NextGen, SATA Air Açores won vitality to the next decades and was considered the younger regional company in Europe, aligned with an improvement in operational reliability, safety and comfort. Moreover, these aircrafts guarantee bigger passengers transport’s capacity, reducing the environmental impact induced from this activity. Hence, nowadays, SATA Group owns a total of 12 aircrafts. SATA Air Açores (SAA) owns 2 Bombardier Q200 and 4 Bombardier Q400, while SATA International (SI) possesses 3 Airbus A310-300, 1 Airbus A310-325, 3 Airbus A320-200 and 1 Airbus A330-223 acquired in 2015.
4.2.3. Routes, Destination and Human Resources
As it had already been stated, SATA Group is divided into 6 companies, which 2 of them – SATA Air Açores and SATA Internacional - are responsible for the commercial flights with more than 20 cities and 50 routes. Since 2010 until 2014 there were some changes in terms of destinations (some were added and some were interrupted), as well in terms of routes. Some flights are operated by SATA Air Açores, and others operated by SATA Internacional (SATA
Air Açores subsidiary). Briefing the modifications mentioned in the table below, in 2010 and
2011 SATA Group flew to 31 regular destinations, in 2012 to 34, in 2013 to 38 and in 2014 reduced the quantity of regular destinations to 25.
2010 2011 2012 2013 2014
Regular Destinations 31 31 33 38 25
Flights 22 108 21 402 20 326 19 144 17 256
Passengers 1 848 890 1 352 341 1 236 119 1 195 251 1 180 146
Employees 1 258 1 222 1 241 1 288 1 330
Table 2 - SATA's Operational Data (Source: SATA Group annual report 2014)
To summarize all the information related with flights, destinations, passengers and employees, it was illustrated in the table above to be easier to understand. The mainly issues associated with the slight decline in all these subjects, through the years, are the entrance of the new 4 aircrafts to SATA Air Açores and also the International, National and Regional economic environment. Nonetheless, since the new fleet has a greater passenger’s capacity, the number of performed flights drops.
The decline in air passengers and employees are directly associated and aligned with the economic crisis. Nevertheless, the number of passengers and flights declines, but the number of employees rises due to the increase in the number of regular destinations.
4.2.4. Competitors
In 2014 it was announced that the TAP and SATA’s monopoly in the Azores was close to the end, due to the migration of the Low-cost companies to the Azores. Ryanair and EasyJet start their Azorean routes in the summer of 2015. This big change will increase the number of
flights to the islands (by now only to Ponta Delgada, with high probabilities, in the future, of flight to Terceira) in 40%, apart from the prices will represent only 10% of SATA’s prices.
A lot of articles support the hypothesis that the reason why SATA sets so high prices was due to lack of competition, thus that tariff reduction come in order to smooth it and pull SATA and TAP’s prices down.
The Azorean Government (SATA’s Group shareholder) is committed to help them win all the new challenges, facing the low-cost competitors. Regarding SATA, they might adapt themselves to the new work conditions taking into account all of their skilled staff with a lot of expertise and know-how.
The entrance of these new companies into the Azorean routes was one of the biggest achievements in the Azorean air transport history. By now, it is worth to observe and study the boom in the Azorean tourism due to the more suitable flight prices.
4.2.5. Financial Analysis
In the following table is illustrated SATA Group’s economic activity during 5 years (from 2010 until 2014). Now, it is important to understand where the values came from and how the differences do were originated.
2010 2011 2012 2013 2014
Operational Revenues 252 595,00 € 226 185,00 € 220 480,00 € 204 456,00 € 185 157,00 €
Operational Expenses 176 515,00 € 152 032,00 € 146 341,00 € 227 343,00 € 216 489,00 €
Net Income -3 531,00 € 527,00 € 73,00 € -30 361,00 € -34 784,00 €
Debt 91 679,00 € 88 160,00 € 107 896,00 € 124 471,00 € 152 660,00 €
Table 3 - SATA's Financial Performance (Source: SATA Group annual report 2014)
First of all it is important to explain the Operational Revenues and Expenses and the respective differences over the years. Looking at the table above, it is easy to see that both values dropped in 2011 (relatively to 2010). In one hand, the main reasons why for the revenue’s decay were the reduction in the volume of passengers and load carried. In the other, what were really related with Expense’s recession were the reduction in the staff costs (due to the remuneration’s reduction plan requested in the State Budget), and, as well the reduction in the External Services and Supplies (FSE) since SATA Group signed new contracts with their suppliers in order to reduce costs and rise the competitiveness.
Moving on to 2012, the reduction continues. In association with the revenue’s decrease are the provided services (11 million euros down) in contrast to other revenues that increased 5.5 million euros, mitigating the loss. The expense’s decrease is directly related mostly with the lack of the sector’s demand and with the recessive economic environment. The decline continues during 2013 and 2014.
In 2013, in general, the operational revenues went down, despite of having a slight increase SATA’s Air Açores revenues due to the rise in sales and services and other revenues. Conversely, in SATA International suffered with the pressure because of the tariff reduction. Regarding the expenses in that year, SATA Air Açores and SATA International raised their numbers, thus SATA has grown up 17 million euros since 2012 related with the salary’s cut replacement and, for the same reason allied with External Services and Supplies, it was added 10 million euros to their operational expenses.
Finally, the Revenue’s climb and expense’s decrease characterized 2014. The first one was due to the obtained income’s break related to the air transport activity, and the second one caused mainly due to the big values of staff and fuel expenses.
In general, the low and negative values associated with the operating income are related with SATA’s seasonality (in the summer there are a greater number of flights and carried passengers), combined with the expenses generated by the staff’s expenses and aircraft maintenance.
4.2.6. SATA’s News
The Randstad Company in association with the ICAM Group celebrated the Randstad
Awards 2016 taking into account more than 7200 surveys regarding employer branding around
the World. As a result of this study SATA International (Azores Airlines) was the winner (between other 20 random portuguese companies) taking the first place as the best company to work in Portugal.
Despite being the most attractive company to work in their own country, SATA has been facing negative results until 2014. However, the previous companies’ CEO, Paulo Menezes, aspires that in the end of 2015 the results will be significantly different. In order to obtain the desired results, SATA Group have a new business plan to accomplish until 2020, which their main goal is to reduce costs without firing any of their employees. Some of the strategies they found more suitable to reach their purpose were the following:
Debt Renegotiation – the airline wants to renegotiate the payment deadlines of the debt, transforming some part into short-term and in medium/long term, while they try to recover their receivables in order to pay it until 2020.
Replace Fleet – SATA tend to replace 4 of their airplanes by 2 with a higher capacity to reduce the labour (they will not renew the contracts or replace the future retired pilots) and maintenance costs.
Azores Airlines – The company that the previously was called SATA Internacional gains a new name.
Creation of “SATA Serviços Partilhados” – Aiming to take responsibility on accounting services, suppliers, human resources and information systems of all companies owned by SATA Group, a new department was born.
Creation of “SATA Serviços” – Provide the handling services in all the Azorean airports, even to the new competitors, as Ryanair or EasyJet (since 2015).
New Business Model – SATA SGPS will entirely own SATA Air Açores, SATA
Internacional (Azores Airlines), “SATA Serviços Partilhados” and “SATA Serviços”.
Since this company is exclusively owned by the Regional Government, during 5 years (2015 - 2020) SATA Group will be given around 135M€ by this entity in order to help them getting the desirable results. Besides SATA own all the Azorean aerodrome and provide all the handling services (contributing to the regional employment), the airlines’ income represents 5% of the regional GDP and the majority of their suppliers are Azoreans. So, at this time SATA need to focus on the markets that they are already in providing them with the service they expect and, at the same time, improve it instead of entering in new ones.
5. SATA Group (Azores Airlines) Valuation
5.1. Discounted Cash Flows Model (DCF Model)
One of the most popular methods to evaluate a company is the Discounted Cash Flows model, since it translates the present value of a firm through its future cash flows discounted by a certain discount rate. In this method there are two available ways to evaluate a company: Free Cash Flow to the Firm (FCFF) or Free Cash Flow to the Equity (FCFE). Basically, the biggest difference between those two theories is their discount rate, as one is discounted by the weighted average of capital (WACC) and the other with the cost of equity (RE), respectively.
The DCF method is the most correct way to valuate a company and it represented for the following formula:
𝑽𝒂𝒍𝒖𝒆 = 𝐶𝐹1 (1+𝑖)1+ 𝐶𝐹2 (1+𝑖)2+ ⋯ + 𝐶𝐹∞ (1+𝑖)∞ = ∑ 𝐶𝐹𝑛 (1+𝑖)𝑛 ∞ 𝑛=𝑖 (1) Where, CF = cash flow
i = discount rate (WACC or RE) n = time periods from to infinity
It is very hard to predict the future values of a company until infinity and, still, maintaining it credible. Although, when the DCF approach is used to value a company, this future value is often combined with a terminal value, which represents that value in a distant future. Consequently, instead of using the equation (1), which it is supposed to end at some period of time, we should use the following formula that project the value until infinity:
𝑬𝒏𝒕𝒆𝒓𝒑𝒓𝒊𝒔𝒆 𝑽𝒂𝒍𝒖𝒆 = ∑ 𝐶𝐹𝑛 (1+𝑖)𝑛 𝑡 𝑛=1 + 𝑇𝑉𝑡 (1+𝑖)𝑡 (2) Where, CF – cash flow
i – Discount rate (WACC or RE) n – Time periods
TV – terminal value (representing continuing value or the terminal value) The terminal value is represented by the following formula:
𝑻𝑽𝒏 = 𝐷𝐶𝐹𝑛+1
𝑖−𝑔 , (3)
Where,
DCFt – Discounted cash flow g - Perpetuity growth rate i - Discount rate (WACC or RE)
The SATA’s case is not an exception. We need to calculate their discounted future value through a certain discount rate or another so we can achieve the Terminal Value (TV), the Enterprise Value (EV) and the Equity Value and, through this process, reach the true value of this company. Well, to get these values it is needed to take into account some historical values of SATA and, as well, comparable firms’ information so we could compute the discount rates and, only after that, it is possible to calculate the value of the company.
5.1.1. Free Cash Flow to the Firm (FCFF)
As far as the Free Cash Flow to the Firm concerns, it comes that:
𝑭𝑪𝑭𝑭 = 𝑬𝑩𝑰𝑻(𝟏 − 𝒕) − ∆𝑵𝒆𝒕 𝑭𝒊𝒙𝒆𝒅 𝑨𝒔𝒔𝒆𝒕𝒔 (𝑪𝑨𝑷𝑬𝑿) − ∆𝑵𝑾𝑪𝑵 (4)
The equation above represents the one used to calculate the FCFF, where it is needed to calculate three main items:
Regarding the first item, EBIT (1-t), it is represented for the following formula:
𝑬𝑩𝑰𝑻(𝟏 − 𝒕𝒂𝒙 𝒓𝒂𝒕𝒆)= 𝑂𝑝𝑒𝑟𝑎𝑡𝑖𝑛𝑔 𝑅𝑒𝑣𝑒𝑛𝑢𝑒𝑠 × 𝑅𝑒𝑡𝑢𝑟𝑛 𝑜𝑛 𝑆𝑎𝑙𝑒𝑠 (𝑎𝑓𝑡𝑒𝑟 𝑡𝑎𝑥𝑒𝑠) (5)
As for the previous equation, there are two important parts that matter. The initial step to take into account while calculating the earnings before interests after taxes or net operating profit after taxes (EBIT AT or NOPAT) is that it is the forecast of the future SATA’s operating revenues.
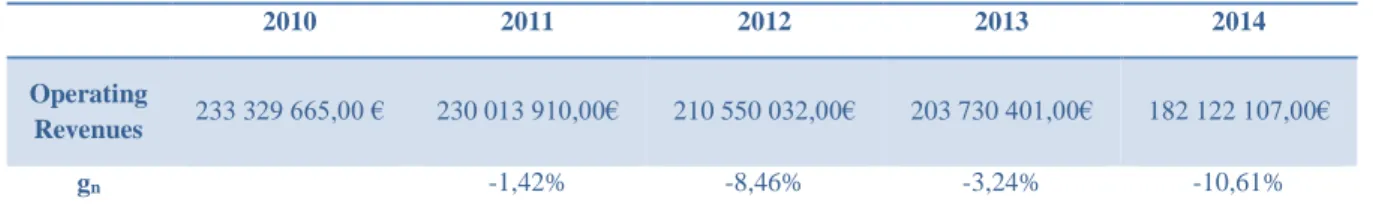
First of all, it is needed to compute SATA’s nominal yearly growth rate (gn) from 2011
until 2014 just to understand how was the company’s revenues before the valuation, since all we need is an estimation of that and know how they will grow between 2015 and 2019. As it is demonstrated in table 4, at least between 2011 and 2014 the operating revenues of SATA
tended to quickly decline more than 10% in 2014, which shows a huge decrease comparing with 2013.
Observing those growth rates and knowing all the SATA’s historical results, we could made an assumption of SATA’s growth rate to the next year (2015), which would be -5,93% since 2015 it is considered yet as a tough year for SATA due to the entrance of low cost companies into the Azores market and the branding modification (SATA Group has a new name/branding in the present – Azores Airlines). In 2016 it is expected that the airline starts to get their good results back as in 2012 and 2011, so this year on it is expected that the growth rate get near to the one they had in 2013. In 2017 the results follow the same rationality and it would be the same (or approximately) as in 2011. Finally in 2018 it would expect that the revenues growth rate would be the same as the inflation rate in 2015 (represented in table 11).
Table 5 - Revenues growth between 2015 and 2019
In 2019, we assume that SATA will be stable and will be able to get positive growth rates (perpetuity growth rate), hence, increase their Operating Revenues.
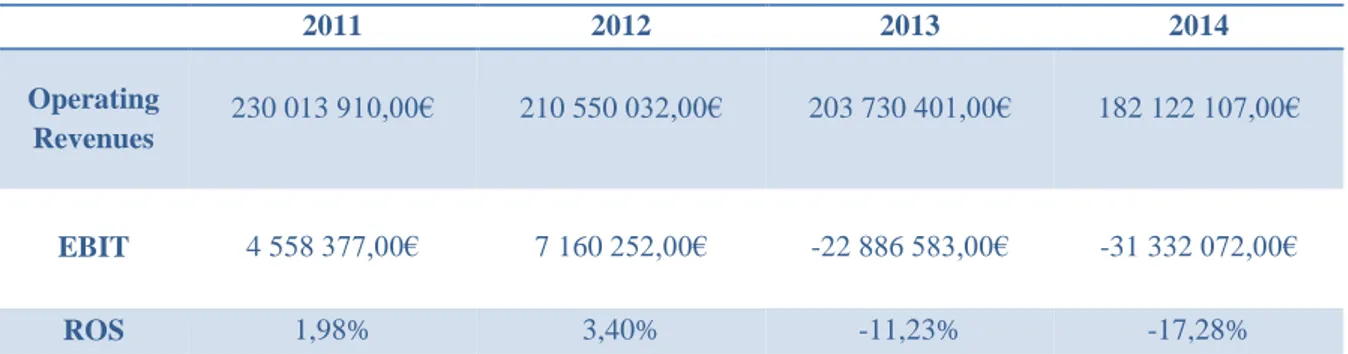
Secondly, it is required to pay attention to the Return on Sales (ROS) after taxes that is computed by: 𝑹𝒆𝒕𝒖𝒓𝒏 𝒐𝒏 𝑺𝒂𝒍𝒆𝒔 = 𝐸𝐵𝐼𝑇 𝑂𝑝𝑒𝑟𝑎𝑡𝑖𝑛𝑔 𝑅𝑒𝑣𝑒𝑛𝑢𝑒𝑠 (6) 2010 2011 2012 2013 2014 Operating Revenues 233 329 665,00 € 230 013 910,00€ 210 550 032,00€ 203 730 401,00€ 182 122 107,00€ gn -1,42% -8,46% -3,24% -10,61%
Table 4 - Revenues growth between 2010 and 2014
2015 2016 2017 2018 2019
Operating
Revenues 171 318 449,76€ 165 769 513,96€ 163 413 829,37€ 166 763 812,88€
165 096 174,75€
By applying this formula for every SATA’s historical year and, at the end, an average of those values, so it could be used as an assumption of the forecasted ROS values.
2011 2012 2013 2014 Operating Revenues 230 013 910,00€ 210 550 032,00€ 203 730 401,00€ 182 122 107,00€ EBIT 4 558 377,00€ 7 160 252,00€ -22 886 583,00€ -31 332 072,00€ ROS 1,98% 3,40% -11,23% -17,28%
Table 6 - Return on Sales
As it is noticed in table 6, from 2013 on the percentage of profit relatively to their revenues is significantly declining more and more, mainly because SATA’s net operating income (EBIT) became negative since that year. What’s more, it is noticeable that the Return on Sales is a quite irregular variable, so the best solution would be to average the values between 2011 and 2013 (because of the poor results of 2014), resulting on a value of -1,95%, and use it as a forecast for that ratio in 2015 and 2016. From 2017 to 2019 the ROS would approximate its value to a normal year value, such as 3,4% in 2012. Nonetheless, the tax effect should be removed from the Return on Sales ratio.
The following table basically translates the EBIT (1-t) values representing the first portion that will be used on the calculation of the SATA’s Free Cash Flow to the Firm, as it is explicit in the equation 5.
2015 2016 2017 2018 2019 Operating Revenues 171 318 449,76€ 165 769 513,96€ 163 413 829,37€ 166 763 812,88€ 165 096 174,75€ ROS (after taxes) -1,95% -1,95% 3,40% 3,40% 3,40% EBIT (1-t) -2 639 719,94€ -2 554 220,47€ 4 390 246,39 € 4 480 246,44€ 4 435 44397€,
Table 7 - Revenues, ROS and EBIT(1-t) forecast
Moving on to the second item for the FCFF calculation, ∆Net Fixed Assets (CAPEX), also known as Capital Expenditure, it is represented by the Total of the Non-Current Assets,
which include tangible fixed assets, intangible fixed assets, financial participations, deferred taxes and accounts receivable.
2015 2016 2017 2018 2019 Operating Revenues 171 318 449,76€ 165 769 513,96€ 163 413 829,37€ 166 763 812,88€ 165 096 174,75€ (Fixed Assets/Operating Revenues) 38,06% 38,60% 38,60% 38,60% 38,60% Fixed Assets 66 133 096,71 € 63 991 072,26 € 63 081 720,61 € 64 374 895,88 € 63 731 146,92€ Δ Fixed Assets (Net CAPEX) -7 125 946,29 € -2 142 024,45 € -909 351,66 € 1 293 175,27 € - 643 748,96€
Table 8 - Net Capex forecast
Due to its cash outflow effect, it is not reflected in the income statement, the Capital Expenditure variation will be deducted from the FCFF. The values predicted from 2015 until 2019 were reached by computing an average between 2011 and 2014. So, the value of the Fixed Assets were divided by the Operating Revenues (historical data) and, the average of these values (excluding 2014), which results on 38,06%, will be multiplied by the predicted Operating Revenues. Those values are represented in table 8 followed by their variation between 2014 and 2019.
Finally, regarding to ∆Net Working Capital Needs (∆NWCN), it is represented by the next equation:
∆𝑵𝒆𝒕 𝑾𝒐𝒓𝒌𝒊𝒏𝒈 𝑪𝒂𝒑𝒊𝒕𝒂𝒍 𝑵𝒆𝒆𝒅𝒔 = 𝑁𝑒𝑡 𝑂𝑝. 𝑊𝐶𝑁 + 𝑁𝑒𝑡 𝑁𝑜𝑛 𝑂𝑝. 𝑊𝐶𝑁 (7)
The previous equation represents the last part required to the calculation of the Free Cash Flow to the Firm, which includes the sum of the Net Operating Working Capital Needs (Operating current Liabilities deducted from the Operating current Assets) and the Net Operating Working Capital Needs (Operating current Liabilities deducted from the Non-Operating current Assets).
In table 9 it is observed that it is used exactly the same process explained before to estimate the Net Working Capital Needs for the SATA’s future years: the NWCN were divided by the Operating Revenues of historical years (from 2011 to 2014), it is computed an average
of those values and multiplied by all of the Operating Revenue’s future values (from 2015 until 2019). Lastly, it is calculated the variation of those results to be deducted from the FCFF, since it does not represent any actual cash flow.
2015 2016 2017 2018 2019 Operational Revenues 171 318 449,76€ 165 769 513,96€ 163 413 829,37€ 166 763 812,88€ 165 096 174,75€ NWCN / Operational Revenues 24,56% 24,56% 24,56% 24,56% 24,56% NWCN 40 109 294,64 € 38 810 170,69 € 38 258 654,80 € 39 042 957,22 € 38 652 527, 65€ ∆NWCN -8 954 607, 36€ -1 299 123,95 € -551 515, 89€ 784 302,42 € -390 429, 92€ Table 9 - NWCN forecast
So, as far as Free Cash Flow to the Firm is concerned, we already have available all the values needed to compute it.
2015 2016 2017 2018 2019
EBIT (1-t) -2 639 719,94€ -2 554 220,47€ 4 390 246,39 € 4 480 246,44€ 4 435 44397€,
Net CAPEX -7 125 946,29 € -2 142 024,45 € -909 351,66 € 1 293 175,27 € - 643 748,96€
ΔNWCN -8 954 607, 36€ -1 299 123,95 € -551 515, 89€ 784 302,42 € -390 429, 92€
FCFF 13 440 833,71€ 886 927,93 € 5 851 113,74 € 2 402 768,95€ 5 469 622,50€
Table 10 - FCFF (Free Cash Flow to the Firm)
As Mota and Custódio (2007) referred, the value of a company does not depend on its actual situation but on its future cash flows. Hence, it is needed to discount (at a certain discount rate, in this case WACC, which will be explained below) those future cash flows – using equation (1) applied to the FCFF - to reach the actual values. What’s more, instead of the financial cash flows, the operational cash flows are the ones reflected by this model.
An important question regarding the valuation process of a company is the fact that its lifetime is unlimited. Because of that, in these cases the provisional period is often subdivided