Exploring the capabilities of gas
chromatography and liquid chromatography
single and tandem mass spectrometry for
discriminating and characterizing marine
oils by using chemometric tools
by
Yingxu Zeng
Thesis for the degree of European Master in Quality in Analytical
Laboratories
National Institute of Nutrition and Seafood Research, Bergen, Norway Department of Chemistry,
University of Bergen, Norway
Exploring the capabilities of gas chromatography and
liquid chromatography single and tandem mass
spectrometry for discriminating and characterizing marine
oils by using chemometric tools
Thesis for the degree of European Master in Quality in Analytical Laboratories
Yingxu Zeng
Bergen, February 2010National Institute of Nutrition and Seafood Research, Bergen, Norway Department of Chemistry,
University of Bergen, Norway
Contents
Acknowledgments ... i
List of Publications ... ii
List of Abbreviations ... iii
Abstract ... iv 1 Introduction ... 1 1.1 Background ... 1 1.2 Lipids generalities ... 2 1.2.1 Lipids ... 2 1.2.2 Fatty acids ... 3
1.2.3 Polyunsaturated fatty acid families ... 4
1.2.4 Triacylglycerols ... 6
1.3 Dietary oils discrimination ... 10
1.4 Triacylglycerols characterization ... 15
1.5 Chemometric techniques ... 18
1.5.1 Multivariate analysis ... 18
1.5.2 Chemometric applications in liquid chromatography-mass spectrometry ... 19
1.6 Aims of the study ... 22
2 Discrimination study based on fatty acids composition ... 23
2.1 Background ... 23
2.2 Experimental ... 24
2.2.1 Reagents and samples ... 24
2.2.2 Fatty acid methyl esters preparation ... 25
2.2.3 Gas chromatography instrumentation ... 25
2.2.4 Principal component analysis ... 26
2.3 Results and discussion ... 26
2.3.1 Full fatty acid methyl esters profiles discrimination ... 30
2.3.3 Full fatty acid methyl esters profiles of marine oils discrimination ... 33
2.4 Conclusions ... 35
3 Discrimination study based on triacylglyerol profiles ... 36
3.1 Background ... 36
3.2 Experimental ... 37
3.2.1 Materials ... 37
3.2.2 Liquid chromatography ion-trap mass spectrometry ... 38
3.2.3 Chemometric data analysis ... 39
3.3 Results and discussion ... 39
3.3.1 Data treatment by component detection algorithm ... 39
3.3.2 Principal component analysis ... 44
3.4 Conclusions ... 51
4 Characterization study: Triacylglycerols ... 52
4.1 Background ... 52
4.2 Experimental ... 54
4.2.1 Materials and reagents ... 54
4.2.2 Sample protocols ... 54
4.2.3 Instrumentation ... 55
4.2.4 Computation ... 56
4.3 Results and discussion ... 59
4.3.1 LC-ESI-MS2 analysis of TAG standards ... 59
4.3.2 LC-ESI-MS2 analysis of TAG in cod liver oil ... 61
4.3.3 Comparison with the lipase method ... 72
4.4 Conclusions ... 72
5 Concluding remarks ... 73
i
Acknowledgments
The present work was financed by the Erasmus Mundus Programme and carried out at the National Institute of Nutrition and Seafood Research (NIFES) in Bergen, and Department of Chemistry, University of Bergen under the supervision of Prof. Pedro Araujo and Prof. Bjørn Grung.
I am heartily grateful to Prof. Pedro Araujo, whose consistent motivation, enthusiastic guidance and dedicated support throughout my project enabled me to complete this work successfully. I am really impressed by his great knowledge and passion for science.
I would like to express my deep gratitude to Prof. Bjørn Grung for his valuable guidance, helpful discussions, constructive advices, and great support in Chemometrics and for always helping me in many administrative procedures related to my enrollment, accommodation, and scholarship issues.
I would like to thank NIFES for providing excellent work facilities and all the personnel in the nutrition laboratory and the IT service for technical assistance.
I am particularly indebted to Prof. Isabel Cavaco, from University of Algarve for her excellent introduction of the Erasmus Mundus Programme. Without her great support and encouragement, I would not have enrolled in the European Master in Quality in Analytical Laboratories (EMQAL) Programme. I am also grateful for her assistance in several modules that she conducted.
I would also like to take the opportunity to thank my previous supervisor, Prof. Yizeng Liang, from Central South University, for his enormous support in EMQAL application and also for his introduction to the world of Analytical chemistry and Chemometrics.
Further and special thanks to all the people who spent their time and shared their knowledge for helping me in my work: Zhen-Yu Du, Thu-Thao Nguyen, Jeffery Zhang, Yanchun He, and warm thanks to my colleagues from EMQAL: Phoebe Trio, Liping Xiao, Jelena Milinovic, Muhammad Saif Ur, whose friendship and collegiality have enriched my time here.
Last but not least, I would like to thank my family for their great love, concern and support at all times.
Yingxu Zeng
ii
List of Publications
[1] P. Araujo, Y.X. Zeng, Z.Y. Du, T.T. Nguyen, L. Frøyland, B. Grung, Discrimination of omega-3 rich marine animal oils by gas chromatography, Journal of Chromatography A (Accepted).
[2] Y.X. Zeng, P. Araujo, B. Grung, Evaluation of liquid chromatography and mass spectrometry profiles as potential tools for fingerprinting marine oils. (Manuscript).
[3] Y.X. Zeng, P. Araujo, Z.Y. Du, T.T. Nguyen, L. Frøyland, B. Grung, Structural characterization of triacylglycerols in cod liver oil using liquid chromatography electrospray tandem mass spectrometry, Talanta (Submitted).
iii
List of Abbreviations
APCI Atmospheric pressure chemical ionization CODA Component detection algorithm
DAG Diacylglycerols
DHA Docosahexaenoic acid (22:6n-3) DPA Docosapentaenoic acid (22:5n-3) ECN Equivalent carbon number EIC Extracted ion chromatogram EPA Eicosapentaenoic acid (20:5n-3) ESI Electrospray ionization
FAME Fatty acid methyl esters FFA Free fatty acids
FID Flame ionization detector GC Gas chromatography
GC-MS Gas chromatography-mass spectrometry HPLC High performance liquid chromatography
LC-ESI-MS Liquid chromatography electrospray single mass spectrometry LC-ESI-MS2 Liquid chromatography electrospray tandem mass spectrometry MAG Monoacylglycerols
MCQ Mass chromatographic quality MS Mass spectrometry
NMR Nuclear magnetic resonance PCA Principal component analysis PUFA Polyunsaturated fatty acids SFA Saturated fatty acids TIC Total ion chromatogram TAG Triacylglycerols
iv
Abstract
Assessing the capabilities of instrumental techniques for discriminating marine oils and studying the positional distribution of fatty acids on the backbone of triacylglycerols (TAG) are of vital importance from commercial, nutritional, biochemical and technological points of view. This represents a great challenge for analysts due to the wide variety of fatty acids and the complexity of naturally occurring TAG species.
In this thesis, the potential of gas chromatography (GC) for discriminating full fatty acid methyl ester (FAME) profiles of marine oils (cod liver, salmon, seal and whale oils) is evaluated by means of principal component analysis (PCA). The FAME profiles from plant oils such as rapeseed, linseed and soy oils and seven different brands of omega-3 (ω-3) fatty acids supplements are also used in the discrimination process. The results from the PCA plots can reliably distinguish between plant, ω-3 fatty acids supplements, fish and marine mammal oils. By removing the contribution of the ω-3 fatty acids supplements and plant oils, it is possible to discriminate within every type of fish and marine animal oils. GC offers a rapid, simple and convenient means of discriminating marine oils from different species, brands and grades.
The thesis also studies the feasibility of fingerprinting and discriminating marine oils based on their TAG profiles using liquid chromatography electrospray single and tandem mass spectrometry (LC-ESI-MS and LC-ESI-MS2) in conjunction with chemometric tools. Four kinds of profiles, including total ion chromatogram (TIC) and mass spectral profiles derived from LC-ESI-MS and LC-LC-ESI-MS2 experiments, are examined prior to data pretreatment by component detection algorithm (CODA) to reduce the noise and background. These profiles are subsequently subjected to PCA to evaluate their performance for discriminating marine oils and plant oils. The results show that the TIC profiles derived from both MS and LC-ESI-MS2 experiments turn out to be inadequate for discrimination of complex marine oils. Although the classification results are remarkably improved by using single mass spectral profiles derived from LC-ESI-MS experiments, the differentiation among seal oils of different species and qualities is not achieved. In comparison, the use of tandem mass spectral profiles from
LC-ESI-MS2 experiment is demonstrated to be the best strategy for discrimination of marine oils which enables the differentiation not only between marine oils and plant oils but also among the seal oils of different species and qualities. The tandem mass spectral profiles could preferably represent the characteristics of TAG patterns, and could be used as an alternative approach for fingerprinting and detecting of adulteration of marine oils.
The final aspect studied in the present thesis is the structural characterization of TAG by using LC-ESI-MS2 for identifying the positional distribution of fatty acids on the glycerol backbone in cod liver oil. A computational algorithm is developed to characterize rapidly and interpret automatically the mass spectra of the various detected TAG species. Three different solvent mixtures are used to dissolve the sample prior to the instrumental analysis. The discrepancies between the results indicate that the choice of the solvent system influences the identification of the TAG species. The results obtained by the proposed LC-ESI-MS2 approach are in agreement with those from the well established lipase method. LC-ESI-MS2 provides a suitable and powerful strategy for the structural characterization of TAG in cod liver oil.
1
1 Introduction
1.1 Background
Marine oils are the important sources of omega-3 (ω-3) polyunsaturated fatty acids (PUFA), which have attracted extensive interests due to the accumulating scientific evidences supporting their potential health benefits in improving chronic cardiovascular diseases 1-3 and inflammatory pathologies 4, 5, thus leading to an escalating consumer demand for ω-3 fatty acids rich functional food, dietary supplements and pharmaceuticals.
There are two critical issues for marine oils studies which constitute great challenges for analysts: discrimination of various marine oils and characterization of the positional distribution of fatty acids on the triacylglycerols (TAG) backbone in marine oils.
A literature overview of the different instrumental techniques used for the analysis of plant, fish and marine animal oils shows that the current literatures on nutritional oil discrimination and characterization has been mainly focused on plant oils, while the studies on marine oils represents a meagre proportion. It is surprising that the capabilities of gas chromatography (GC) and liquid chromatography electrospray single and tandem mass spectrometry (LC-ESI-MSand LC-ESI-MS2) techniques has not been explored yet in the discrimination of marine oils by using the fatty acid composition and TAG profiles. Although the importance of developing techniques aiming at detecting adulteration of marine oils has been emphasised more than 100 years ago 6, 7, it has been much neglected by practitioners during the course of a century and it is a topic of contemporary relevance that needs attention.
In addition to marine oils discrimination, there is a pressing need accordingly for analysts to develop reliable analytical methods with the capacity to characterize the positional distribution of fatty acids on the backbone of TAG in marine oils in order to gain a better knowledge of their various lipids properties and structural composition and thereby utilize their nutritional values further. Although LC-ESI-MS2 has become increasingly popular for characterizing TAG in plant
2
oils due to the high degree of information derived from its implementation, the application of LC-ESI-MS2 in characterization of TAG in marine oils has not been investigated yet, which might be ascribed to the high complexity of naturally occurring TAG present in marine oils.
1.2 Lipids generalities
1.2.1 Lipids
Lipids can be defined mainly as fatty acids, their derivatives, and substances related biosynthetically or functionally to these compounds, which are generally soluble in organic solvents such as chloroform, and are most commonly found in the tissues of plants, animals and microorganisms 8. Generally, the classification of lipids are based on their physical properties at room temperature (oils are liquid and fats are solid), their polarity (polar and neutral lipids), their essentiality for humans (essential and nonessential fatty acids), or their structure (simple or complex). For example, based on structure, lipids can be classified as derived, simple or complex lipids. Derived lipids include fatty acids and alcohols, which are the building blocks for the simple and complex lipids. Simple lipids (usually neutral), compose of fatty acids and alcohol components, include acylglycerols, ether acylglycerols, sterols, and their esters and wax esters, which can be hydrolyzed to an alcohol and an acid. Complex lipids (usually polar) include glycerophospholipids (phospholipids), glyceroglycolipids (glycolipids), and sphingolipids 9. Dietary lipids are essential component for human body since they function as sources of metabolic energy, carrier of fat-soluble vitamins, and contribute to the formation of cell and tissue membranes. Among all the dietary lipids, those derived from fish and marine mammals have recently become a research focus due to their significant contents of essential ω-3 PUFA, which have been recognized to be important in human health and nutrition. Marine lipids are composed of neutral lipids comprising TAG, phospholipids, sterols, wax esters, and some unusual lipids such as glycerol esters, glycolipids, sulfolipids, and hydrocarbons. Most of the variations in lipid are found in the TAG fractions, whereas the phospholipids show fewer variations 10.
3
1.2.2 Fatty acids
Fatty acids are straight chain carboxylic acids that constitute the starting point in lipid structures. Fatty acids with a chain length of 10 carbon atoms or less are referred as short-chain fatty acids, and they are all saturated; while fatty acids having up to 14 carbon atoms are medium-chain fatty acids. Those with more than 14 carbon atoms are long-chain fatty acids, and may be saturated or unsaturated. These kinds of compounds are critical for the normal development and function of all organisms, and in particular, very long chain PUFA are necessary for the health and maintenance of higher organisms such as mammals.
Fatty acid nomenclature
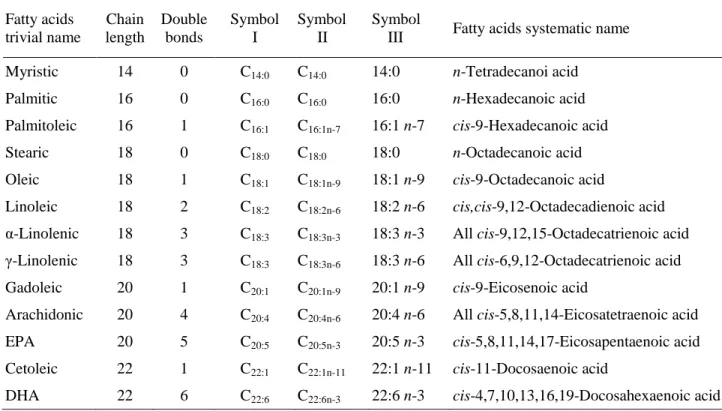
Fatty acids trivial names are commonly used, for example, palmitic, stearic, or oleic acids, as shown in Table 1.110. Nowadays, more meaningful systematic names defined by standard IUPAC terminology are encouraged by naming fatty acid after its parent hydrocarbon (Table 1.1).
Table 1.1: Terms and symbols designating major fatty acids 10
Fatty acids trivial name Chain length Double bonds Symbol I Symbol II Symbol
III Fatty acids systematic name
Myristic 14 0 C14:0 C14:0 14:0 n-Tetradecanoi acid
Palmitic 16 0 C16:0 C16:0 16:0 n-Hexadecanoic acid
Palmitoleic 16 1 C16:1 C16:1n-7 16:1 n-7 cis-9-Hexadecanoic acid
Stearic 18 0 C18:0 C18:0 18:0 n-Octadecanoic acid
Oleic 18 1 C18:1 C18:1n-9 18:1 n-9 cis-9-Octadecanoic acid
Linoleic 18 2 C18:2 C18:2n-6 18:2 n-6 cis,cis-9,12-Octadecadienoic acid
α-Linolenic 18 3 C18:3 C18:3n-3 18:3 n-3 All cis-9,12,15-Octadecatrienoic acid
γ-Linolenic 18 3 C18:3 C18:3n-6 18:3 n-6 All cis-6,9,12-Octadecatrienoic acid
Gadoleic 20 1 C20:1 C20:1n-9 20:1 n-9 cis-9-Eicosenoic acid
Arachidonic 20 4 C20:4 C20:4n-6 20:4 n-6 All cis-5,8,11,14-Eicosatetraenoic acid
EPA 20 5 C20:5 C20:5n-3 20:5 n-3 cis-5,8,11,14,17-Eicosapentaenoic acid
Cetoleic 22 1 C22:1 C22:1n-11 22:1 n-11 cis-11-Docosaenoic acid
4
For example, oleic acid is cis-9-octadecenoic acid, a carboxylic acid (oic) with 18 carbon atoms (octadec) and one olefinic centre (en) which lies between carbon 9 and 10 (counting from the carboxyl end) and has cis configuration, i.e. CH3(CH2)7CH=CH(CH2)7COOH. Symbol
designations (Table 1.1) are also found in common usage, which are composed of the carbon number in the fatty acid chain followed by a colon, then the number of double bonds and the position of the first double bond counting from the methyl end of the fatty acid (usually denoted by the letter n minus an integer number such as 3, 6, 9, 12 and 15). For example, n-3 and n-6 (also referred as ω-3 and ω-6 fatty acids) denote fatty acids with the first double bond at carbon 3 and 6 from the methyl end, respectively. The symbol, 20:5 n-3 identifies a fatty acid, i.e., eicosapentaenoic acid (EPA), with 20 carbon atoms and 5 double bonds, the first double bond occurring after the third carbon atom.
1.2.3 Polyunsaturated fatty acid families
1.2.3.1 Classification of polyunsaturated fatty acid families
PUFA are important structural components that confer membrane fluidity and selective permeability. They also serve as precursors for eicosanoids, growth regulators and hormones, and are constituents of membrane phospholipids involved in signal transduction11, 12. They are fatty acids of 18 carbons or more in length with two or more double bonds. PUFA can be classified into two major groups, ω-3 and ω-6 families, depending on the position of the first double bond proximate to the methyl end of the PUFA. The ω-6 family, such as linoleic and arachidonic acid, is mainly found in most of the vegetable oils, while the ω-3 family, such as α-linolenic acid (ALA, C18:3n-3) is mostly found in vegetable oils (principally soybean and canola),
EPA and docosahexaenoic acid (DHA, C22:6n-3) are mainly found in marine oils.
The recommended intake of ω-6/ω-3 PUFA ratio is 2.3:1, while the present dietary pattern indicates a much higher ratio of ω-6/ω-3 PUFA ratio (8-12:1) 13. Imbalance in ω-3 and ω-6 PUFAs metabolism has been implicated in hypertension as well as chronic diseases such as diabetes, hypercholesterolemia, rheumatoid arthritis, autoimmune disorders, Crohn's disease, and cancer, etc14, 15 .
5
1.2.3.2 Elongation and desaturation of polyunsaturated fatty acids
PUFA are obtained either through diet or synthesized from dietary essential fatty acids (EFA). Through a common desaturase/elongase system (Fig. 1.1 16), linoleic acid (LA, C18:2n-6) is
metabolized to arachidonic acid (AA, C20:4n-6) and ALA is metabolized to EPA and DHA.
Figure 1.1: Elongation and desaturation of long-chain PUFA. Arrows with solid line are found both in
mammals and lower eukaryotes, while arrows with dotted line are exclusively for lower eukaryotes. Fatty acids in square frame indicate the pathway is exclusively in mammals 16.
A detailed description of the biosynthesis of PUFA by increasing the carbon chain length and degree of unsaturation through the addition of extra double bonds to the carboxyl group is shown in Fig. 1.1. For example, ALA undergoes desaturation to form stearidonic acid (SDA, C18:4n-3) by
a Δ6-desaturase, and SDA is elongated to eicosatetraenoic acid (ETA, C20:4n-3). EPA is
synthesized through the addition of another double bond by a Δ5-desaturase to ETA, which is subsequently converted to docosapentaenoic acid (DPA, C22:5n-3) through the further elongation.
6
higher eukaryotes such as mammals, DPA is firstly elongated to tetracosapentaenoic acid (TPA, C24:5n-3), which is desaturated to tetracosahexaenoic acid (THA, C24:6n-3) by a Δ6-desaturase. The
THA is then oxidized to DHA in peroxisomes; while in lower eukaryotes, DHA is synthesized by direct addition of a double bond to DPA by a Δ4-desaturase 16. Similarly, LA undergoes the same desaturation and elongation steps as ALA to form long chain ω-6 PUFA. Normally, only a very small proportion of dietary LA and ALA can be converted to PUFA, as most of them are β-oxidized to provide energy. The already low formation of PUFA can be further depressed by various nutritional and hormonal factors 17.
1.2.3.3 Importance of ω-3 polyunsaturated fatty acids
Increasing evidences have shown that ω-3 PUFA have a range of potentially favourable effects on cardiovascular diseases, inflammatory diseases, brain function and mental health18. The nutraceutical potentials of ω-3 PUFA include protection against arrhythmias, diabetes, coronary heart disease, stroke and hypertension, beneficial effects in Crohn disease, asthma and chronic obstructive pulmonary diseases, alleviation of symptoms of cystic fibrosis, cancers of the breast, colon, and prostate, prevention of inflammatory and autoimmune disorders (rheumatoid arthritis, psoriasis) and improvement in growth and development10, 14, 19.
1.2.4 Triacylglycerols
1.2.4.1 Structure and composition
Dietary oils are complex mixtures containing a wide range of compounds, including TAG, diacylglycerols (DAG), free fatty acids (FFA), phospholipids, and other minor components. TAG are the main components of dietary oils (> 98 %), which are made up of three fatty acid molecules esterified to a glycerol backbone. The molecular structure of each individual TAG species can be described basically by three main attributes 20:
– the total carbon number (CN) defined as the sum of the alkyl chain lengths of the three fatty acids,
– the degree of unsaturation in each fatty acid, and
7
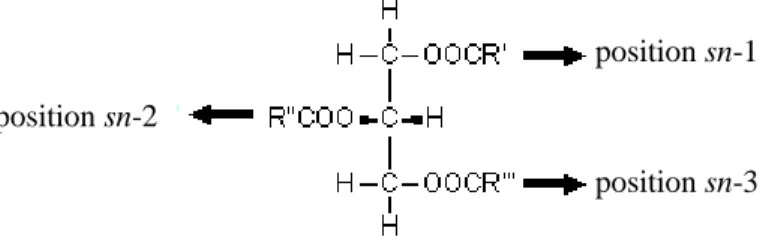
Moreover, each TAG species may be differentiated in regiospecific/stereospecific isomers by determining the positioning of three fatty acids on the glycerol backbone, since the trihydric alcohol glycerol itself has a plane of symmetry. When the two primary hydroxyl groups are esterified with different fatty acids, the resulting TAG can be asymmetric and thus can display optical activity. The stereochemistry of TAG can be represented by a Fischer projection and the “stereospecific numbering” (sn) system as recommended by the IUPAC-IUB commission on the nomenclature of glycerolipids21. A Fischer projection of a natural L-glycerol derivative is shown in Fig. 1.2, the secondary hydroxyl group is labelled as position sn-2. The carbon atom above this then becomes sn-1 position while the below becomes sn-3 position. A single molecular species is identified by listing the sn-1, sn-2 and sn-3 positions in this particular order 20.
Figure 1.2: Schematic structure of a Fischer projection of a TAG molecule
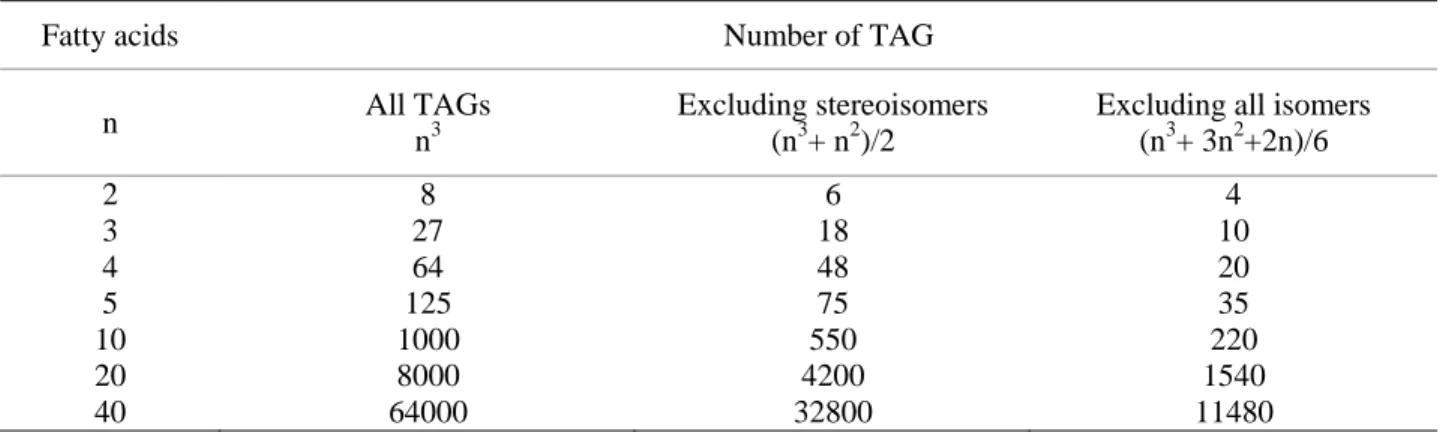
The potential number of TAG is quite large and it rises very quickly with the number of fatty acids present in the pool (Table 1.2). For example, a fat containing only 2 different fatty acids results in the theoretical number of 8 possible TAG; or 6 TAG if stereoisomers are discounted and 4 TAG if all the isomers are excluded.
AAA AAB ABA BAA ABB BAB BBA BBB
A3 A2B AB2 B3
Most vegetable and plant oils contain normally 5-10 different fatty acids, which may give 125-1000 individual TAG molecules as shown in Table 1.2. However, the situation is even more complex with samples such as oils derived from fish or marine mammals containing 20-40 fatty acids.
position sn-1 position sn-2
8
Table 1.2: Relation between number of fatty acids (n) and number of TAG
Fatty acids Number of TAG
n All TAGs
n3
Excluding stereoisomers (n3+ n2)/2
Excluding all isomers (n3+ 3n2+2n)/6 2 3 4 5 10 20 40 8 27 64 125 1000 8000 64000 6 18 48 75 550 4200 32800 4 10 20 35 220 1540 11480
1.2.4.2 Digestion, absorption and metabolism
The digestion, absorption, and metabolism of TAG are efficient, relatively well-defined processes. The major phases of these processes are listed in Table 1.3 22. Generally, fatty acid chain length and degree of unsaturation as well as the positional distribution of fatty acids in dietary TAG profoundly affect digestion, absorption, and metabolism of dietary fats 23, 24.
Table 1.3: Major phases of TAG digestion, absorption, and metabolism
intraluminal digestion micellar solubilization
permeation across cell membrane chylomicron formation
chylomicron release into lymphatics transport in lymph
lipolysis at tissue sites fatty acid oxidation
The first step in the digestion of TAG which takes place in the stomach, is a partial enzymatic hydrolysis into DAG and FFA, performed by lingual lipase and possibly gastric lipase 25, 26. Both lipases preferentially hydrolyze the sn-3 ester bond resulting in formation of sn-1,2-DAG 25, 27. Approximately 30 % of total dietary TAG may be digested in the stomach 28. The products remaining in the stomach after hydrolysis, i.e., FFA, DAG, and monoacylglycerols (MAG) contained in emulsion droplets, are propelled through the pylorus into the duodenum (Fig. 1.3).
9
The major digestion of TAG results from hydrolysis with pancreatic lipase in the intestine. Pancreatic lipase acts in conjunction with co-lipase and bile salts to digest TAG (Fig. 1.3). The process of hydrolysis is regiospecific since pancreatic lipase preferentially hydrolyses fatty acids from sn-1 or sn-3 positions of the TAG, with the release of sn-2-MAG and FFA 29. Isomerization of the sn-2-MAG to sn-1 or sn-3-MAG occurs to some extent, and these can be degraded completely to glycerol and FFA 27.
In the human adult, most of the fatty acid in the sn-2 position remain intact as sn-2-MAG during digestion and absorption as the rate of hydrolysis at the sn-2 position of the TAG is very slow 29. The lipolysis products including FFA, MAG and DAG are solubilised together with phospholipids and cholesterol by lysophospholipids and bile salts into micelles cells and thus absorbed (Fig. 1.3). However, most of these products have specific melting points above body temperature, which may influence subsequent digestion, absorption, and metabolism. MAG can readily form mixed micelles and are subsequently absorbed, while FFA have variable incorporation into mixed micelles. For example, digestion and absorption of long chain saturated fatty acids (SFA) occurs less readily than for shorter chain or more highly unsaturated fatty acids since the latter require lower concentrations of bile salts to achieve emulsification into micellar form. Besides, the unesterfied long chain SFA tend to form hydrated acid-calcium soaps that are insoluble in aqueous media at the pH of the intestine, which will also hamper the absorption of long chain SFA. Evidences also indicate the better absorption of SFA as sn-2-MAG rather than as FFA29-31.
Within the intestine, the fatty acids in the sn-2 position of the MAG and the fatty acids released from the sn-1 or sn-3 position of the TAG are absorbed in mucosal cells and re-synthesized into TAG, whereby the fatty acids at the sn-2 position in dietary TAG are conserved. The newly synthesized TAG are incorporated into lipoprotein complexes termed chylomicrons (CM), consisting mainly of TAG (86-92 %) and cholesterol esters 1.4 %), free cholesterol (0.8-1.6 %), phospholipids (6-8 %), and apoprotein (1-2 %) 22. CM are secreted into the lymph and then exported into the plasma in the form of very-low-density lipoproteins (VLDL). These particles are transported to the peripheral tissues, where they are hydrolysed, releasing FFA, most of which are absorbed into the adjacent adipocytes and re-utilized for TAG synthesis within the cell 32. Eventually, the CM remnants are returned to the liver, where the remaining lipids are
10
hydrolysed and absorbed (Fig. 1.3). The FFA within the liver can be utilized for a variety of purposes, from oxidation to the synthesis of structural lipids, but a proportion is re-converted into TAG, and some of this is stored as lipid droplets within the cytoplasm of the cells. Excessive accumulation of storage TAG is associated with fatty liver, insulin resistance and type 2 diabetes.
CH2OOCR CH2OOCR' CH2OOCR'' lingual lipase gastric lipase CH2OOCR CH2OOCR' CH2OH
+
FFADietary TAG sn-1,2-DAG
pancreatic lipase CH2OH CH2OOCR' CH2OH
+
FFA Intestine Stomach sn-2-MAG CH2OH CH2OOCR' CH2OOCR''+
sn-2,3-DAG(minor) DuodenumLiver
CH2OOCR CH2OOCR' CH2OH CH2OH CH2OOCR' CH2OOCR''+
Isomerization(minor) FFA micelles cells bile salts lysophospholipids phospholipids cholesterol TAG Lymphatics Nascent CM Lymph plasma VLDL TAG peripheral tissues FFA hydrolysis Resynthesis TAG CM RemnantFigure 1.3: A representation of the digestion, absorption and metabolism of TAG
1.3 Dietary oils discrimination
Dietary oils authenticity has become an important subject from both a commercial and nutritional perspective. Authenticity covers many aspects, including adulteration, mislabeling, discrimination, classification, characterization and misleading origin.
11
Dietary oils possess a characteristic and more or less unique pattern of fatty acids and TAG. These patterns can be used as a means of identification for batch-consistency testing, detection of adulteration and possibly as a basis for a chemotaxonomy, revealing relationships between species 33. Fatty acids composition of dietary oils has been traditionally used in the food industry as an indicator of purity and adulteration, although this function might be limited in the interpretation of data due to the wide variation in dietary oils from different geographical origins. FAO/WHO Codex Committee on Fats and Oils specified the routine testing of the purity of dietary oils and fats, which is primarily based on the determination of the fatty acids composition by gas liquid chromatography (GLC) and comparison of the obtained values with purity criteria
34
. In addition to fatty acids composition, TAG composition has also been established as a measurement of the quality and purity of dietary oils, which is used increasingly in the food industry to confirm the authenticity of dietary oils 35. Although TAG are directly related to the fatty acids composition of dietary oils, the stereospecific positional distribution of fatty acids on the glycerol backbone remains preserved during analysis. As a consequence of that, TAG patterns of dietary oils usually provide a larger amount of information than a simple fatty acids profiling.
Numerous instrumental techniques have been developed to monitor the authenticity of dietary oils. A literature overview of the different instrumental techniques used for the analysis of plant, fish and marine mammal oils in studies is given in Table 1.4, where the terms discrimination, adulteration, classification, profiling, differentiation, authentication or characterization have been a vital and important component of the various studies. It can be observed that most of the current discrimination studies are based on chromatographic analysis by using GC and high performance liquid chromatography (HPLC). These techniques have been complemented with many other modern techniques, such as silver ion chromatography, mass spectrometry (MS), nuclear magnetic resonance spectrometry (NMR), near-infrared spectroscopy (NIR), Raman spectroscopy, etc. The conjunction of chromatography and mass spectrometry methods, such as gas chromatography-mass spectrometry (GC-MS), HPLC coupled to atmospheric pressure chemical ionization-MS (HPLC/APCI-MS), are growing in popularity for dietary oils discrimination as much more useful information could be derived from them than a single technique.
12
Table 1.4: Literature overview of the different analytical techniques used in the discrimination of oils derived from plants, fish and marine mammals.
The numbers under every technique-column indicate how many times a technique has implemented for a particular oil.
Oil
Chromatography IR NMR MS Other
References
Gas Liquid Other
NIR MIR 1H 13C 31P ESI APPI HS MaldiToF F E R N
GC GCMS GCIRMS HPLC HPLC APCI-MS Ag-HPLC APCI-MS Ag-TLC Almond 1 1 2 1 1 1 36-39 Amaranth 1 1 37 Apricot 1 40 Avocado 2 36, 41 Blackcurrant 1 41 Borage 1 41 Bran 1 1 42 Brazilnut 1 1 37 Camellia 1 1 1 1 1 40, 42, 43 Canola 1 1 1 44, 45 Castor 1 1 1 40, 42 Cayenne 1 1 42 Cocoa butter 1 1 42 Coconut 1 1 1 1 1 1 39, 42, 46 Corn 3 1 2 2 2 4 1 1 4 1 1 1 1 37, 41, 42, 44, 4739, 45, 48 49-59 Corn germ 1 36 Cottonseed 2 1 1 1 2 1 41, 42, 44, 49, 50, 59 Dragon head 1 1 37 Egoma seed 1 1 42 Evening primrose 1 2 2 37, 41, 42 Grape seed 1 2 1 1 1 36, 41, 42, 53, 60 Grapestone 1 51 Groundnut 1 1 1 39, 48 Hazelnut 2 1 2 1 2 1 3 1 1 1 37, 39, 44, 51, 52, 56, 61-63
13 Table 1.4 Continued Husk 1 51 Jojoba 1 1 42 Kukui 1 41 Linseed 1 3 2 1 36, 37, 42, 53 Macadamia 1 1 2 37, 42 Milk Thistle 1 1 42 Mustard seed 1 1 44 Olive 8 2 4 1 1 6 1 3 1 1 3 1 1 1 1 1 1 39-45, 49-59, 61-69 Onion 1 70 Oregano 1 71 Palm 1 1 1 2 1 1 2 37, 39, 41, 42, 46, 48 Peanut 3 1 2 2 1 2 1 36, 40-42, 44, 45, 51, 53, 55, 56 Pepper seed 1 40 Perilla 1 1 1 42, 72 Pistachio 1 1 37 Poppy seed 1 1 1 1 37, 73 Prikachberry 1 40 Pumpkinseed 1 1 1 36, 55, 60 Rapeseed 4 2 1 1 3 1 1 1 2 1 1 37, 39-42, 44, 48, 49, 53, 55, 58, 68, 74 Redcurrant 1 41 Rice 1 75 Rosemary 1 71 Safflower 2 1 1 1 1 1 1 39-42, 44, 76 Sesame 2 1 3 1 1 1 1 1 39-42, 44, 45, 56, 72, 76 Soybean 4 1 2 3 2 1 1 1 1 3 1 1 36, 37, 39-42, 44, 45, 50, 51, 53, 55, 56, 58, 60, 76 Sunflower 4 2 1 2 3 4 1 1 1 4 1 1 1 1 1 36, 37, 39, 41, 42, 44, 45, 48-60, 68, 73 Tall 1 1 42 Tea seed 1 1 42
14 Table 1.4 Continued Tung 1 1 42 Turkey red 1 1 42 Walnut 2 2 1 1 1 1 36, 39, 40, 44, 45, 56 Wheat germ 2 1 36, 41, 60
Cod liver oil 1 1 1 2 1 42, 77-79
Cuttlefish 1 1 42 Fish 1 80 Herring 1 81 Mackerel 1 1 1 42, 81 Salmon 1 3 77, 81, 82 Saury 1 1 42 Seal 1 77
Shark liver oil 1 1 42
Sardine 1 1 42
Whale 1 1 42
Abbreviations: GCIRMS: GC-isotope radio MS; HPLC: High performance liquid chromatography; APCI-MS: Atmospheric pressure chemical ionization-MS; Ag-HPLC: Silver-HPLC; Ag-TLC: Silver-thin layer chromatography; NMR: Nuclear magnetic resonance; NIR: Near infrared spectroscopy; MIR: Mid infrared spectroscopy; ESI-MS: Electrospray ionization; HS: Headspace; APPI: Atmospheric pressure photospray ionization; MaldiToF: Matrix-assisted laser desorption ionization time-of-flight; F: Fluorescence; E: Carbon paste electrodes; R: Raman spectroscopy; N: Electronic nose.
15
Another main conclusion that can be drawn from Table 1.4 is that the current literature on nutritional oil discrimination has been mainly focused on plant oils and among them olive, sunflower and corn oil (either pure or mixed) are the most frequently investigated oils, representing 64, 50 and 43 % of the total number of references given in Table 1.4, respectively; while for the marine oils which are nutritionally important, only a meagre 3 % were represented and moreover the potentiality of popular techniques such as GC and LC-ESI-MS2 on the discrimination and adulteration of marine oils has not been explored yet. Consequently, it is quite significant to establish reliable strategies for the discrimination and detection of adulteration of marine oils and related products.
1.4 Triacylglycerols characterization
Characterization of TAG from oils and fats has long been a difficult task due to the enormous number of individual TAG species formed by various fatty acids as described in Section 1.2.4. A variety of analytical methods have been employed for the analysis of molecular species of TAG, which mainly include indirect and direct methods. The former are the traditional methods to determine the positional distributions of fatty acids on the backbone of TAG, such as enzymatic hydrolysis method using pancreatic lipase and stereospecific analysis by using Grignard reagent
83-85
. The drawback of these approaches lies in the involvement of tedious analysis procedures and the occurrence of possible isomerization of glycerides. Direct methods mainly consist of NMR 77, 86, 87 and MS 36, 37, 88 techniques, while the latter is favored especially when it is coupled to chromatographic techniques. HPLC is the most commonly employed separation technique coupled to MS for the analysis of TAG, which offers significant advantages over GC and thin-layer chromatography (TLC), as the conjunction of LC and MS techniques gives information both on molecular species compositions and on regiospecific distributions of fatty acids in the TAG molecules.
The MS technique has demonstrated its ability in the complete characterization of the TAG structure through the detailed information obtained, such as molecular weight, carbon number, the degree of unsaturation and the positions of acyl groups on the glycerol backbone 76, 89, 90. The analytical methods utilizing the MS technique for the TAG analysis from oils and fats mainly employed the following ionization techniques, electron ionization (EI) 91, chemical ionization
16
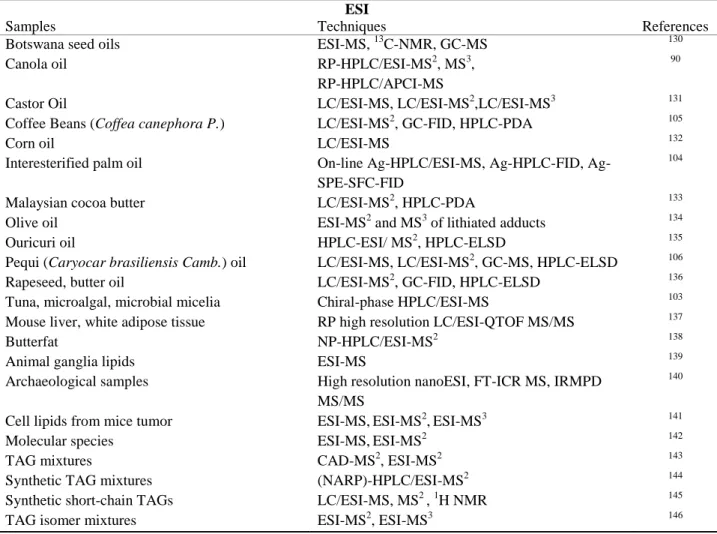
(CI) 92-94, desorption chemical ionization (DCI) 95, 96, fast atom bombardment (FAB) 89, 97, 98, atmospheric pressure chemical ionization (APCI) 37, 99-102and electrospray ionization (ESI) 76,
103-106
, among which APCI and ESI are the most popular techniques. Table 1.5 lists the literatures of TAG analysis in various matrices using APCI and ESI techniques in recent years.
Table 1.5: Literatures of TAG analysis from various matrices by APCI and ESI techniques
APCI
Samples Techniques References
93 plant oils (olive oil, sunflower oil, rice oil etc.)
(NARP)-HPLC/APCI-MS 107
Berry oils SFC/APCI-MS 108, 109
Black currant, alpine currant, cloudberry seed oil Ag-HPLC/APCI-MS 88
Canola oil RP-HPLC/APCI-MS, RP-HPLC/ESI-MS2, MS3 90
Conifer seed oils HPLC/APCI-MS, GC-FID 110
Corn oil Ag-LC×RP-LC/APCI-MS, ELSD,
HPLC-UV
111 Highly saturated fatty acid fats(coconut, cocoa
butter, palm oils etc.)
RP-HPLC/APCI-MS 112
Olive, hazelnut oil mixtures RP-HPLC/APCI-MS, GC-FID 113
Rape seed oil LC/APCI-MS 74
Rapeseed oil, sunflower seed oil LC/APCI-MS, LC/ESI-MS/MS, direct inlet ammonia NICI-MS/MS
114
Rice oil Ag-HPLC/APCI-MS 75
Seed oil of Momordica charantia L. var.
abbreviata Ser
(NARP)-HPLC/APCI-MS, 13C-NMR 115
Soybean oil RP-HPLC/APCI-MS 116
Soybean, rapeseed, hazelnut, olive, evening primrose, blackcurrant, blue poppy seed, maize germ oil
HPLC/APCI-MS 117
Soybean,linseed oil Ag-LC×RP-LC/APCI-MS 118
Structured lipid sample produced by rape seed oil with capric acid
HPLC/APCI-MS 119
Walnut, hazelnut, cashew nut, almond, poppy seed, yellow melon, mango, date oil
(NARP)-HPLC/APCI-MS, ELSD, HPLC-UV
120 Palm oil, cocoa butter, beef, pork, chicken fats RP-HPLC/APCI-MS 121
Beef, lamb, pork, chicken fat HPLC/APCI-MS 122
Lard, mutton tallow RP-HPLC/APCI-MS 123
Fat body of bumblebees Ag-LC×RP-LC/APCI-MS 124
Milk fat SFC/APCI-MS 125
Donkey milk RP-LC×Ag-LC /APCI-MS 126, 127
Bovine milk fat HPLC/APCI-MS 100
Margarine Base Stocks RP-HPLC/APCI-MS, HPLC-FID 128
17
Table 1.5 Continued
ESI
Samples Techniques References
Botswana seed oils ESI-MS, 13C-NMR, GC-MS 130
Canola oil RP-HPLC/ESI-MS2, MS3,
RP-HPLC/APCI-MS
90
Castor Oil LC/ESI-MS, LC/ESI-MS2,LC/ESI-MS3 131
Coffee Beans (Coffea canephora P.) LC/ESI-MS2, GC-FID, HPLC-PDA 105
Corn oil LC/ESI-MS 132
Interesterified palm oil On-line Ag-HPLC/ESI-MS, Ag-HPLC-FID, Ag- SPE-SFC-FID
104
Malaysian cocoa butter LC/ESI-MS2, HPLC-PDA 133
Olive oil ESI-MS2 and MS3 of lithiated adducts 134
Ouricuri oil HPLC-ESI/ MS2, HPLC-ELSD 135
Pequi (Caryocar brasiliensis Camb.) oil LC/ESI-MS, LC/ESI-MS2, GC-MS, HPLC-ELSD 106
Rapeseed, butter oil LC/ESI-MS2, GC-FID, HPLC-ELSD 136
Tuna, microalgal, microbial micelia Chiral-phase HPLC/ESI-MS 103 Mouse liver, white adipose tissue RP high resolution LC/ESI-QTOF MS/MS 137
Butterfat NP-HPLC/ESI-MS2 138
Animal ganglia lipids ESI-MS 139
Archaeological samples High resolution nanoESI, FT-ICR MS, IRMPD MS/MS
140
Cell lipids from mice tumor ESI-MS,ESI-MS2,ESI-MS3 141
Molecular species ESI-MS,ESI-MS2 142
TAG mixtures CAD-MS2, ESI-MS2 143
Synthetic TAG mixtures (NARP)-HPLC/ESI-MS2 144
Synthetic short-chain TAGs LC/ESI-MS, MS2 , 1H NMR 145
TAG isomer mixtures ESI-MS2, ESI-MS3 146
Abbreviations: SFC: Supercritical fluid chromatography; RP: Reversed-phase; NARP: Non-aqueous reversed-phase; IRMPD: Infrared multiphoton dissociation; FID: Flame ionization detector; ELSD: Evaporative light scattering detector; FTICR: Fourier-transform ion cyclotron resonance; PDA: Photodiode array detector; SPE: Solid phase extraction; CAD: collisionally activated dissociation.
Since the first report of the application of RP-HPLC coupled to APCI-MS in the analysis of TAG standards mixture by Byrdwell and Edward 101, APCI-MS has been used in TAG analysis of various oils until now, as can be seen from Table 1.5. However, most of the studies are mainly concerned with plant oils, representing 67.9 % of the total number of references.
APCI-MS has exhibited significant advantages for TAG analysis in different matrices: 1) compatibility with non-polar solvents, facilitating the TAG analysis; 2) capability of producing mostly protonated molecules and DAG fragments; 3) enabling the differentiation of positional isomers through the evaluation of the relative abundance ratios of DAG fragments. However, the
18
identification of relatively saturated TAG species could be difficult, since APCI does not produce significant abundance of protonated molecules 147.
Analysis of TAG by ESI-MS was first introduced by Duffin et al. 76 for the analysis of mixtures containing MAG, DAG, and TAG dissolved in chloroform:methanol (70:30, v:v) with ammonium acetate or sodium acetate as the modifiers by direct infusion into the ESI interface. Several years later this technique for analysis of TAG became widespread. As is observed from Table 1.5, the majority of the investigations have been focused on the analysis of TAG from various plant oils, where only one study is concerned with marine oil, and 40.9 % of the studies applied the direct infusion of TAG into the ESI-MS without coupling to HPLC.
ESI-MS offers an excellent strategy for the analysis of high molecular weight compounds and an efficient interface for liquid chromatography. Although single ESI-MS derived spectra only contain quasimolecular ions with no fragmentation, the introduction of tandem ESI-MS (usually referred as ESI-MS2) can satisfactorily solve this problem, since ESI-MS2 derived spectra of TAG are mainly characterized by the presence of simple yet abundant DAG fragments from precursor ions. Moreover, studies shows that differentiation can be achieved between sn-2 and
sn-1 or sn-3 fatty acyl groups based on the relative intensities of DAG fragments, which provides
valuable information for the structural characterization of TAG 144, 146. Therefore, it is worth exploring the potential of ESI-MS2 for the analysis of TAG in marine oils.
1.5 Chemometric techniques
1.5.1 Multivariate analysis
Multivariate analysis is the term used to describe the analysis of data where numerous observations or variables are obtained for each object studied 148. It is used for a number of distinct and different purposes which are divided into three main groups, i.e., description (explorative data structure modeling), discrimination and classification, and regression and prediction. The commonly employed multivariate techniques include principal component analysis (PCA), partial least squares (PLS) and soft independent modeling of class analogy (SIMCA) 149. In the present thesis, emphasis is placed on PCA for “discrimination and classification” of various dietary oils.
19
PCA is a well-documented multivariate method for reducing the dimensionality of a data set by rotating and constructing orthogonal linear combinations of the original variables and projecting the maximum variability onto new axis also known as principal components (PCs). Each PC can be considered as a new variable that represents some underlying feature of the data. The first PC is the major axis of the points in the p-dimensional space that accounts for maximum amount of variance in the data. The second PC is perpendicular to the first PC and it defines the next largest amount of variation accounts, and so on. Once obtained, the PCs can be graphically plotted in order to distinguish and classify different samples.
1.5.2 Chemometric applications in liquid chromatography-mass
spectrometry
Liquid chromatography-mass spectrometry (LC-MS) employing ESI or APCI ionization techniques is a powerful analytical tool for the specific detection and potential identification of compounds in complex mixtures. However, analysts often encounter several problems when analyzing LC-MS data. First, the amount of data obtained from LC-MS has increased a lot over the years as a result of instrumental developments and applications dealing with increasingly complex multi-component samples and matrices. Interpretation of large data sets has thus become a formidable challenge. Second, the combination of LC with MS, particularly using ESI as an ionization method, can result in chromatograms and mass spectra with a high level of background and noise, which comes from a number of sources, such as the LC mobile phase and buffers 150. The contributions of solvent and background will often dominate the chromatogram. As a consequence of this, the resulting total ion chromatograms do not exhibit a clear separation of the mixture sample. Even though great improvements have been made in the instrumentation, the output signals still contain a great deal of noise embedding the useful information together with false peaks and spikes 151. Due to the above mentioned problems, the data interpretation is actually much more time-consuming than the data acquisition and has thus become a bottleneck in LC-MS method development and analysis.
Currently, several chemometric techniques are available to assist the data analysis generated from LC-MS, which are mainly focused on the preprocessing of data, such as reducing the noise and background in the data, improving the signal to noise ratio (S/N), extracting high quality
20
chromatograms, etc. Singular value decomposition (SVD) is a commonly used data reduction algorithm to improve the S/N in the LC-MS data 152. Sequential paired covariance (SPC), higher order-sequential paired covariance (HO-SPC), windowed mass selection method (WMSM), and component detection algorithm (CODA) are the chemometric methods developed specifically for chromatography/MS data 153.
The algorithm of SPC performs an un-scaled, un-normalized correlation between two adjacent mass spectra by multiplying their intensities together mass by mass. If the adjacent spectra have common features, it will lead to large intensities of these scanning points, whereas the noise will be suppressed by the operation as it is un-correlated between neighboring spectra 154. SPC has been applied to LC-MS data obtained on a triple quadrupole instrument. It was demonstrated that application of SPC on the data enhances the resolution of the eluting peaks of a complex peptide mixture and the S/N ratio of both chromatographic peaks and mass spectra 155. HO-SPC is one of the variations of SPC, in which the intensities of more than two mass spectra are multiplied together at a time. It is shown to be useful in eliminating coincidental noise in sequential mass spectra, giving the potential to extract broad, low intensity analyte peaks 155.
WMSM is an extension of the HO-SPC algorithm that removes random and high background noise based on the assumption that analytes can be distinguished from noise by means of differences in peak width 153. It consists of two steps: 1) random noise is eliminated by choosing a time window which corresponds to the analyte peak width. The ion that has a non-zero signal over the length of the window is retained. The random noises that displays zero intensities intermittently will be eliminated since a zero signal will be produced by multiplication of ion intensities at a particular m/z value over a series of scans; 2) the high background caused by the mobile phase and column bleed is removed by setting a much larger window size than the maximum expected elution time of an analyte ion. The ion that has a consistent signal over a long period results from a high background and thus eliminated. WMSM has been shown to be useful in eliminating random noise and improving S/N in both chromatographic and mass spectra profiles 153.
CODA was specifically developed for LC-MS data in order to reduce random noise and high background by selecting only high-quality (low noise and background) chromatograms from complex LC-MS data quickly 150, 156, which has demonstrated to be effective in the analysis of
21
LC-MS data from urine samples, human serum and peptides 83, 153, 157. CODA is based on two factors:1) background mass chromatograms will have a high mean value compared to good mass chromatograms; 2) noisy, spiky mass chromatograms will be more affected by smoothing than good mass chromatograms. Consequently, by calculating a similarity coefficient (so-called mass chromatographic quality, MCQ) between the original and mean centered chromatogram for each mass chromatogram, the algorithm will distinguish spiky chromatograms and solvent chromatograms from the mass chromatograms of potential components. The spiky and solvent chromatograms will be easily eliminated by selecting peaks with a high similarity coefficient thus significantly increasing the productivity in the LC-MS data.
Briefly, the process of CODA consists of the calculation of the similarity index by the following equation: 1 1
1
a( ) a( , )
r w j ij ij ic
w s
r
w
(1.1)Where cj is the similarity index (also referred as MCQ) for jth mass chromatogram, i.e., mass
chromatographic quality value, r is the number of rows (scans) in the original dataset, w is the width of a rectangular smoothing window, a(λ)ij stands for an element of data matrix at time
point i and mass channel j, a(w, s)ij represents the data matrix which is first smoothed with a
window w and then standardized.
The MCQ in Eq. (1.1) is calculated for each mass chromatogram. A high similarity index indicates that the mass chromatogram in question contains information of eluting components, while a low similarity index shows that any signal at this mass might be due to the noise or background. By specifying a MCQ threshold (between 0 and 1), the high-quality mass chromatograms will be retained by selecting the mass chromatograms with MCQ values higher than the defined threshold, while other mass chromatograms with lower MCQ values will be discarded.
WMSM and CODA are optimal tools for LC-MS data analysis. The former is more suitable for mass chromatograms with frequent and high intensity noise peaks, and the latter performs well for data with high background signal 153.
22
1.6 Aims of the study
The main objectives of the present study are:
1. To assess the potential of GC for discriminating ω-3 fatty acids rich oils derived from marine animals (cod liver, salmon, seal and whale) of different species, brands and grades by using three different data analysis strategies based on fatty acid methyl esters (FAME) profiles and PCA.
2. To fingerprint and discriminate marine oils based on their total ion chromatogram (TIC) and mass spectral profiles derived from LC-ESI-MS and LC-ESI-MS2 experiments by using chemometric tools including CODA and PCA.
3. To establish a reliable LC-ESI-MS2 strategy for the detection and characterization of TAG species from cod liver oil and develop a computational algorithm for the rapid and automatic interpretation of TAG species based on their structural features and mass spectral behaviour. The well-established lipase method is used to confirm the results of the proposed LC-ESI-MS2 approach.
23
2 Discrimination study based on fatty acids composition
2.1 Background
Dietary oils authenticity has become a focal point attracting the attention of producers, consumers, and policy makers. In particular, the need for quality assessment of marine oils has been intensified due to the emerging bodies of evidence supporting their roles in counteracting inflammatory processes in various parts of the body4, 5, 158, 159, decreasing the concentrations of harmful cholesterol 14, 19, preventing the formation of blood clots and fatty deposits on the arterial walls in people with coronary heart disease 160, 161, etc. These health benefits are ascribed to the high content of ω-3 fatty acids in marine oils such as EPA and DHA.
Marine oils as well as their by-products have been used as the important sources of ω-3 fatty acids for humans in the form of food ingredients, dietary supplements and medicines, etc. For example, microencapsulated fish oil has been introduced for enrichment of foodstuff including bread, infant formulas, baby food, soups, and prepared food, such as pizza 87. Adulteration of these products involves the deliberate or accidental addition of adulterants, i.e., cheaper oils including various animal fats and plant oils: mutton, beef, pork, chicken, lard and soy, linseed, rapeseed oil, etc 79. The importance of developing techniques for detecting adulteration of marine oils can be traced back to the late 19th and early 20th century, when a great scarcity of cod liver oil accompanied by famine prices of the market brought about adulteration of genuine cod liver oil with low-grade shark oil 6, 7. Nowadays, these products carry a premium price into the market which brings out the serious problems of adulteration in the trade of those products. Besides, the quality of these products depends on the origin and quality of raw materials as well as the extraction process, subsequent purification and storage conditions. As a consequence, it is of vital importance to establish a feasible approach for the quality assessment of ω-3 fatty acids rich marine oil.
The literature overview of the different instrumental techniques used for the analysis of plant, fish and marine mammal oils shown in Table 1.4 indicates that dietary oils discrimination are
24
mainly based on fatty acids composition through GC and GC-MS. However, the current studies have been mainly focused on plant oils, while the studies on fish and marine mammal oils constitute a meagre 3 % of the total number of references. It is surprising, that the potentiality of less complex techniques such as GC has not been explored yet in the discrimination of nutritionally important marine oils by using the conventional FAME profiles.
Considering that discrimination studies of ω-3 fatty acids rich oils derived from fish and marine mammals have not been previously reported, in the present thesis, the capability of GC analysis for discriminating marine oils of different species, brands and grades was assessed for authentication purposes by using the FAME profiles and PCA. The GC FAME profiles from plant oils such as rapeseed, linseed and soy oils and seven different brands of ω-3 supplements were also used in the discrimination process. The discrimination between and within animal oils was studied by using three different data analysis strategies: 1) the analysis of the full FAME profiles from plant, supplement and animal oils; 2) the analysis of selected FAME profiles from plant, supplement and animal oils with levels higher than 0.5 % of the total composition; 3) the analysis of the full FAME profiles from animal oils.
2.2 Experimental
2.2.1 Reagents and samples
Sodium hydroxide, hexane, methanol, boron trifluoride in methanol (20 % w/v) and chloroform were purchased from Merck (Darmstadt, Germany). Butylated hydroxytoluene (BHT) and boron trichloride in methanol (14 %) were purchased from Sigma-Aldrich Co. USA. FAME standards were purchased from Nu-Chek Prep (Elysian, MN), the nonadecanoic acid methyl ester (C19:0)
internal standard was from Fluka (Buchs, Switzerland). De-ionized water was purified in a Milli-Q system (Milli-Milli-Q system Millipore, Milford, MA). The fish oils were cod liver oil from Peter Möller, Lysaker, Norway and salmon oil from Havnegater, Sortland, Norway. The two brands of harp seal oils (Phagophilus groenlandicus) were from Rieber Skinn A/S, Bergen, Norway (two refined samples from different batches, designated as RSA1 and RSA2, and one crude sample designated as CSA were provided) and from JFM Sunile A/S, Os, Norway (one refined sample designated as RSB was provided). Whale oil (Balaenoptera acutorostrata) conventionally (WC)
25
and molecularly (WM) distilled were from Myklebust Trading AS, Myklebost, Norway. The plant oils analysed were soy oil (Mills DA, Sofienberg, Norway), linseed and rapeseed oils (Kinsarvik Naturkost, Bergen, Norway). The seven commercial ω-3 supplements obtained from a local pharmacy were Fri Flyt (Vesterålens Naturprodukter AS, Sortland, Norway), Natur-Omega (Naturhuset AS, Vøyenenga, Norway) Møllers dobbel (Peter Möller, Lysaker, Norway), Pikasol (Axellus A/S, Oslo, Norway) Omega-3 Forte (Vitamed, Sarpsborg, Norway), Omega-3 høykonsentrert (Sunkost, Oslo, Norway), El Dorado (Probio Nutraceuticals, Tromsø, Norway). The supplements were designated as K1, K2, K3, K4, K5, K6 and K7 respectively.
2.2.2 Fatty acid methyl esters preparation
The FAME preparation protocol has been published elsewhere 162. Briefly, 50 mg of sample are mixed with 2 ml BF3/CH3OH and 5 mg of C19:0 internal standard. The mixture is heated at 100
°C for 1 h and cooled down to room temperature. Aliquots of 1 ml of hexane and 2 ml of H2O
are added, vortex-mixed for 15 seconds, placed in a centrifuge at 3000 rpm for 2 min and the FAME are then extracted from the upper hexane phase. Depending on the fat content the sample is either concentrated under nitrogen or diluted with hexane and subsequently subjected to GC analysis.
2.2.3 Gas chromatography instrumentation
Analysis of the FAME was performed on a Perkin-Elmer AutoSystem XL gas chromatograph (Perkin-Elmer, Norwalk, Connecticut) equipped with a liquid autosampler and a flame ionisation detector. The FAME samples were analysed on a CP-Sil 88 capillary column (50 m × 0.32 mm I.D. 0.2 μm film thickness, Varian, Courtaboeuf, France). Data collection was performed by the Perkin-Elmer TotalChrom Data System software version 6.3. The temperature program was as follows: the oven temperature was held at 60 °C for 1 min, ramped to 160 °C at 25 °C /min, held at 160 °C for 28 min, ramped to 190 °C at 25 °C /min, held at 190 °C for 17 min, ramped to 220 °C at 25 °C /min and finally held at 220 °C for 10 min. Direct on-column injection was used. The injector port temperature was ramped instantaneously from 50 to 250 °C and the detector temperature was 250 °C. The carrier gas was ultra-pure helium at a pressure of 82 KPa. The analysis time was 60 min. This time interval was sufficient to detect FAME with chains from 10
26
to 24 carbons in length. The FAME peaks were identified by comparison of their retention times with the retention times of highly purified FAME standards.
2.2.4 Principal component analysis
Multivariate data analysis has been extensively used in oil discrimination. For instance, 66 % of the total number of articles reported in Table 1.4 used multivariate approaches of some sort, while 43 % used PCA. The data was normalized by using internal standards. Two-dimensional PCA score plots were created on the normalized data in order to reduce the number of variables and eliminate the redundancy of information. The PCA score and loading plots of the FAME profiles from the various oils were computed with the software package Statgraphics Plus 5.1 (Statistical Graphics Corp.).
2.3 Results and discussion
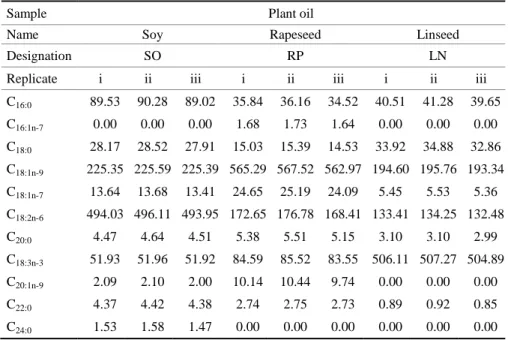
The plant, fish, marine mammals oils were analyzed in triplicate and the ω-3 supplements in duplicate. The triplicate and duplicate lipid profiles of the various injected oil samples, expressed as mg-FAME/g-sample, are presented in Tables 2.1-2.4.
Table 2.1: FAME concentrations (mg/g) for different plant oils
Sample Plant oil
Name Soy Rapeseed Linseed
Designation SO RP LN
Replicate i ii iii i ii iii i ii iii
C16:0 89.53 90.28 89.02 35.84 36.16 34.52 40.51 41.28 39.65 C16:1n-7 0.00 0.00 0.00 1.68 1.73 1.64 0.00 0.00 0.00 C18:0 28.17 28.52 27.91 15.03 15.39 14.53 33.92 34.88 32.86 C18:1n-9 225.35 225.59 225.39 565.29 567.52 562.97 194.60 195.76 193.34 C18:1n-7 13.64 13.68 13.41 24.65 25.19 24.09 5.45 5.53 5.36 C18:2n-6 494.03 496.11 493.95 172.65 176.78 168.41 133.41 134.25 132.48 C20:0 4.47 4.64 4.51 5.38 5.51 5.15 3.10 3.10 2.99 C18:3n-3 51.93 51.96 51.92 84.59 85.52 83.55 506.11 507.27 504.89 C20:1n-9 2.09 2.10 2.00 10.14 10.44 9.74 0.00 0.00 0.00 C22:0 4.37 4.42 4.38 2.74 2.75 2.73 0.89 0.92 0.85 C24:0 1.53 1.58 1.47 0.00 0.00 0.00 0.00 0.00 0.00
27
Table 2.2: FAME concentrations (mg/g) for different brands and grades of seal oil
Sample Seal oil
Manufacturer A B
Quality Crude Refined Refined
Designation CSA RSA1 (batch 1) RSA2 (batch 2) RSB
Replicate i ii iii i ii iii i ii iii i ii iii
C14:0 42.80 44.34 41.46 42.15 42.49 41.61 45.37 45.89 45.86 40.17 40.31 40.14 C14:1n-9 6.33 6.67 6.19 6.94 7.08 6.59 7.10 7.25 6.99 5.96 6.03 5.99 C15:0 2.51 2.71 2.51 2.64 2.65 2.43 2.79 2.91 2.77 2.84 2.87 2.85 C16:0 72.84 75.50 70.39 69.57 70.41 68.52 66.17 66.72 65.92 75.48 75.75 75.32 C16:1n-9 3.54 3.77 3.50 4.25 4.29 4.02 3.82 3.88 3.86 4.59 4.79 4.49 C16:1n-7 143.46 148.59 138.54 149.93 151.00 148.66 155.90 157.14 155.66 147.83 148.27 147.49 C17:0 0.50 0.54 0.49 0.38 0.39 0.37 0.67 0.70 0.65 1.66 1.73 1.68 C16:2n-4 6.50 6.81 6.39 5.70 5.81 5.39 5.66 5.69 5.65 4.59 4.66 4.62 C18:0 10.52 10.77 10.08 9.96 10.04 9.67 8.41 8.82 8.51 12.21 12.59 11.93 C16:3n-3 2.39 2.57 2.37 2.01 2.09 1.96 2.01 2.12 1.97 1.56 1.58 1.55 C18:1n-11 30.22 32.00 29.64 39.88 41.28 38.29 39.73 40.46 39.14 44.81 45.09 44.73 C18:1n-9 157.99 163.52 152.27 153.14 156.24 149.84 149.57 150.11 149.13 152.61 153.30 152.00 C18:1n-7 38.25 38.38 38.20 38.50 38.59 38.21 35.47 35.85 35.18 42.35 42.66 42.45 C16:4n-3 4.33 4.51 4.20 2.99 3.00 2.78 3.82 3.98 3.75 3.40 3.56 3.35 C18:2n-6 17.54 17.84 16.44 16.52 16.67 16.56 18.02 18.23 17.93 15.43 15.84 15.14 C20:0 0.31 0.32 0.30 0.00 0.00 0.00 0.00 0.00 0.00 0.00 0.00 0.00 C18:3n-3 4.99 5.11 4.73 4.55 4.71 4.45 4.97 5.04 4.95 4.49 4.66 4.38 C20:1n-11 17.18 17.77 16.38 21.00 21.84 20.17 18.88 19.37 18.79 25.84 26.03 25.75 C20:1n-9 85.17 89.05 81.09 85.46 86.42 84.43 70.51 72.27 69.76 99.62 100.33 99.91 C20:1n-7 5.37 5.53 5.01 5.16 5.26 5.06 4.23 4.41 4.15 6.20 6.46 6.00 C18:4n-3 12.96 13.32 12.40 11.55 12.03 10.88 12.44 13.02 12.86 9.27 9.37 9.27 C20:2n-6 1.69 1.75 1.63 1.73 1.83 1.71 1.60 1.63 1.59 2.08 2.06 2.00 C20:4n-6 4.91 5.10 4.71 4.24 4.50 4.19 4.85 4.96 4.84 3.60 3.65 3.45 C22:1n-11 18.89 19.50 18.24 19.73 20.51 18.76 17.24 17.60 17.09 23.47 23.64 23.20 C22:1n-9 4.67 4.66 4.23 4.73 4.83 4.42 3.98 4.07 3.97 6.10 6.23 5.88 C20:4n-3 4.53 4.64 4.21 4.25 4.26 4.04 4.60 4.65 4.63 3.83 3.87 3.80 C20:5n-3 67.19 70.68 65.71 61.25 64.45 58.24 64.54 64.93 64.26 53.66 54.82 53.51 C24:1n-9 4.68 4.77 4.39 4.84 4.94 4.55 5.01 5.14 4.98 4.26 4.31 4.25 C22:5n-3 38.06 40.32 37.20 38.58 39.95 37.01 38.14 38.47 37.90 36.63 36.84 36.51 C22:6n-3 82.69 86.38 78.61 76.78 81.50 74.05 88.21 90.58 86.85 57.45 58.32 57.58
28
Table 2.3: FAME concentrations (mg/g) for whale (different grades) and fish (different species) oils
Sample Whale oil Fish oil
Quality Conventionally distilled Molecularly distilled Cod liver Salmon
Designation WC WM CL SA
Replicate i ii iii i ii iii i ii iii i ii iii
C14:0 50.54 50.59 50.40 47.82 48.10 47.52 33.67 33.64 33.59 41.05 41.83 40.47 C14:1n-9 3.89 3.82 3.86 3.45 3.71 3.40 0.00 0.00 0.00 0.00 0.00 0.00 C15:0 3.43 3.47 3.29 3.61 3.68 3.33 3.11 3.17 3.01 3.85 3.90 3.76 C16:0 74.45 75.18 72.73 95.29 95.76 94.62 91.89 92.61 90.97 130.47 133.40 127.50 C16:1n-9 3.22 3.24 3.09 3.54 3.57 3.53 4.33 4.59 4.25 2.81 2.87 2.63 C16:1n-7 74.00 75.19 71.81 65.05 65.70 64.60 60.69 62.80 58.56 39.62 39.94 39.09 C17:0 4.93 5.01 4.84 3.74 3.99 3.68 5.77 5.79 5.65 2.66 2.76 2.54 C16:2n-4 3.55 3.56 3.46 2.75 2.95 2.75 4.21 4.29 3.98 3.73 3.88 3.69 C18:0 16.35 16.07 15.62 23.54 23.91 23.38 18.47 19.08 17.75 30.53 31.41 29.78 C16:3n-3 0.00 0.00 0.00 0.00 0.00 0.00 3.38 3.39 3.37 1.93 1.99 1.84 C18:1n-11 18.23 18.02 17.44 19.67 19.76 19.38 13.63 13.66 13.56 3.89 4.00 3.76 C18:1n-9 147.00 147.26 146.13 136.56 137.06 135.87 122.70 123.80 121.41 242.10 243.16 240.88 C18:1n-7 21.36 21.33 20.90 25.54 25.59 25.30 34.87 35.05 34.52 29.48 30.15 28.61 C16:4n-3 2.55 2.57 2.45 0.00 0.00 0.00 4.61 4.69 4.33 3.22 3.33 3.04 C18:2n-6 19.44 19.66 19.19 17.39 17.63 16.95 18.47 18.50 18.42 81.37 82.28 80.39 C20:0 0.50 0.51 0.48 0.66 0.68 0.64 0.00 0.00 0.00 1.83 1.90 1.74 C18:3n-3 12.58 12.71 12.35 10.91 11.09 10.71 7.78 7.83 7.54 30.43 31.01 29.92 C20:1n-11 20.94 21.58 20.21 21.66 21.76 21.36 10.17 10.25 10.04 4.63 4.76 4.59 C20:1n-9 96.94 98.11 94.76 128.41 129.07 127.55 77.90 78.18 77.74 43.11 43.46 42.69 C20:1n-7 2.09 2.06 2.03 2.65 2.82 2.68 3.24 3.28 3.15 2.53 2.70 2.44 C18:4n-3 27.59 27.88 26.30 19.38 19.84 18.72 24.49 25.05 23.73 9.17 9.25 8.78 C20:2n-6 2.97 3.05 2.84 3.47 3.55 3.37 2.57 2.61 2.48 6.88 7.10 6.64 C20:3n-6 0.00 0.00 0.00 0.00 0.00 0.00 0.00 0.00 0.00 1.60 1.67 1.51 C22:0 0.00 0.00 0.00 0.00 0.00 0.00 0.00 0.00 0.00 1.72 1.79 1.67 C20:3n-3 0.00 0.00 0.00 0.00 0.00 0.00 0.00 0.00 0.00 3.25 3.39 3.15 C20:4n-6 3.76 3.91 3.58 2.79 2.99 2.80 6.52 6.53 6.50 3.40 3.64 3.37 C22:1n-11 94.43 96.59 91.27 120.77 122.09 119.38 49.95 50.00 49.88 39.23 39.90 38.76 C22:1n-9 6.98 7.07 6.69 10.53 10.92 10.11 6.02 6.14 5.88 7.46 7.86 7.26 C20:4n-3 14.09 14.13 13.95 11.14 11.34 10.74 7.97 7.99 7.88 10.74 11.35 10.32 C20:5n-3 46.45 47.18 45.32 35.12 36.14 33.90 106.67 108.09 105.05 39.12 40.69 37.72 C24:0 0.00 0.00 0.00 0.00 0.00 0.00 1.72 1.78 1.64 0.00 0.00 0.00 C24:1n-9 6.94 7.06 6.80 6.48 6.95 6.41 7.91 7.91 7.87 8.11 8.40 7.77 C22:5n-3 22.99 23.02 22.86 20.51 21.07 20.34 16.39 16.58 15.99 21.87 22.35 21.28 C22:6n-3 76.72 76.31 75.14 48.30 50.72 47.27 145.64 149.56 141.24 52.29 54.01 50.37