European lobster (Homarus gammarus) larvae under an
acidification scenario: addressing biochemical, development and
behaviour responses
Lénia da Fonseca Alexandre Rato
European lobster (Homarus gammarus) larvae under an
acidification scenario: addressing biochemical, development and
behaviour responses
Lénia da Fonseca Alexandre Rato
A thesis submitted to the School of Tourism and Maritime Technology, Polytechnic Institute of Leiria as partial fulfilment for the requirements for the Master Degree of Science in Aquaculture, held under the scientific supervision of Professor Sérgio Miguel Martins Leandro Franco (School of Tourism and Maritime Technology, Polytechnic Institute of Leiria) and co-supervision of Professor Marco Filipe Loureiro Lemos (School of Tourism and Maritime Technology, Polytechnic Institute of Leiria) and Doctor Sara Calçada Novais (MARE, Polytechnic Institute of Leiria).
iii
Title: European lobster (Homarus gammarus) larvae under an acidification scenario: addressing biochemical, development and behaviour responses
Copyright © Lénia da Fonseca Alexandre Rato
The School of Tourism and Maritime Technology and the Polytechnic Institute of Leiria are entitled, perpetually and without geographical boundaries, to archive and publish this work through printed copies reproduced on paper or digital form or by any other known means or to be invented, and to disseminate through scientific repositories and admit copying and distributing to educational purposes or research, non-commercial, as long as credit is given to the author and publisher.
iv
“Onde há um safio, há um lavagante.”
v
AGRADECIMENTOS
Ao longo deste período de trabalho muitas foram as pessoas que contribuíram, de uma forma ou de outra, para esta etapa final. Deixo-lhes o meu reconhecimento.
Gostaria de agradecer ao meu orientador, o Professor Doutor Sérgio Leandro, pelo acompanhamento durante o processo, por me ter disponibilizado todos os recursos possíveis e imaginários para a concretização desta tese e pelos valiosos conselhos.
Ao Professor Marco Lemos pelos debates científicos, brainstormings e motivação. Pelas palavras e ressalvas nos momentos certos. À Doutora Sara Novais pelos recursos, esclarecimentos, minúcia e paciência. Obrigada a ambos por terem aceitado o desafio.
Ao Luís Alves, por me guiar pelo mundo dos biomarcadores, pela transparência, pela disponibilidade, pelos dias inteiros em que troquei “L” por “µL”. À professora Susana Mendes, pelo apoio no tratamento de dados e ao João Chambel pelo apoio logístico.
Ao grupo de investigação e técnicos do MARE-IPLeira, Edifício Cetemares, pela amizade, pelos almoços da Tupperware, pelas vigílias noturnas à espera das posturas, por todos os pequenos e grandes momentos. Pelos dias menos bons e muito bons. Um agradecimento especial à Luana, Sofia, Carla, Guilherme, Inês, Simão, Rodrigo e Catarinas, pela panóplia de vivências e aprendizagens.
Aos viveiros Frutos do Mar pelo fornecimento ad libitum de fêmeas ovadas para os ensaios, à Frubaça por acreditarem no projeto e por nos terem disponibilizado material num contexto improvável e à Flying Sharks, por toda a disponibilidade demonstrada.
Por último, mas não menos importante, ao Edgar, Lurdes, Paulo e Pais por toda a estrutura e apoio, por acreditarem e por me acompanharem em todo o processo da melhor forma que souberam. Aos amigos por compreenderem as muitas ausências.
Ao Vicente, és o meu maior amor.
Tenho em mim a convicção de que somos a soma de momentos, marcos e sucessos de nós próprios e dos que nos rodeiam, que ninguém alcança o que quer que seja por si só. Muito obrigada a todos.
vii
RESUMO
A acidificação dos oceanos constitui uma problemática global e a realidade de que está, efetivamente, a acontecer não é uma consideração subjetiva. A Acidificação dos oceanos provocada por emissões de dióxido de carbono de origem antropogénica tem vindo a reduzir o pH das águas superficiais do Oceano e projeções preveem a continuidade deste processo. Embora muita investigação tenha sido desenvolvida no âmbito dos invertebrados que calcificam, tais como moluscos e crustáceos, poucos consideraram o estudo de efeitos ao nível sub-celular para avaliar stress oxidativo ou respostas funcionais do metabolismo energético em tais condições, interligando vários níveis de organização biológica.
O objetivo do presente estudo foi o de avaliar os efeitos da exposição a diferentes níveis-alvo de pCO2 (controlo: 370 µatm; aumentado: 710 µatm) e de pH (controlo: 8.15;
reduzido: 7.85) em parâmetros de crescimento bem como avaliar respostas comportamentais e bioquímicas relacionadas com stress oxidativo e metabolismo energético durante o desenvolvimento larvar de um crustáceo decápode. Este cenário de acidificação está de acordo com os RCPs previstos pelo Painel Intergovernamental para as Alterações Climáticas (IPCC, 2014) para o ano 2100.
Para o presente estudo, foi utilizado o crustáceo Homarus gammarus (L.) – sendo uma espécie com elevado valor comercial, que tem vindo a sofrer elevada pressão de pesca em águas Europeias. Fêmeas adultas provenientes da costa Atlântica Oeste Portuguesa foram obtidas de um retalhista local. Após a eclosão em ambiente laboratorial controlado, larvas provenientes da mesma progenitora foram expostas às condições acima descritas desde o momento da eclosão até à chegada ao Estádio III. A sobrevivência individual e ocorrência de ecdise foram avaliados individualmente de 12h em 12h. Réplicas de cada tratamento foram recolhidas em momentos específicos durante o Estádio I (primeiro estádio larvar) e Estádio III (último estádio larvar) para análise morfométrica e de crescimento (peso fresco e comprimento carapaça) e respostas bioquímicas. Os biomarcadores analisados incluíram parâmetros relacionados com stress oxidativo e danos (atividade da enzima superóxido dismutase (SOD), peroxidação lipídica (LPO) e danos no DNA) e metabolismo energético (atividade da cadeia transportadora de eletrões (ETS) e da enzima lactato desidrogenase (LDH) e quantificação de Hidratos de Carbono). Os resultados obtidos sugerem que a sobrevivência diminui e que o período inter-muda é afetado durante a exposição a cenários de acidificação. No que respeita aos parâmetros
viii
de crescimento/morfométricos, larvas do cenário de acidificação apresentam uma tendência para crescimento diminuído, menor peso e comprimento de carapaça. As análises bioquímicas realizadas indicam a ocorrência de stress oxidativo sob condições de acidificação. Respostas ao nível do metabolismo energético não variaram significativamente entre tratamentos. Os resultados apontam também para que fases larvares possam possuir um sistema antioxidante ainda em desenvolvimento, tornando-as mais suscetíveis ao stress oxidativo.
As fases larvares são uma fase vulnerável e crucial no ciclo de vida das espécies, influenciando o recrutamento e a renovação de stocks. Este estudo contribui para um melhor entendimento sobre a vulnerabilidade desta espécie num cenário de alterações climáticas – Acidificação dos oceanos – ao endereçar os mecanismos envolvidos nas respostas deste crustáceo a este agente causador de stress.
Palavras-chave: Acidificação dos oceanos; Biomarcadores bioquímicos; Desenvolvimento Larvar; Homarus gammarus; Metabolismo energético; Stress oxidativo.
ix
ABSTRACT
Ocean acidification is a worldwide concern and its existence is no longer a subjective consideration. Ocean acidification resulting from anthropogenic emissions of carbon dioxide has already reduced the surface ocean pH and future projections expect it will continue to do so. Although the main body of research has been developed essentially on calcifying invertebrates, such as molluscs and crustaceans, few have considered the study of sub-cellular effects to assess the occurrence of oxidative stress or alterations on the energetic metabolism under such conditions, integrating different levels of biological organization.
The focus of the present study was to evaluate the effects of exposure to different target pCO2 (control: 370µatm; increased: 710µatm) and pH levels (control: 8.15;
decreased: 7.85) on growth parameters and on behavioural and biochemical responses related with oxidative stress and energy metabolism during a decapod crustacean larval development. These exposure conditions are according with the RCPs predicted by the Intergovernmental Panel on Climate Change (IPCC, 2014) for the year 2100.
In the present study, the crustacean Homarus gammarus (L.) was used – as a highly valued commercial species that is facing high fishing pressure amongst European waters. Adult females were obtained from a local crustacean retailer that collected them from the Portuguese West Atlantic coast. After hatching in laboratorial controlled conditions, the larvae from the same female were exposed to the described conditions since hatching until reaching stage III. Individual survival and moulting patterns were evaluated every 12h. Replicates from each treatment were collected in specific moments at Stage I (first larval stage) and Stage III (last larval stage) for morphometric measurements (carapace length and wet weight) and biochemical biomarkers analysis. The measured biomarkers comprised endpoints related with oxidative stress and damage (superoxide dismutase activity (SOD), lipid peroxidation (LPO), and DNA damage), and with energy metabolism (Carbohydrates content and electron transport system (ETS) and lactate dehydrogenase (LDH) activities). The results suggest that survival decreases and inter-moult period is affected during the exposure to an acidification scenario. Also, concerning morphometric features, larvae from the acidified scenario tend to grow less and gain less weight. Biochemical biomarker analyses indicate the occurrence of oxidative stress under the acidified condition, whereas the energetic metabolism endpoints did not show alterations across experimental treatments. The results also indicate that early life stages may not yet
x
possess a fully developed antioxidant defence system, being particularly vulnerable to oxidative stress.
Larval phase is a vulnerable and crucial step in species life cycle, influencing recruitment and stock renovation. This study contributes to a better understanding of this species vulnerability under a climate change scenario – Ocean Acidification - while addressing the mechanisms involved in this crustacean response to this stressor.
Keywords: Biochemical Biomarkers; Energy metabolism; Homarus gammarus; Larval Development; Ocean Acidification; Oxidative stress.
xi
TABLE OF CONTENTS
Resumo ... vii
Abstract ... ix
List of Figures ... xiii
List of Tables ... xvii
List of Abbreviations ... xix
1. Introduction ... 1
1.1 Ocean acidification and seawater chemistry ... 1
1.2 Ocean acidification on marine organisms and ontogeny ... 4
1.3 Biochemical biomarkers ... 9
1.4 Biological model: Homarus gammarus ... 11
1.5 Larval rearing of Homarus gammarus ... 14
1.6 Thesis aim and objectives ... 16
2. Materials and Methods ...19
2.1 Broodstock husbandry ... 19
2.2 Experimental design ... 19
2.3 Determination of Behaviour and Development Responses: Survival, Inter-moult Period, Morphometric Analysis, and Growth ... 24
2.4 Determination of Biochemical Responses: Biochemical Biomarkers Analysis………..25
2.5 Statistical analysis ... 27
3. Results ...29
3.1 Behaviour and development responses: survival, inter-moult period, morphometric analysis and growth ... 29
3.2 Biochemical biomarkers responses: oxidative stress & energy metabolism ... 33
4. Discussion ...37
4.1 Overview ... 37
4.2 Behaviour and development responses: survival, inter-moult period, morphometric analysis and growth ... 37
4.3 Biochemical biomarkers responses: oxidative stress & energy metabolism ... 39
5. Conclusions and Future Perspectives ...43
xiii
LIST OF FIGURES
Figure 1.1 – Left: naturally occurring greenhouse gases—carbon dioxide (CO2), methane
(CH4), and nitrous oxide (N2O)—normally trap some of the sun’s heat, keeping the planet
from freezing; Right - human activities, such as the burning of fossil fuels, are increasing greenhouse gas levels, leading to an enhanced greenhouse effect. The result is global warming and unprecedented rates of climate change. Sourced by Will Elder, NPS: https://www.nps.gov/goga/learn/nature/climate-change-causes.htm...1
Figure 1.2 – Ocean acidification chemistry, displaying the chemical reactions that occur when CO2 is adsorbed in the marine environment and emphasizing the fact that extra H+
ions can react with carbonate ions and form more bicarbonate. National Research Council (2013)……….2
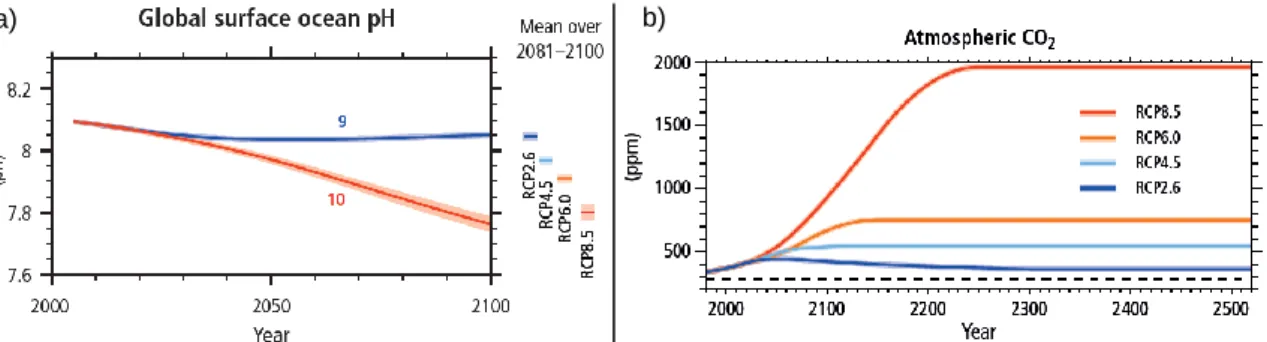
Figure 1.3 – a) Change in ocean surface pH. For all panels, time series of projections and a measure of uncertainty (shading) are shown for scenarios RCP2.6 (blue) and RCP8.5 (red). The number of CMIP5 models used to calculate the multi-model mean is indicated. The mean and associated uncertainties averaged over the 2081–2100 period are given for all RCP scenarios as coloured vertical bars on the right hand side; b) Atmospheric carbon dioxide (CO2) for the four Representative Concentration Pathways (RCPs) up to 2300
(relative to 1986–2005) followed by a constant (year 2300 level) radiative forcing. The dashed line indicates the pre-industrial CO2 concentration, from IPCC (2014)………..3
Figure 1.4 - The bottom panel compares the percentage of species sensitive to ocean acidification for corals, molluscs and crustaceans, vulnerable animal phyla with socio-economic relevance (e.g. for coastal protection and fisheries). The number of species analysed across studies is given on top of the bars for each category of elevated CO2. For
2100, RCP scenarios falling within each pCO2 category are as follows: RCP4.5 for 500 to
650 μatm, RCP6.0 for 651 to 850 μatm and RCP8.5 for 851 to 1370 μatm. By 2150, RCP8.5 falls within the 1371 to 2900 μatm category. The control category corresponds to 380 μatm (The unit μatm is approximately equivalent to ppm in the atmosphere), from IPCC (2014)....5
Figure 1.5 - Schematic of processes, energy flows and expenditures involved in organisms being able to survive, interacting with external factors that can also influence survival and the consequential impacts on the ecosystem state. Red full arrows indicate energy flows, dashed arrows represent potential energy trade-offs. Ocean acidification or other stressors
xiv
can cause shifts in the energy distribution within an organism, but could also impact on the external factors, such as food availability, predator–prey interactions, and behaviour (from Turley & Findlay, 2016)………6
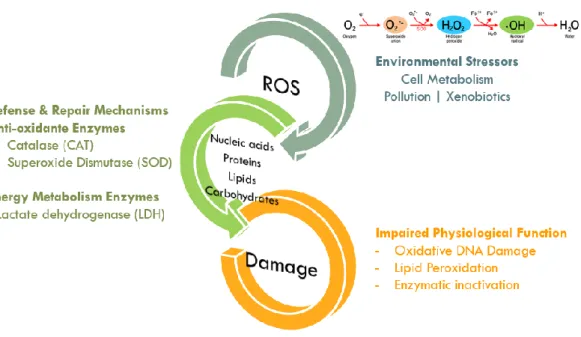
Figure 1.6 – Oxidative stress cascade. Reactive oxygen species, produced in the presence of environmental stress, activate the sub-cellular defence and repair mechanisms, which prevent the damage of nucleic acids, proteins, lipids and carbohydrates. Examples of damage caused by impaired physiological function are described……….10
Figure 1.7 - The relationship between different levels of biological complexity, ecological relevance and time of response related to an environmental change or chemical exposure (Lemos et al., 2010)………11
Figure 1.8 – Homarus gammarus’ geographical distribution (dark grey): ranging from Norway, along European and Mediterranean coasts and going until as far south as Morocco, FAO (2016)……….12
Figure 1.9 - Comparison of terminology for developmental stages and proposed ecological phases of the life history of clawed lobsters. Approximate sizes corresponding to moults are illustrated for Homarus. Vertical arrow indicates time of settlement, sourced from Cobb & Wahle (1994)………...13
Figure 1.10 - Larval stages of the decapod crustacean Homarus gammarus………14
Figure 2.1 – Experimental setup: a) Scheme of the designed RAS, represent seawater inflow, represent seawater outflow and the CO2 injection set-up; b) Real image of
the system set-up; c) close-up on one of the rearing tank and individual rearing experimental units………..21
Figure 2.2 – Scheme of the sampling design, addressed endpoints and used life stage in the experiments………..23
Fig. 2.3 – Relation between OD and concentration for the cryptophyte Rhodomonas lens in Cetemares building considering an absorbance at 445nm. µ.day-1 = 0,364, duplication time
xv
Figure 3.1 – Cumulative survival of larvae of Homarus gammarus reared under control and ocean acidification scenarios (Mean ± S.D., N=46) during 11 days until 48h after reaching larval stage III Grey line indicates Control scenario and black line indicates Acidification scenario. “+” in the end of each line represents censured data, where the remaining larvae ceased to be monitored.………..………..29
Figure 3.2 – Survival in % from previous stage of larvae of Homarus gammarus reared under control and ocean acidification scenarios. White bars indicate Control scenario and dotted bars indicate Acidification scenario………..30
Figure 3.3 – Inter-moult Period of larvae of Homarus gammarus reared under control and ocean acidification scenarios (Mean ± S.D.): SI-SII (Ncontrol= 43; Nacid = 39) and SII-SIII
(Ncontrol= 36; Nacid = 29). Striped bar indicate Control scenario and dotted bars indicate
Acidification scenario. * Indicate significant differences between scenarios in each inter-moult Period (Independent Samples T-test, p-value ≤ 0.05)………..30
Figure 3.4 – Wet weight gain of larvae of Homarus gammarus reared under control and ocean acidification scenarios (Mean ± S.D.): Newborn (N=48), Stage I (N=24) - 24h after exposure - and Stage III (N=18), 48h after moulting and with the same exposure time. Striped bar indicates Basal scenario, white bars indicate Control scenario and dotted bars indicate Acidification scenario………...32
Figure 3.5 – Carapace length of larvae of Homarus gammarus reared under control and ocean acidification scenarios (Mean ± S.D.): Newborn (N=48), Stage I (N=24) - 24h after exposure - and Stage III (N=18) after moulting and with the same exposure time. Striped bar indicates Basal scenario, white bars indicate Control scenario and dotted bars indicate Acidification scenario. * Indicate significant differences between scenarios in each inter-moult Period (Independent Samples T-test, p-value ≤ 0.05)………..33
Figure 3.6 – Oxidative stress responses of Homarus gammarus larvae reared under control and ocean acidification scenarios (Mean ± S.D.): Newborn (N=16), Stage I (N=8) - 24h after exposure - and Stage III (N=9), 48h after moulting and with the same exposure time, (a) Superoxide dismutase (SOD) activity, (b) Lipid peroxidation (LPO) and (c) DNA damage levels. Striped bar indicates Basal scenario, white bars indicate Control scenario and dotted bars indicate Acidification scenario. * Indicate significant differences between scenarios in each inter-moult Period (Independent Samples T-test, p ≤ 0.05)………34
xvi
Figure 3.7 – Energy metabolism related responses of Homarus gammarus larvae reared under control and ocean acidification scenarios (Mean ± S.D.): Newborn (N=16), Stage I (N=8) - 24h after exposure - and Stage III (N=9), 48h after moulting and with the same exposure time, (a) Electron Transport System activity (ETS) activity, (b) Lactate dehydrogenase (LDH) activity and (c) Carbohydrates content (C) levels’ quantification. Striped bar indicates Basal scenario, white bars indicate Control scenario and dotted bars indicate Acidification scenario……….……….35
xvii
LIST OF TABLES
Table 1.1. Effects of elevated seawater CO2 on indices of growth and reproductive capacity
in a variety of crustacean species. pCO2: partial pressure of CO2 calculated from values
published as ppm (mole fraction). Dashes represent absence of available data (Whiteley, 2011)………...……7
Table 2.1. Water chemistry parameters over the course of the experimental period (Mean ± SD): temperature (°C), salinity, pH (NBS Scale) – measured in the experimental units, total alkalinity (AT, mg.L-1 CaCO3), carbon dioxide partial pressure (pCO2, μatm), pH (NBS
Scale), bicarbonate concentration ([HCO3-], μmol.kg-1), carbonate concentration ([CO 32-],
μmol.kg-1). Parameters calculated using CO2SYS program (Lewis and Wallace 1998) with
constants provided by Mehrbach et al. (1973) refitted by Dickson and Millero (1987) and KSO4 constants from Dickson (1990)………..22
Table 3.1. – Life history traits of Homarus gammarus throughout larval development under Control and Ocean Acidification scenarios (Means ± S.D.): Survival (cumulative % of initial number), inter-moult period (duration of the stage until moulting, days)……….31
xix
LIST OF ABBREVIATIONS
AM – After moulting AT – Total alkalinity CAT – Catalase CL- Carapace length CO2 – Carbon Dioxide CO32– - Carbonate ion CO2 (aq) - Dissolved CO2CT - Total Carbon = CO2 (aq) + HCO3– + CO32–.
DHA - Docosahexaenoic Acid DIC – Dissolved inorganic carbon DO – Dissolved Oxygen
DW – Dry Weight
EPA - Eicosapentaenoic Acid HCO3– - Bicarbonate ion
H2CO3 - Carbonic Acid
H2O2 – Peroxide Hydrogen
H2SO4 – Sulfuric Acid
IP – Inter-moult Period
IPCC – International Panel on Climate Change LDH – Lactate Dehydrogenase
NBS – National Bureau of Standards OA – Ocean Acidification
OD – Optic Density
pCO2 - Partial Pressure of Carbon Dioxide
PMS – Post-mitochondrial Supernatant PUFA - Polyunsaturated Fatty Acids
RCP - Representative Concentration Pathways ROS – Reactive Oxygen Species
SI – Stage I SII – Stage II SIII – Stage III
S.D. – Standard deviation SOD – Superoxide dismutase Ww – Wet weight
1
1. INTRODUCTION
1.1 Ocean acidification and seawater chemistry
Since the industrial revolution, anthropogenic gas emissions (namely CO2) have
shaped Earth’s climate (see Figure 1.1). Higher greenhouse gases emissions are related with increasing atmospheric temperatures (IPCC, 2014). This changes also have an impact in Oceans, where Sea Surface Temperature is expected to rise 3-5°C by the end of this century (Sokolov et al., 2009).
Figure 1.1 – Left: naturally occurring greenhouse gases—carbon dioxide (CO2), methane (CH4), and
nitrous oxide (N2O)—normally trap some of the sun’s heat, keeping the planet from freezing; Right -
human activities, such as the burning of fossil fuels, are increasing greenhouse gas levels, leading to an enhanced greenhouse effect. The result is global warming and unprecedented rates of climate change. Sourced by Will Elder, NPS: https://www.nps.gov/goga/learn/nature/climate-change-causes.htm
The changes named above will also impact marine ecosystems through multiple physical and chemical changes. Earth’s Oceans play a major role in the carbon cycle and are responsible by the uptake of ~48% of the atmospheric CO2 (Raven et al., 2005). It is
estimated that it had absorbed approximately 155 PgC from the atmosphere over the last two and a half centuries (Sabine et al., 2004; Khatiwala et al., 2013). This natural process of absorption has benefited humankind by significantly reducing the greenhouse gas levels in the atmosphere and abating some of the impacts of global warming. However, the ocean’s uptake of carbon dioxide is having a significant impact on the seawater chemistry, namely in the seawater carbonate system (Bolin & Eriksson, 1959; Zeebe & Wolf-Gladrow, 2001; Solomon et al., 2007; Feely et al., 2004; Fabry et al., 2008; Zeebe, 2012). When atmospheric CO2 exchanges across the air–sea interface, it reacts with seawater through a
2
series of four chemical reactions that increase the concentrations of carbon species: dissolved carbon dioxide (CO2 (aq)), carbonic acid (H2CO3) and bicarbonate (HCO3–)
Hydrogen ions (H+) are produced by these reactions. This increase of the ocean’s
hydrogen ion concentration results in a reduction in pH, meaning an increase in acidity. Under normal seawater conditions, more than 99.99% of the hydrogen ions that are produced will combine with carbonate ion (CO32–) to produce additional bicarbonate ions
(HCO3–). Thus, the addition of anthropogenic CO2 into the oceans lowers the pH and
consumes carbonate ion (see Figure 1.2). According to Feely et al. (2004) and Fabry et al.
(2008), H+ ions’ concentration increased 30% and carbonate ions’ concentration reduced
16% since the industrial revolution.
Figure 1.2 – Ocean acidification chemistry, displaying the chemical reactions that occur when CO2
is adsorbed in the marine environment and emphasizing the fact that extra H+ ions can react with
carbonate ions and form more bicarbonate. National Research Council (2013).
The average pH of ocean surface waters has already dropped by about 0.1 units, from about 8.2 to 8.1 (average, total scale), since the beginning of the industrial revolution (Orr et al., 2005a; Feely et al., 2009). Estimates of future atmospheric and oceanic carbon dioxide concentrations indicate that, by the end of this century, the average surface ocean pH may be the lowest since 50 million years ago (Caldeira & Wickett, 2003). Atmospheric and oceanic CO2 has been increasing from a 280 ppm baseline and is expect to continue
the same trend. Levels of pCO2 for 2100 were predicted to reach 1000ppm (Caldeira &
3
scenarios while it takes mitigation measures into account. The most extreme prediction consider a pCO2 of ~900ppm in 2100 (see Figure 1.3).
This changes in marine environmental chemistry may affect fundamental chemical processes of the sea in coming decades (Fabry et al., 2008; Doney et al., 2009), impact marine biota and have socioeconomic-policy implications (Bednaršek et al., 2014; Findlay
et al., 2014; Kelly et al., 2011; Orr et al., 2005; Paganini et al., 2014; Schmalenbach &
Buchholz., 2013; Turley & Gattuso, 2012).
Figure 1.3 – a) Change in ocean surface pH. For all panels, time series of projections and a measure of uncertainty (shading) are shown for scenarios RCP2.6 (blue) and RCP8.5 (red). The number of CMIP5 models used to calculate the multi-model mean is indicated. The mean and associated uncertainties averaged over the 2081–2100 period are given for all RCP scenarios as coloured vertical bars on the right hand side; b) Atmospheric carbon dioxide (CO2) for the four Representative
Concentration Pathways (RCPs) up to 2300 (relative to 1986–2005) followed by a constant (year 2300 level) radiative forcing. The dashed line indicates the pre-industrial CO2 concentration, from
IPCC (2014).
Experimental manipulations of CO2 concentrations in the field are difficult and limited
to a few locals where high CO2 naturally occurs or where large scale, costly, and labour
intensive experiments have been employed (Gattuso et al., 2010). Consequently, the most studies are conducted in the laboratory where CO2 concentrations can potentially be
controlled and reported accurately, and their effects isolated from those of other environmental variables. To successfully perform seawater manipulation, experimental treatments simulate future predicted CO2 levels in the Oceans while declining pH levels,
rising dissolved inorganic carbon content (DIC) and keeping total alkalinity (AT) constant
(Cornwall & Hurd, 2015).
b) a)
4
Ideally, experimental tanks must present sufficient flow-through rates since metabolic activity of organisms can modify seawater AT (Rost et al., 2008). To determine if
seawater has the desired properties, at least two components of the seawater carbonate system are measured: pH, AT, DIC or pCO2 (Cornwall & Hurd, 2015). This procedures have
been followed by the vast majority of published studies (e.g. Small et al., 2015; Small et al., 2016). In order to perform ocean acidification experiments, the design systems vary across studies but usually have common features: a mixing tank (where the CO2 in injected), a
header tank (where mixed seawater passes before being in contact with the organisms) and an experimental tank (where the exposure takes place), where the word “tanks” may assume other form besides typical aquaria (Cornwall & Hurd, 2015).
1.2 Ocean acidification on marine organisms and ontogeny
The predicted levels of CO2 for the end of the century are expected to affect
estuarine and coastal areas more than the open ocean (Lachkar, 2014) due to alkalinity specific traits and the upwelling of CO2-rich and O2-poor seawater (Cossarini et al., 2014),
while they are great productivity and biodiversity areas (Swearer et al., 1999) and considered the most productive in all Oceans’ extent (Denman & Powell, 1984).
A broad range of marine taxa show different responses facing ocean acidification, with some species negatively affected while other suffer no effect or are positively affected (an increase in cnidarians due to OA was presented by Attrill et al., 2007). The main body of research has been developed essentially on calcifying invertebrates, such as molluscs and negative effects occurred with extent gravity within that phylum (see Figure 1.4). Ocean acidification has the potential to affect the process of calcification since calcified organisms - such as planktonic coccolithophores, foraminifera and pelagic molluscs - depend on CaCO3 to form their exoskeleton (Turley & Findlay, 2016). Nevertheless, ocean acidification
constraints might affect other marine taxa, not just the ones who are calcification-dependent (Munday et al., 2009, 2010; Pope et al., 2014).
5
Figure 1.4 - The bottom panel compares the percentage of species sensitive to ocean acidification for corals, molluscs and crustaceans, vulnerable animal phyla with socio-economic relevance (e.g., for coastal protection and fisheries). The number of species analysed across studies is given on top of the bars for each category of elevated CO2. For 2100, RCP scenarios falling within each pCO2
category are as follows: RCP4.5 for 500 to 650 μatm, RCP6.0 for 651 to 850 μatm and RCP8.5 for 851 to 1370 μatm. By 2150, RCP8.5 falls within the 1371 to 2900 μatm category. The control category corresponds to 380 μatm (The unit μatm is approximately equivalent to ppm in the atmosphere), from IPCC (2014).
The early life history of calcifying marine invertebrates is assumed to be particularly sensitive to climate change drivers such as ocean acidification (OA) (Kurihara 2008; Pörtner & Farrell 2008; Melzner et al. 2009; Byrne, 2011).
When exposed to an elevated pCO2 level projected to occur under the IS92a
emissions scenario (740 ppmv in 2100), calcification rates in the mussel Mytilus edulis and the Pacific oyster Crassostrea gigas decrease by 25 and 10%, respectively (Gazeau et al., 2007). Arthropods (including crustaceans) also shown negative effects when exposed to OA (Fabry et al., 2008). The species Hyas araneus demonstrated less tolerance to OA reaching the Megalopa stage as well as reduced growth and calcification rates (Walther et
al., 2010). Larvae of the shrimp Pandalus borealis faced increased development time
(Arnberg et al., 2013). If crustacean species are adversely affected by ocean acidification, then this could have far reaching ecological consequences, as crustaceans are primary and secondary consumers and an important food source for higher trophic levels. For instance, crustacean species form the bulk of the zooplankton and can be present in vast numbers, either as pelagic larvae or as adults (Whiteley, 2011).
Drifting pelagic crustacean larvae have limited swimming ability, high susceptibility to physiological stress (with causes such as pH, temperature, salinity, dissolved oxygen, pollution or mall nutrition) and struggle to find a suitable habitat for settlement and recruitment, which might explain the high mortality rates found in nature (Morgan, 1995). Upon the previous, the cumulative risk of mortality increases with the duration of its planktonic phase (Barnes & Hughes, 1999). Recruitment is an extremely important step
6
during species ontogeny (Caley et al., 1996) and might be influenced by several environmental mechanisms (Sponaugle et al., 2002; Swearer et al., 1999). These early and highly susceptible developmental stages of marine organisms have been identified as potential life-history bottlenecks when we consider the impact of global changes on biological systems (Kurihara, 2008; Pörtner & Farrell, 2008; Byrne, 2011, 2012).
Several species of planktonic Chaetognatha, Echinodermata, Mollusca, and Vertebrata had negative responses to OA, with reduced growth and shell calcification, egg and individuals’ mortality, biomass losses or even aerobic stress (Fabry et al., 2008), the overall relative sensitivity of different taxonomic groups to ocean acidification and the response of processes has been described (see figure 1.5).
Figure 1.5 - Schematic representation of processes, energy flows and expenditures involved in organisms being able to survive, interacting with external factors that can also influence survival and the consequential impacts on the ecosystem state. Red full arrows indicate energy flows, dashed arrows represent potential energy trade-offs. Ocean acidification or other stressors can cause shifts in the energy distribution within an organism, but could also impact on the external factors, such as food availability, predator–prey interactions, and behaviour (from Turley & Findlay, 2016).
As the majority of crustaceans are committed water-breathers, they are in close contact with their external environment via the gills or equivalent structures, which are specialised for respiratory gas and ion exchange (Taylor & Taylor 1992). The effects of oceanic acidification on marine crustaceans have received increasing attention (e.g.: Wickins, 1984; Kurihara et al, 2004a,b; Kurihara & Ishimatsu, 2008; Mayor et al., 2007; McDonald et al., 2009; Bechmann et al., 2013: Paganini et al., 2014; Almén et al., 2016;
7
Small et al., 2016), however, the studies are disparate and have been conducted on widely divergent species (see Table 1.1) for varying lengths of time at different pCO2 levels and
the vast majority focused on survival and growth rates (Whiteley, 2011).
Table 1.1. Effects of elevated seawater CO2 on indices of growth and reproductive capacity in a
variety of crustacean species. pCO2: partial pressure of CO2 calculated from values published as
ppm (mole fraction). Dashes represent absence of available data (Whiteley, 2011).
Apart from survival, inter-moult period or growth, now considered “classic” fitness-related endpoints (Dupont & Pörtner, 2013) and taking into consideration the discrepancy in results across species mentioned above, a greater understanding of mechanisms of stress action is needed. This is possible through a better understanding of the biological responses at molecular and physiological levels, where calcification and respiration lead (Dupont & Pörtner, 2013). To this date, few studies have considered sub-individual physiological responses (e.g. Small et al., 2015) and even fewer have considered oxidative stress and energy metabolism endpoints as key factors to assess the susceptibility of marine organisms to OA, linking it to higher levels of biological organization.
Innovative approaches such as biochemical biomarkers and omics approach in ocean acidification and climate changes research are already a reality. Huning et al. (2012) observed compensatory processes in shell formation of Mytilus edulis by assessing relevant enzymes expression, Putnam et al. (2012) revealed plasticity at the molecular level in the reef coral Pocillopora damicornis, whereas Silva et al. (2016) reported the occurrence of
8
oxidative stress and implications on energy metabolism related endpoints in the sand-smelt
Atherina presbiter exposed to ocean acidification.
Physiological stress associated with increased environmental variability is likely to have repercussions on population distribution, growth rates, extinction risk and fitness (Boyce et al., 2006). Ocean acidification promotes a decrease in haemolymph pH (hypercapnia) that can reduce the oxygen affinity of haemocyanin (Pörtner 1990), while an increase in intracellular H+ can disrupt biological processes such as metabolism, protein
synthesis, ion-regulation, and cell volume control (Grainger et al. 1979; Madshus, 1988; Whiteley, 1999, 2011). In H. gammarus, osmoregulation shifts from larval hyperosmoconforming to post-larval hyper-isoregulation over the metamorphic moult that separates the third-stage larva from the first post-larva (Thuet et al., 1988), which has the adult type of osmoregulation (Charmantier, 1998). The maintenance of stable haemolymph osmolality and ionic concentrations different from those of the external medium is based on active ion transport (mainly Na+ and Cl-), in which different enzymes are known to play a
significant function, the most well-known being the Na+-K+ ATPase (Conte et al., 1977),
which activity is still studied nowadays, concerning new field studies such as climate change (e.g. Small, 2013). Moreover, marine crustaceans, in general, possess effective extracellular buffering mechanisms to maintain haemolymph homeostasis, predominantly in the form of the physiological regulation of HCO3- (Cameron 1978, 1985; Truchot, 1979;
Wood and Cameron, 1985; Whiteley, 1999), and have been perceived to be amongst the most ‘tolerant’ groups of marine invertebrates to elevated pCO2 (Melzner et al. 2009,
Kroeker et al. 2010, 2013).
Other highly mobile organisms such as fish that are capable of controlling extracellular pH through active ion transport are predicted to be more tolerant to acidification (Gutowska et al. 2008; Pörtner 2008; Melzner et al., 2009). Consecutively, organisms unable to compensate for the reductions in extracellular pH have shown depressed metabolism, growth and fitness (Poörtner et al., 2004; Michaelidis et al., 2005; Siikavuopio
et al., 2007). Higher maintenance costs in stressful abiotic environments could cause shifts
9
1.3 Biochemical biomarkers
According to Gestel & Brummmelen (1996), biomarkers can be defined as “any biological response to a stressor considered at the sub-individual level, measured in the interior of the organism or in its sub-products (blood, urine, excrements, fur, feathers, etc.), indicating a difference from the normal condition and that can’t be detected from the intact organism” and endpoints are measured through biochemical analysis concerning enzymatic activity, stress proteins and others. Biomarkers of effect can be characterized by a response to a stressor at the biochemical or molecular level as a cellular defence mechanism, while they are unspecific for the stressor in question. This simple notion suggests that biomarkers of effect should have great potential to reflect complex exposures and should also have the ability to include aggregated and sequential exposures over time (Silins & Högberg, 2011).
An organism that is subjected to chemical (e.g. environmental pH change), physical or biological stress may experience abnormal oxidative reactions in their aerobic metabolic pathways, resulting in oxidative stress (Ranby & Rabek, 1978). Reactive oxygen species (ROS) are produced as a result of a wide range of environmental stimuli (e.g. physical parameters and xenobiotics) (Morel & Barouki, 1999) and commonly used as messenger molecules in normal cell functions. However, at increased concentrations they can disrupt normal physiological pathways (Ermak and Davies, 2002). Changes in metabolic demands during life-cycle stages can cause differential ROS production and can also potentially influence the susceptibility to oxidative stress (Fanjul-Moles & Gonsebatt, 2011).
Oxidative stress derived from the exposure of aquatic animals to different kinds of pollutants may promote a redox signal, which in turn, induces protective responses against oxidative damage (see Figure 1.6) and resets the original state of redox homeostasis after temporary exposure to ROS (Rodríguez et al., 2007). If continuously generated by an aerobic metabolism, ROS can damage important biomolecules such as DNA, proteins, and lipids (Halliwell & Gutteridge, 1999). To counteract ROS-induced damage, cells have evolved defence mechanisms that act at different levels to prevent or repair such damage (Hegde et al., 2008).
Under normal physiological states, antioxidant enzymes such as superoxide dismutase (SOD) and catalase (CAT) rapidly eliminate ROS (Yu, 1994; Abele & Puntarulo, 2004): SOD catalyses the dismutation of two superoxide radicals to hydrogen peroxide (H2O2), while CAT degrades H2O2 into water and oxygen (Holmblad & Söderhäll, 1999;
10
Mohankumar & Ramasamy, 2006). These mechanisms play a major role protecting or delaying the oxidative damage, peroxidation and enzymatic inactivation (Halliwell & Gutteridge, 1999; Novais et al., 2014). The enzyme lactate dehydrogenase (LDH) that is related with anaerobic energetic metabolism (Ribeiro et al., 1999; Diamantino et al., 2001), also plays an important role in the production of the necessary energy for the maintenance of organisms' physiological homeostasis, in the absence of oxygen. Total carbohydrates and energy consumption, by the measurement of the electron transport system activity (ETS), provide information about the energetic balance (Novais & Amorim, 2013). The reallocation of metabolic resources to avoid/repair internal stress and damages may be challenging for larvae (Cunha et al., 2007), with severe consequences for development, performance and survival, which will eventually impact the population and communities, and ultimately the ecosystem.
Figure 1.6 – Oxidative stress cascade. Reactive oxygen species, produced in the presence of environmental stress, activate the sub-cellular defence and repair mechanisms, which prevent the damage of nucleic acids, proteins, lipids and carbohydrates. Examples of damage caused by impaired physiological function are described.
As early responding endpoints, the use of tools addressing responses at lower levels of biological organization can rapidly link and anticipate knowledge to what can occur at higher levels of biological organization (population, community or even ecosystems, see Figure 1.7) (Lemos et al., 2010). The reallocation of metabolic resources to avoid/repair internal stress and damages may be challenging for larvae (Cunha et al., 2007), crustacean larvae have evolved sophisticated and redundant responses to ensure survival, some of
11
which may have biomass consequences compromising the individual life cycle or the population size (Fanjul-Moles & Gonsebatt, 2011).
Along their life cycle, larval, juvenile, and adult crustaceans undergo variations in respiratory and metabolic requirements that are also dependent on environmental conditions. As it may be inferred from their life cycle, crustaceans represent one of the most complex groups of invertebrates, with various aspects of their metabolism requiring regulatory processes comparable to those found in vertebrates. Studies on antioxidant defences and oxidative stress in crustacean life cycles, although very important, are relatively new and information is still limited (Fanjul-Moles & Gonsebatt, 2011).
Figure 1.7 - The relationship between different levels of biological complexity, ecological relevance and time of response related to an environmental change or chemical exposure (Lemos et al., 2010).
1.4 Biological model: Homarus gammarus
The lobster Homarus gammarus is included within a wide taxonomic invertebrate group, the crustaceans (Beard & McGregor, 2004); it is also an economically important species, with a higher value than its congener Homarus americanus (Barrento et al., 2009). Ranging from Norway, along European and Mediterranean coasts with its southern limit located at Morocco (Beard & McGregor, 2004; Cobb & Wahle, 1994; Cobb & Castro, 2007; Prodöhl et al., 2007, see Figure 1.8), catches as large as 5,194 ton were reported across its geographical distribution in 2014 (FAO, 2016). This species feeds on mussels, hermit crabs and polychaetes (Beard & McGregor 2004; Kristiansen et al., 2004) so it has also an ecological relevance, acting as primary, secondary or tertiary consumer in the
multi-12
interaction, ever-changing pathways that are trophic-webs (e.g. Orensanz et al., 1998; Steneck et al., 2004; Worm & Myers, 2003; Frank et al. 2005). This species is found within the continental shelf to depths of 150 m, though is more commonly found at depths over 50 m (Holthuis, 1991). It is typically found on rocky substrates, but may also burrow into cohesive mud or form depressions in sand (Cobb & Castro, 2006).
Figure 1.8 – Homarus gammarus’ geographical distribution (dark grey): ranging from Norway, along European and Mediterranean coasts and going until as far south as Morocco, FAO, 2016.
Large crustaceans are becoming increasingly important to coastal and continental shelf fisheries (Anderson et al., 2011; Steneck et al., 2011). Globally, commercial catches of crustaceans have increased ~5-fold since 1950 and are the only invertebrate group that continues to trend upward in recent years (Anderson et al. 2011). In Portugal, a decrease in landings has been reported in 2011 and 2012, while an increase of 30% was reported onwards (INE, 2015).
Decapod crustaceans’ growth is characterized by the occurrence of a moult based growth/development/reproduction. Homarus gammarus reaches marketable size in the wild after 26-30 moults (5-7 years), which is strongly temperature-dependent (Beard & McGregor 2004; Charmantier & Mounet-guillaume, 1992). Sexual maturation of females does not occur before 5 to 8 years of age (Prodöhl et al. 2007; Browne et al. 2009), so even though H. gammarus is considered a Least Concern Species by IUCN (2011), higher landings (not necessarily meaning higher stocks) and long-term growth and sexual maturation are issues of concern to meet for this species future and conservation.
13
This species comprehend a complex life cycle (see Figure 1.9), going through three planktonic larval stages (see Figure 1.10) a metamorphic post-larvae, benthic juvenile, adult stages and the following behavioural, anatomical and physiological implications between those life stages (Cobb & Wahle, 1994; Cobb & Castro, 2007).
Figure 1.9 - Comparison of terminology for developmental stages and proposed ecological phases of the life history of clawed lobsters. Approximate sizes corresponding to moults are illustrated for Homarus. Vertical arrow indicates time of settlement, sourced from Cobb & Wahle (1994).
Stage I larvae exhibit strong positive phototaxy (Browne et al., 2009; Schmalenbach & Buchholz, 2009). Stage II show diminishing positive phototaxy and increased swimming ability (Schmalenbach & Buchholz, 2009) since there is a greater development of the first pair of legs and pleopods, becoming divided. In Stage III larvae, pleopods and claws present a larger size compared to the previous stage and the separation of the first pair of uropods takes place (Browne et al. 2009). Stage IV represents a metamorphosed bottom seeking megalopa in transition between pelagic (larval) and benthic (juvenile) environments (Browne et al. 2009).
14
Figure 1.10 - Larval stages of the decapod crustacean Homarus gammarus.
Considering its economic and ecological relevance, H. gammarus is a broadly studied crustacean. Research topics concerning its life history traits gathered and reported knowledge on fisheries (Browne et al., 2001), population dynamics and genetics (Agnalt et al, 2009; Hughes, 2000; Ulrich et al, 2001), physiology and reproduction (Free, 1998; Middlemiss et al., 2016), rearing, aquaculture and stock enhancements (Beard & Wickins, 1992; Benavente et al., 2010; Branford, 1978; Evjemo et al., 2009; Jørstad et al., 2009, Schoo et al., 2014) and climate change as well (Arnold et al., 2009; Schmalenbach & Franke, 2010; Small et al., 2015; Small et al., 2016;). This species, target of comprehensive studies, is a worthy study model where major inferences may be obtained considering their physiology and conservation measures taking the prospects of current/future global changes in an important economic and ecological resource.
1.5 Larval rearing of Homarus gammarus
For many commercially important species, the interest in aquaculture production for stock enhancement or food is often inversely proportional to fishery landings (Tlusty et al., 2005). Stock enhancement experiments in Europe have been evaluated by Bannister & Addison (1998) and, in an attempt to develop new methods, a large-scale lobster enhancement experiment was initiated in 1990 in Norway to assess if releases of hatchery-produced juveniles can stabilise recruitment and hence increase stock on a long-term basis (Agnalt et al. 1999). Restocking programs have been implemented in several European countries (Beard & Wickins 1992; Van Der Meeren 2005; Benavente et al. 2010; Schmalenbach et al. 2011), especially Norway, Ireland, United Kingdom and France. These
Stage I
Positive phototaxy; translucid carapace
Stage II
Pleopods development
Stage III
Pleopods well developed; Separated uropods
15
conservation efforts not only reinforced natural stocks of Homarus gammarus but gave great insights on how the larval rearing of this species is performed, through years and years of research, protocol optimization and know-how (e.g. National Lobster Hatchery).
Intensive rearing for closed-cycle aquaculture purposes is already being done in Norway, where the Norwegian Lobster Farm produces plate size Homarus gammarus. Nevertheless, achieving economic feasibility isn’t easy as this species’ rearing presents some constraints, namely cannibalism (Kristiansen et al. 2004; Prodöhl et al. 2007; Browne
et al. 2009). High densities intensify this behaviour so the captive rearing requires reduced
stocking densities or even individual rearing, resulting in high initial investments and intensive maintenance procedures (Browne et al. 2009; Schmalenbach et al. 2009; Benavente et al. 2010). The individual rearing of lobster larvae may also be applied in experimental research studies since outcomes may be influenced due to cannibalism instead of the experimental treatment itself, being survivorship an example.
One of the major constraints in marine aquaculture is efficient larval culture (Rainuzzo et al., 1997). Most marine larvae require live prey. Prey items used in aquaculture must have an adequate size, a high nutritional profile, swimming ability and capacity to survive in the target species culture environment (Kumlu & Jones, 1995a,b). The most common preys used in the larval rearing of Homarus gammarus larvae are enriched Artemia nauplii and frozen Mysis (e.g. Beard & Wickins, 1992; Kristiansen et al., 2004; Schmalenbach & Franke, 2010; Scolding et al., 2012). Artemia nauplii swim slowly and can be reliably cultured at high densities (Conklin, 1995; Narciso, 2000; Beck & Turingan, 2007). However, these organisms are not natural preys in the wild (Figueiredo et al., 2009) and have an unsatisfactory nutritional profile for most marine larvae since they lack certain essential polyunsaturated fatty acids (Léger et al., 1987; Narciso & Morais, 2001). Long-chain polyunsaturated fatty acids (polyunsaturated fatty acid with ≥20 C atoms, PUFA) such as eicosapentaenoic (EPA, 20:5n−3) and docosahexaenoic (DHA, 22:6n−3) acid are particularly important for larval growth but cannot be synthesized de novo, and therefore, need to be taken up from food (Bergé & Barnathan, 2005). A low level of essential PUFA in the diet reduces larvae physiological condition, and therefore reduces their chances of survival and growth (Anger, 1998).
As passive filter feeders, Artemia nauplii may be enriched with microalgae, yeast and probiotics. In the case of microalgae enrichment, the selected microalgae species is a crucial issue for the improvement of Artemia growth, modifying both its growth rate and its
16
biochemical composition (Seixas et al., 2009). The cryptophyte flagellate Rhodomonas fatty acid composition was studied by several authors. Although Trembley et al. (2007) reported low levels of PUFAs (namely EPA and DHA), Seixas et al. (2009) observed that
Rhodomonas lens enriched Artemia contained higher levels of eicosapentaenoic acid (EPA,
6.2%) than artemia juveniles fed with Tetraselmis suecica (4.1%, P≤
0.01), whereas docosahexaenoic acid (DHA) was only found in juveniles fed with Rhodomonas lens (1.1%). This microalgae has a high content in protein which also promoted faster Artemia growth (Seixas et al., 2009). Nevertheless, the enrichment of Artemia nauplii in the rearing of Homarus gammaus larvae included several other microalgae such as Isochrysis galbana (Uglem et al., 2006), Chaetoceros spp. (Browne et
al., 2009) or the Self-Emulsifying Lipid Concentrate – SELCO (Scolding et al., 2012), which
is rich in Highly Unsaturated Fatty Acids (HUFA's) and contains particularly high levels of the essential Omega-3 fatty acids, eicosapentaenoic acid (EPA) and docosahexaenoic acid (DHA).
1.6 Thesis aim and objectives
The knowledge on the sensitivity of several marine taxa to climate change, namely to Ocean Acidification scenarios, is increasing. Some information is now available on how plankton, molluscs, fish or crustaceans cope with this stressor. The study of responses through species’ ontogeny allows a further comprehensive understanding on how ocean acidification might affect this ecosystem in the future. Nevertheless, the vast majority of studies have focused on specific life-history stages.
While the assessment of crustaceans’ susceptibility to Ocean Acidification has been evaluated through developmental and behavioural responses, few considered the importance of insights at the physiological functioning.
Consequently, the aim of this thesis is:
To investigate the developmental and physiological sensitivities of Homarus
gammarus larvae – an ecologically and economically relevant decapod crustacean - when
17 The detailed objectives of this study are three-fold:
1 – To investigate the developmental and behavioural responses of lobster larvae through the entire larval development (survival, growth, inter-moult period) when exposed to ocean acidification levels predicted by 2100.
2- To give the first insight on the biochemical responses of Homarus gammarus larvae under an Ocean Acidification scenario (oxidative stress and energy metabolism related endpoints) and discuss how physiological sensitivities may be linked to changes in life history traits.
3- To understand the proper rearing conditions and survival of the individuals through the larval development and performing quality aquaculture techniques, while manipulating chemical properties of seawater and maintaining the desired treatment conditions at all times.
19
2. MATERIALS AND METHODS
2.1 Broodstock husbandry
Newly hatched larvae of Homarus gammarus were obtained from a single berried female at CETEMARES Building aquaculture facilities (Peniche, Portugal). The female was provided by a local crustacean retailer (Frutos do Mar, Portugal), the same week it was caught in Portuguese West Atlantic coastal waters.
After the acclimatization due to the 30-minute transport to CETEMARES facilities’ , the female was kept in a tank (V=500L) connected to a recirculation water system (TMC System 2500/5000 Filtration Unit), kept at a salinity of 35 PSU, temperature of 19°C and dissolved oxygen values close to saturation (DO ≥ 8mg.L-1). Natural light/dark cycle was
used throughout the rearing and experimental period (11h:13h light/dark). The amount of nitrites, nitrates and ammonia were always kept under 0.25mg/L.
The female was fed once a day at noon with whole mussels (Mytilus edulis) ad libitum and provided with refuge to promote wellbeing and minimize stress. It was considered successfully acclimatized since in less than 24h after the arrival it was already feeding.
To confirm the maturation stage of females, the Embryonic Eye Index (Browne et al. 2009 and Beard et al. 1985) was calculated from measurements in a small batch of eggs. This procedure was important for the assessment and calculation of the hatching time in function of temperature. Egg maturation and hatching was allowed to occur naturally, without any thermal, osmotic or mechanic stress.
2.2 Experimental design
2.2.1 – Experimental system set-up and seawater manipulation
The experimental system consisted in two independent recirculating aquaculture systems filled with previously filtered natural seawater and equipped with aerobic biological filtration (BioBalls and Fluidized Sand Filter – ReefSet)), mechanic filtration (protein skimmer – AquaMedic Blue 1000), chemical sterilization (UV Sterilizer – TMC Vecton V2) and water temperature control (chiller HAILEA, HC-150A; Aquarium heater EHEIM).
20
Each sump (V=60 L) delivered equilibrated seawater to a 60L transparent tank at a flow rate of 360L.h-1. Each tank held 47 individual rearing experimental units (V= 0,2L) with
a cylinder-spherical shape (see Figure 2.1). A gentle flow of ambient air was provided at the surface of each individual rearing units to promote water flux inside the units. The rearing system was allowed to mature for 6 weeks before the experiment took place.
The experimental treatments targeted the exposure to two different pCO2 (control:
370 µatm; increased: 710 µatm) and pH (control: 8.15; decreased: 7.85) scenarios. These scenarios are in line with the present conditions in Portuguese West Atlantic coastal waters and with IPCC RCPs for year 2100, where pH is expected to decrease 0.15-0.35 pH units, depending on the scenario family.
Larvae were exposed to a nominal seawater temperature of around 19ºC (see table 2.1). This temperature resembles the Mean Sea Surface Temperature (SST) from 1981-2010 of Portuguese central waters in the month the experiment took place (NOAA Optimum Interpolation (OI) SST V2) and was coincident with current field measurements for that month.
Seawater manipulation was performed in each treatment’s sump through the injection of pure CO2 (SERA CO2 gas bottle) and controlled by a pH controller (Flora Fertilization
System and Ceramic, SERA) in order to achieve the desirable pH values in every experimental units. The CO2 injection was regulated to a hysteresis of 0,001 to prevent
large pH oscillations and therefore the undesired pulse effect. The experimental system with CO2 injection was allowed to equilibrate before the essay took place.
Water chemistry was monitored daily. The pH measurements following the National Bureau of Standards Scale (NBS Scale) took place two times a day in 3 reference experimental units of each treatment using a pH electrode connected to a hand-held pH meter which was calibrated every two days with pH buffer standards. Temperature (kept at 19 ºC) and salinity (kept at 35 PSU) were measured twice a day in the same reference experimental units of each treatment with a handheld multiparameter meter (YSI, Professional Plus) and a refractometer (V2, TMC), respectively. Also DO (mg.L-1) was
21
Figure 2.1 – Experimental setup: a) Scheme of the designed RAS, represent seawater inflow, represent seawater outflow and the CO2 injection set-up; b) Real image of the system
set-up; c) close-up on one of the rearing tank and individual rearing experimental units.
Total Alkalinity (AT) was measured through manual potentiometric titration to a pH
endpoint of 4.5 using standardized sulfuric acid (H2SO4; 0,019N) on a closed vessel. pCO2
(µatm) was derived from TA, pH, temperature and salinity with the CO2SYST program (Lewis & Wallace, 1998), with constants provided by Mehrbach et al. (1973) and refitted by Dickson and Millero (1987) and KSO4 constants from Dickson (1990). Sampling occurred
every 5 days in triplicate from experimental units, kept in Borosilicate flasks without any air between the water mass until reaching the temperature in which the titration would take place (room temperature, 25 ºC) and then analysed. The used benchtop pH meter (WTW, inolab® pH 7110) was always calibrated before titration took place. Water-chemistry parameters for both treatments during the exposure period are presented in table 2.1. For
a)
b)
22
the equilibration of the target conditions, and since the response time of chillers and gas exchange rates are directly related with temperature, room temperature was controlled with the support of air conditioning.
Table 2.1. Water chemistry parameters over the course of the experimental period (Mean ± SD): temperature (°C), salinity, pH (NBS Scale) – measured in the experimental units, total alkalinity (AT,
mg.L-1 CaCO3), carbon dioxide partial pressure (pCO2, μatm), pH (NBS Scale), bicarbonate
concentration ([HCO3-], μmol.kg-1), carbonate concentration ([CO32-], μmol.kg-1). Parameters
calculated using CO2SYS program (Lewis & Wallace 1998) with constants provided by Mehrbach et
al. (1973) refitted by Dickson & Millero (1987) and KSO4 constants from Dickson (1990).
370 µatm | Control 710 µatm | Ocean Acidification
T (ºC) 18,90 ±0,23 19,10 ±0,25 Salinity 35,00 ± 0,74 35,00 ± 0,74 pH (NBS Scale) 8,14 ±0,03 7,84 ±0,05 TA (mg.L-1 CaCO3) 175,32 ±4,39 155.47 ±1,88 pCO2(µatm) 322,80 ±15,61 733,80 ±72,85 [HCO3-] 1403,40 ± 24,22 1391,50 ± 16,81 [CO32-] 127,30 ± 9,03 55,3 ± 4,78 DO (mg.L-1) 6,70 ± 0,37 6,70 ± 0,34
2.2.2 – Experimental Procedure
The chosen, acclimatized, female had a large, healthy and very close to complete maturation egg mass. In the first hatching day, newly hatched larvae (Basal; N=24) were immediately and gently collected with a sieve, measured, weighed and preserved for further biochemical biomarkers analysis. The remaining larvae were collected with a sieve right after hatching to a 40 L bucket with low flux aeration supply to promote locomotion and prevent cannibalism. After, larvae were separated to two buckets, acclimatized for 30 minutes with increasing proportions of the corresponding treatment seawater and then individually transferred to each experimental unit, using a disposable Pasteur pipette with trimmed tip. Once the assay begun, survival and moulting events were assessed every 12h during the entire experiment (see Figure 2.2), through non-invasive methods (visual inspections).
23
The first sampling moment took place 24h after the exposure (Stage I; N=24). Right after, the sampled larvae were replaced with newly hatched larvae from the same female which were also individually collected, measured and preserved (Basal; N=24) and acclimatized and exposed to the target scenarios (N=24). Once larvae had reached the Stage III (SIII - 48h after moulting [AM]), they were randomly selected (N=18), collected and preserved as mentioned above.
Figure 2.2 – Scheme of the sampling design, addressed endpoints and used life stage in the experiments.
2.2.3 –Live feeds: Artemia franciscana nauplii enriched with Rhodomonas lens
Homarus gammarus larvae were fed 48h-old enriched Artemia franciscana nauplii at
a concentration of 1nauplii.mL-1 (200 nauplii per experimental rearing unit), with a daily
100% feed renewal.
Commercial artemia cysts (Ocean Nutrition®) were decapsulated and put to hatch at 25 ºC. 24h after the hatching peek and quantification, the needed amount of artemia nauplii was enriched for 24h with Rhodomonas lens at a density of 3x10⁵ cel.mL-1 (dry weight [DW]
of 0,68g.day-1) in 2 L cylinder-conical vessels (Aquabreed, Aqua Medic).
Rhodomonas lens was aseptically cultured from a previously owned highly
concentrated batch. Approximately 1L was used to a final volume of 5 L in 6 L containers. F/2 medium was added twice a week at a proportion of 3.5 mL.L-1).
A growth curve was determined for this microalgae taking into consideration Cetemares’ specific culture conditions. In order to estimate culture concentration and
24
quantify the needed daily amount to enrich artémia nauplii, a relation between OD and concentration was obtained (see Figure 2.3).
Fig. 2.3 - Relation between OD and concentration for the cryptophyte Rhodomonas lens in Cetemares building considering an absorbance at 445nm. µ.day-1 = 0,364, duplication time = 1.9
days.
2.3 Determination of Behaviour and Development Responses: Survival,
Inter-moult Period, Morphometric Analysis, and Growth
2.3.1 – Organism Survival
The number of live individuals was counted every 12h in each rearing unit and cumulative survival was expressed as the percentage of the number of individuals introduced at day 0. This also took into account individuals removed for measurements: 24h after exposure that were replaced and the ones 48h after reaching Stage III that were not. Survival was also expressed as the percentage of individuals present in each scenario from the previous stage, to capture stage-specific changes in survival.
2.3.2 – Inter-moult Period Assessment
Organisms were assessed individually every 12h until the end of exposure, moulting events were registered and inter-moult period (IP) was expressed as the mean (days) of the duration of each larval stage.
0,00E+00 5,00E-01 1,00E+00 1,50E+00 2,00E+00 2,50E+00 3,00E+00 3,50E+00 4,00E+00 4,50E+00 0 0,2 0,4 0,6 0,8 1 Ce ll.mL -1 (x 10 6) OD (445 nm)