Vol.52, n. 4: pp.849-854, July-August 2009
ISSN 1516-8913 Printed in Brazil BRAZILIAN ARCHIVES OF
BIOLOGY AND TECHNOLOGY
A N I N T E R N A T I O N A L J O U R N A L
Glucose Administration Inhibits the Hepatic Activation of
Gluconeogenesis Promoted by Insulin-induced Hypoglycemia
Sharize Betoni Galende
1, Oswaldo Custódio de Oliveira Neto
2, Leandro Freire dos Santos
2,
Márcia Vardanega Peicher
1, Helenir Medri de Souza
3and Roberto Barbosa Bazotte
4*1Unidade de Ensino Superior Ingá; Maringá - PR - Brasil. 2Bolsista de Iniciação Científica do CNPq.
3Universidade Estadual de Maringá; Maringá - PR – Brasil. 4Departamento de Ciências Fisiológicas;
Universidade Estadual de Londrina; Londrina - PR - Brasil. 4Departamento de Farmácia e Farmacologia; Universidade Estadual de Maringá; Av. Colombo, 5790; 87020-900; Maringá - PR – Brasil
ABSTRACT
The activation of hepatic gluconeogenesis in male Wistar adult 6 h fasted rats during insulin-induced hypoglycemia (IIH) was previously demonstrated. In this study, the effects of intraperitoneal (ip) glucose (100 mg/kg) on the activation of liver gluconeogenesis during IIH was investigated. Thus, 6 h fasted rats that received ip regular insulin (1 U/kg) and 30 min later ip saline (Control group) or glucose (Experimental group) were compared. All the experiments were executed 60 min after insulin injection. The glycemia of Control and Experimental groups were not different (P > 0.05). To investigate gluconeogenesis, liver perfusion experiments were performed. The results demonstrated that excepting glycerol, livers from rats which received ip glucose showed lower (P < 0.05) gluconeogenesis from L-alanine, L-glutamine, L-lactate or L-alanine + L-glutamine + L-lactate + glycerol. Therefore, the absence of glucose recovery after the glucose administration was mediated, at least in part, by an inhibition of hepatic gluconeogenesis.
Key words: Hypoglycemia, glycemia recovery, hepatic metabolism, gluconeogenesis, ureagenesis
*
Author for correspondence: rbbazotte@uem.br
INTRODUCTION
Intensive insulin therapy prevents the development of the chronic complications of type 1 (DCCT, 1993) and type 2 diabetes (UKPDS, 1998). However, the rigorous glycemic control has been related with an increased incidence of insulin induced hypoglycemia (IIH) which is the major obstacle to the implementation of the intensive treatment (Davis and Alonso, 2004).
On the other hand, considering that glucagon, the most important gluconeogenic (Bracht et al., 2002)
Souza et al., 1994; Souza et al., 1996) that helps to restore normal glycemia, this work investigated the effects of ip glucose administration on the activation of hepatic gluconeogenesis during IIH. In addition, to get further information about the influence of glucose administration on liver gluconeogenesis, the effects of glucose precursors that entered in different points of this metabolic pathway were compared.
MATERIALS AND METHODS
Male Wistar rats weighing 180-220 g were used. The animals were maintained until the day of the experiment with free access to food and water. The animals were food deprived from 8:00 a.m. The experiments started 6 h later, i.e. at 2:00 p.m. The manipulation of the animals followed the Brazilian law on the protection of animals.
The in vivo experiments were executed to characterize the blood glucose and insulin after an ip injection (1 U/kg) of regular insulin (Neosulin®). Blood was obtained from rats killed by decapitation. The values of insulinemia (Desbuquois and Aurbach, 1971) after insulin injection at 0, 30, 60, 180 and 240 min (n = 7) were 27.0 ± 5.3, 227.0 ± 39.0, 136.0 ± 26.4, 52.3 ± 9.4 and 28.9 ± 1.5 µU/ml, respectively. The values of glycemia (Bergmeyer and Bernt, 1974) after insulin injection at 0, 30, 60, 180 and 240 min (n = 7) were 5.8 ± 0.12, 2.8 ± 0.26, 2.5 ± 0.45, 3.4 ± 0.52 and 4.1 ± 0.28 mM, respectively. IIH was well-established 30 min after insulin injection and so this period of time was selected for ip administration of glucose (Experimental group) or an equal volume of saline (Control group). The dose of glucose, i.e., 100 mg/kg, simulated the amount injected to treat IIH in human (Moore and Woollard, 2005). Moreover, since the lowest glycemia was observed 60 min after insulin injection this time was selected to measure glycemia and hepatic gluconeogenesis. For liver perfusion experiments, rats of Control and Experimental groups were anesthetized by an ip injection of sodium Thiopental (40 mg/Kg) and submitted to laparotomy. The livers were perfused in situas previously described (Gazola et al., 2007). The gluconeogenic substrates used were L-alanine (5 mM), L-lactate (2 mM), L-glutamine (5 mM) and glycerol (2 mM). Samples of the effluent perfusion fluid were collected and the concentration of glucose (Bergmeyer and Bernt, 1974) was
determined. The differences in the glucose production during and before the infusion of the gluconeogenic substrate (Figure 1) allowed calculating the areas under the curves (AUC), expressed as µmol/g (Table 1). The program GraphPad Prism (4.0) was used to calculate the AUC.
In part of the experiments, pyruvate (Czok and Lamprecht, 1974), L-lactate (Gutmann and Wahlefeld, 1974) and urea (Gutmann and Bergmeyer, 1974) were measured.
Moreover, from the basal production (the values obtained before the infusion of the gluconeogenic substrate) of L-lactate and pyruvate the NADH-NAD ratio was inferred by the L-lactate-pyruvate ratio.
Data were analyzed statistically by the unpaired Student’s t-test. A 95% level of confidence (P < 0.05) was accepted for all comparisons. Results are reported as means ± SEM.
RESULTS
Glycemia 60 min after insulin administration to Experimental group and Control group were 3.39 ± 0.15 (n = 15) and 3.25 ± 0.18 mM (n = 15), respectively (P > 0.05 vs. Control group).
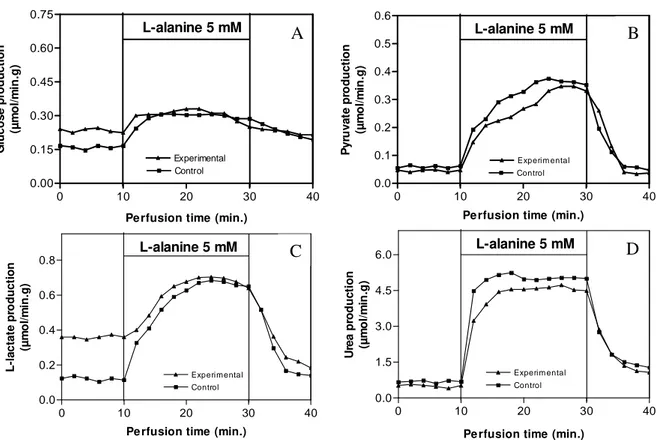
Figure 1 and Table 1A summarizes the results of the liver perfusion experiments for L-alanine. For this amino acid, livers from Experimental group showed lower (P < 0.05) production of glucose, L-lactate and urea. But, the production of pyruvate from L-alanine was not different.
The hepatic glucose production from L-lactate (Table lB) in livers of Experimental group was decreased (P < 0.05) whereas the hepatic pyruvate production was increased (P < 0.05).
Livers of Experimental group also showed lower (P < 0.05) hepatic production of glucose from L-glutamine. But, the liver production of urea was not different (Table 1C). In contrast, livers from Experimental group showed higher (P < 0.05) glucose production from glycerol (Table 1D). Livers of IIH rats that received ip glucose, i.e., Experimental group, showed lower (P < 0.05) glucose production from the combined infusion of L-alanine, L-lactate, L-glutamine and glycerol. However, the hepatic urea production remained unchanged (Table 1E).
0.45 and 2.02 ± 0.18) for Experimental and Control group, respectively).
DISCUSSION
The failure of glucose administration to promote glucose recovery during IIH reaffirmed previous results (Souza et al., 2001a, b) and suggested that the injection of glucose showed limitation to treat IIH. However, studies showing the effect of glucose administration on the activation of liver gluconeogenesis during IIH are lacking.
The effect of ip glucose administration on gluconeogenesis from livers of IIH rats is summarized in the Table 1.
The mechanism involved in the decreased hepatic glucose production from alanine, lactate and L-glutamine after glucose administration probably involves a blunt in the response to IIH mediated by counterregulatory hormones (Cryer, 1993; Davis et al., 1995).
However, in contrast with L-alanine, L-lactate and L-glutamine, glucose production from glycerol (Table 1D), which entered in this metabolic pathway at the triose phosphate step, was increased (P < 0.05).
Livers from rats which received glucose
showed higher basal L-lactate production
(Figure 1B) and glycolysis probably was partly
at least responsible for this, because it drive a
greater fraction of the glucosyl units from
glucose administered into the glycolytic
pathway. Moreover, since it has been generally
accepted that the ratio of L-lactate-pyruvate
reflects the redox potential of the cytosolic
NADH-NAD redox couple (Bazotte et al.,
1990), and considering that the livers of rats
that received glucose showed increased (P <
0.05) NADH-NAD ratio, it was hypothesize
that this change in the cytosolic redox potential
was not favorable for the conversion of
L-alanine to glucose, as previously demonstrated
in diabetic rats (Akimoto et al., 2000). The
experimental group showed lower (P < 0.05)
glucose production from L-alanine (Table 1A).
In addition, the decreased catabolism of
alanine, inferred by the lower (P < 0.05)
L-lactate and urea production (Table 1A) could
contribute to the lower hepatic glucose
production from L-alanine in livers of
Experimental group.
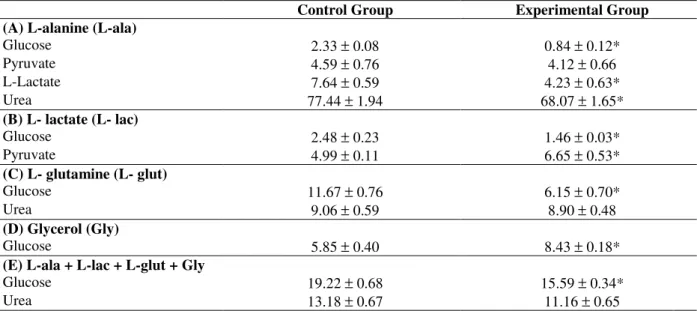
Table 1 - Area under curves (µmol/g) of glucose, pyruvate, L-lactate and urea from isolated or combined L-alanine (5 mM), L-lactate (2 mM), L-glutamine (5 mM) and glycerol (2 mM) in livers of Control and Experimental 6 h fasted rats. The livers were perfused as described in Figure 1. The data are reported as means ± SEM (5 rats per group). *P < 0.05 vs. Control group.
Control Group Experimental Group
(A) L-alanine (L-ala)
Glucose 2.33 ± 0.08 0.84 ± 0.12*
Pyruvate 4.59 ± 0.76 4.12 ± 0.66
L-Lactate 7.64 ± 0.59 4.23 ± 0.63*
Urea 77.44 ± 1.94 68.07 ± 1.65*
(B) L- lactate (L- lac)
Glucose 2.48 ± 0.23 1.46 ± 0.03*
Pyruvate 4.99 ± 0.11 6.65 ± 0.53*
(C) L- glutamine (L- glut)
Glucose 11.67 ± 0.76 6.15 ± 0.70*
Urea 9.06 ± 0.59 8.90 ± 0.48
(D) Glycerol (Gly)
Glucose 5.85 ± 0.40 8.43 ± 0.18*
(E) L-ala + L-lac + L-glut + Gly
Glucose 19.22 ± 0.68 15.59 ± 0.34*
Figure 1 - Liver production of glucose (A), pyruvate (B), lactate (C) and urea (D) from L-alanine in hypoglycemic rats that received ip saline (Control group) or ip glucose 100 mg/kg (Experimental group). After a pre-infusion period (10 min), L-Alanine was dissolved in the perfusion fluid and infused between 10 and 30 min, followed by a post-infusion period (10 min). Samples to determine glucose, pyruvate, L-lactate and urea were collected each 2-min. The differences during (10-30 min) and before (0-10 min) the infusion of L-Alanine allowed calculating the areas under the curves shown in Table 1. The data are reported as the mean of 7 experiments.
Since the ability of L-alanine to produce glucose was limited by its decreased catabolism, L-lactate that entered in the gluconeogenic pathway at pyruvate step (Figure 2), was employed. As shown in Table 1B, livers from the Experimental group exhibited lower (P < 0.05) glucose production from lactate. Taken together, the results from L-alanine and L-lactate suggested that the gluconeogenesis until pyruvate step was decreased in the Experimental group. Furthermore, this metabolic change could be expanded until α -ketoglutarate step (Figure 2) since lower (P < 0.05) glucose production from L-glutamine was observed (Table 1C).
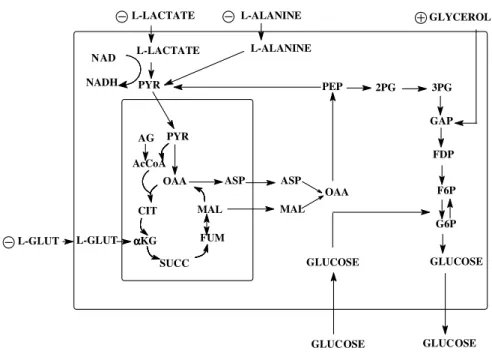
The results previously described were condensed in the Figure 2. Starting with L-alanine and L-lactate that entered in the gluconeogenic pathway at pyruvate step, the present results suggested that the treatment with glucose inhibited gluconeogenesis
until pyruvate carboxylase (PC) step. In addition, the hepatic glucose production from L-glutamine, which entered in the gluconeogenic pathway after the PC step, was also inhibited (Table 1C). However, gluconeogenesis was not totally inhibited since the glucose production from glycerol which entered in this metabolic pathway after the PC and phosphoenolpyruvate carboxykinase (PEPCK) step was higher in the Experimental group (Table 1D). In agreement with the results shown here and previous data (Souza et al., 2001b) lower (P < 0.05) hepatic glucose production was found from combined infusion of alanine, lactate, L-glutamine and glycerol in livers of Experimental group (Table 1E).
Thus, it could be concluded that the administration of glucose did not promote glycemia recovery, partly at least due to the inhibition of hepatic gluconeogenesis.
0 10 20 30 40
0.00 0.15 0.30 0.45 0.60 0.75 Experimental Control L-alanine 5 mM
Perfusion time (min.)
G lu c o s e p ro d u c ti o n (µ m o l/ m in .g )
0 10 20 30 40
0.0 1.5 3.0 4.5 6.0 Experim ental Control
L-alanine 5 mM
Pe rfusion time (min.)
U re a p ro d u c ti o n (µ m o l/ m in .g )
0 10 20 30 40
0.0 0.2 0.4 0.6 0.8 Experimental Control
L-alanine 5 mM
Pe rfusion time (min.)
L -l a c ta te p ro d u c ti o n (µ m o l/ m in .g )
0 10 20 30 40
0.0 0.1 0.2 0.3 0.4 0.5 0.6 Control Experim ental
L-alanine 5 mM
Perfusion time (min.)
P y ru v a te p ro d u c ti o n (µ m o l/ m in .g )
A
B
OAA
MAL
FUM
SUCC
α αα αKG
CIT AcCoA
AG PYR
ASP ASP
MAL OAA
PYR PEP 2PG 3PG
GAP
FDP
F6P
G6P
GLUCOSE L-LACTATE L-ALANINE
GLUCOSE
L-LACTATE L-ALANINE GLYCEROL
L-GLUT L-GLUT NAD
NADH
GLUCOSE GLUCOSE It must be emphasized that these results have
clinical significance considering that oral (Marian et al., 2003) or parenteral (Moore and Woollard,
2005) glucose administration is mandatory in the prehospital management of hypogycemia.
Figure 2 - Gluconeogenesis in the hepatocyte. Plasma membrane is represented by the greatest rectangle and mitochondria by the smallest rectangle. Increased gluconeogenesis, Decreased gluconeogenesis. Abbreviations: AcCoA, acetyl-CoA; ASP, aspartate; CIT, citrate; AG, fatty acid; FDP, fructose diphosphate; F6P, fructose 6-phosphate; FUM, fumarate; GAP, glyceraldehyde phosphate; G6P, glucose 6-phosphate; α-KG, α -ketoglutarate; L-Glut, L-glutamine; PYR, pyruvate; MAL, malate; OAA, oxaloacetate; PEP, phosphoenolpyruvate, 2PG, 2-phosphoglycerate; 3PG, 3-phosphoglycerate; SUCC, succinate.
ACKNOWLEDGEMENTS
The authors are grateful to Mr. Carlos Eduado de Oliveira and Solidalva Caruso de Oliveira for their technical assistance.
We are grateful to
Conselho Nacional de Desenvolvimento
Científico e Tecnológico (CNPq), Fundação
Araucária, Unidade de Ensino Superior Ingá
and Instituto Nacional de Obesidade e
Diabetes (CNPq) for financial support.
RESUMO
Em estudo recente empregando ratos Wistar com 6 h de privação alimentar demonstramos que ocorre ativação da neoglicogênese hepática durante a hipoglicemia induzida por insulina (HII). Neste estudo, os efeitos da administração intraperitoneal
REFERENCES
Akimoto, L. S.; Pedrinho, S. F.; Lopes, G. and Bazotte, R. B. (2000), Rates of hepatic gluconeogenesis in perfused liver of alloxan diabetic fed rats. Res Commun Molec Pathol Pharmacol., 107, 65-77. Bazotte, R. B.; Constatin, J.; Hell, N.S. and Bracht, A.
(1990), Hepatic metabolism of meal fed rats: studies in vivo and in the isolated perfused liver. Physiol Behav., 48, 247-53.
Bergmeyer, H. U. and Bernt, E. (1974), Determination of glucose with glucose oxidase and peroxidase. In: H. U. Bergmeyer (Ed.), Methods of enzymatic analysis, Verlag Chemie-Academic Press, New York, pp. 1205-1215.
Borba-Murad, G. R.; Vardanega-Peicher, M.; Souza, H. M.; Lopes, G.; Fonseca, M.H. and Bazotte, R. B. (1999), Hypoglycemia induced by insulin (IIH) increases the hepatic responsiveness to produce glucose from gluconeogenic amino acids. Acta Pharmacol Sin., 20, 1083-1086.
Bracht, A. M. K.; Fedato Jr, Z.; Ishii-Iwamoto, E. L.; Caparroz-Assef, S. M. and Bracht, A. (2002), The influence of Ca2+ on gluconeogenesis stimulation by glucagon in the liver of arthritic rats. Braz Arch Biol Technol., 45, 309-315.
Cryer P. (1993), Glucose counterregulation: prevention and correction of hypoglycemia in humans. Am J Physiol., 264, E149-E155.
Czok, R. and Lamprecht, W. (1974), Pyruvate, phosphoenolpyruvate and D-glycerate-2-phosphate. In: H. U. Bergmeyer (Ed.), Methods of enzymatic analysis, Verlag Chemie-Academic Press, New York, pp. 1446-1448.
Davis, S. and Alonso, M. D. (2004), Hypoglycemia as a barrier to glycemic control. J Diabetes Complications, 18, 60-68.
Davis, S. N.; Dobbins, R.; Tarumi, C.; Jacobs, J.; Neal, D. and Cherrington, A. D. (1995), Paradoxal insulin-induced increase in gluconeogenesis in response to prolonged hypoglycemia in conscious dogs. Am J Physiol., 268, E521-E531.
Desbuquois, B. and Aurbach, G. D. (1971), Use of polyethyleneglycol to separate free and antibody-bound peptide hormones in radioimmunoassays. J Clin Endocrinol., 33, 732-738.
Diabetes Control and Complications Trial (DCCT) Research Group. (1993), The effect of intensive treatment of diabetes on the development and progression of long-term complications in insulin-dependent diabetes mellitus. N Engl J Med., 329, 977-986.
Gazola, V. A. F. G.; Garcia, R. F.; Curi, R.; Pithon-Curi, T. C.; Mohamad, M. S.; Hartmann, E. M.; Barrena, H. C. and Bazotte R. B. (2007), Acute effects of isolated and combined alanine and L-glutamine on hepatic gluconeogenesis, ureagenesis and glycaemic recovery in experimental short-term
insulin induced hypoglycaemia. Cell Biochem Funct., 25, 211-216.
Gutmann, I. and Wahlefeld, W. (1974), L-(+)-Lactate. Determination with lactate dehydrogenase and NAD. In: H. U. Bergmeyer (Ed.), Methods of enzymatic analysis, Verlag Chemie-Academic Press, New York, pp. 1464-1472.
Gutmann, I. and Bergmeyer, H. U. (1974), Determination of urea, indicator reaction with phenol and hypochlorite. In: H. U. Bergmeyer (Ed.),
Methods of enzymatic analysis, Verlag Chemie-Academic Press, New York, pp. 1790-1798.
Marian, J.; Vermeulen, M. K.; Ray, J. G.; Mazza, C. and Morrison, L. J. (2003), Subcutaneous glucagon may be better than oral glucose for prehospital treatment of symptomatic hypoglycemia. Diabetes Care, 26, 2472-2473.
Moore, C. and Woollard, M. (2005), Dextrose 10% or 50% in the treatment of hypoglycaemia out of hospital? A randomized controlled trial. Emerg Med J., 22, 512-515.
Souza, H. M.; Hell, N. S.; Lopes, G. and Bazotte, R. B. (1996), Synergistic effect of combined administration of counterregulatory hormones during insulin-induced hypoglycemia (IIH) in rats: The participation of lipolysis and gluconeogenesis to the hyperglycemia. Acta Pharmacol Sin., 17, 455-459. Souza, H. M.; Hell, N. S.; Lopes, G. and Bazotte, R. B.
(1994), Effect of combined administration of counterregulatory hormones during insulin-induced hypoglycemia in rats: lipolysis mediated by ß-adrenergic mechanism contributes to hyperglycemia.
Braz J Med Biol Res., 27, 2883-2887.
Souza, H. M.; Borba-Murad, G. R.; Ceddia, R. B.; Curi, R.; Vardanega-Peicher, M. and Bazotte, R. B. (2001a), Rat liver responsiveness to gluconeogenic substrates during insulin-induced hypoglycemia. Braz J Med Biol Res., 34, 2771-2777.
Souza H. M, Borba-Murad G. R, Curi R.; Galletto, R. and Bazotte, R. B. (2001b), Combined administration of glucose precursors is more efficient than that of glucose itself in recovery from hypoglycemia. Res Comm Molec Pathol Pharmacol., 110, 264-272. UK Prospective Diabetes Study (UKPDS) Group.
(1998), Intensive blood-glucose control with sulphonylureas or insulin compared with conventional treatment and risk of complications in patients with type 2 diabetes (UKPDS 33). Lancet, 352, 837-853.
Vardanega-Peicher, M.; Galletto, R.; Silva, S. P. and Bazotte, R. B. (2003), Comparative effect of glucagon and isoproterenol on hepatic glucose production and glycolysis in isolated perfused liver.
Braz Arch Biol Technol., 46, 563-568.