Test procedure for variable rate fertilizer on coffee
José Paulo Molin1*, Anamari Viegas de Araujo Motomiya2, Flavia Roncato Frasson3, Gustavo Di Chiacchio Faulin1 and Wanderson Tosta4
1Departamento de Engenharia de Biossistemas, Escola Superior de Agricultura “Luiz de Queiroz”, Universidade de São Paulo, Av. Pádua Dias, 11, 13418-900, Piracicaba, São Paulo, Brazil. 2Faculdade de Ciências Agrárias, Universidade Federal da Grande Dourados, Dourados, Mato Grosso do Sul, Brazil. 3Comércio Atacadista e Indústria de Peças Agrícolas Ltda., Assis, São Paulo, Brazil. 4
Máquinas Agrícolas Jacto S.A., Pompéia, São Paulo, Brazil. *Author for correspondence. E-mail: [email protected]
ABSTRACT. The objective was to develop and test a procedure for applying variable rates of fertilizers and evaluate yield response in coffee (Coffea arabica L.) with regard to the application of phosphorus and potassium. The work was conducted during the 2004 season in a 6.4 ha field located in central São Paulo state. Two treatments were applied with alternating strips of fixed and variable rates during the whole season: one following the fertilizing procedures recommended locally, and the other based on a grid soil sampling. A prototype pneumatic fertilizer applicator was used, carrying two conveyor belts, one for each row. Harvesting was done with a commercial harvester equipped with a customized volumetric yield monitor, separating the two treatments. Data were analyzed based on geostatistics, correlations and regressions. The procedure showed to be feasible and effective. The area that received fertilizer applications at a variable rate showed a 34% yield increase compared to the area that received a fixed rate. The variable rate fertilizer resulted in a savings of 23% in phosphate fertilizer and a 13% increase in potassium fertilizer, when compared to fixed rate fertilizer. Yield in 2005, the year after the variable rate treatments, still presented residual effect from treatments carried out during the previous cycle.
Key words: precision agriculture, yield map, soil fertility.
RESUMO. Método para avaliação de aplicação de fertilizantes em taxa variável em café. O objetivo foi desenvolver um procedimento para avaliar a resposta da produtividade de café (Coffea arabica L.), a partir da aplicação de fósforo e potássio. O trabalho foi conduzido durante o ciclo produtivo do ano de 2004 em um talhão de 6,4 ha localizado na região central do Estado de São Paulo. Foram aplicados dois tratamentos em linhas alternadas de plantas com doses fixas e variadas, um seguindo procedimentos e recomendações locais e o outro com base na amostragem de solo em grade. Para a aplicação dos fertilizantes, foi utilizado o protótipo de uma adubadora com duas esteiras independentes, uma para cada linha de plantas. A colheita foi executada com uma colhedora comercial equipada com monitor de produtividade volumétrico. Os dados foram analisados utilizando-se a geoestatística, correlações e regressões. O método mostrou-se efetivo e de fácil execução. A área que recebeu fertilizantes aplicados em doses variadas apresentou produtividade 34% maior se comparada com a área que recebeu adubação em taxa fixa. A aplicação em taxa variada resultou em economia de 23% de fósforo e aumento de 13% no consumo de potássio quando comparada com a aplicação dos fertilizantes em taxa fixa. A produtividade de café em 2005, no ciclo seguinte ao experimento, ainda apresentou efeitos residuais dos tratamentos aplicados no ciclo anterior.
Palavras-chave: agricultura de precisão, mapa de produtividade, fertilidade do solo.
Introduction
For a long period in Brazilian history, coffee was the most important commercial product, especially
during the intensive European colonization in the 19th
century. Today, it still plays an important economic and social role. Brazil is the world's largest coffee producer and exporter, involving approximately ten million people, either directly or indirectly, from production to industrialization and trade.
on any field and has the objective of optimizing profitability and environmental sustainability and protection.
To test variable rate application of inputs, especially for soil, several arrangements and procedures have been proposed and used as field experiments. In coffee, fertilizers are applied several times during the season and the effects will last for longer periods as compared to annual crops. Coffee is also grown in a two year cycle (RENA; MAESTRI, 1985). In years with low production, fertilizer rates are lower than in the years of high yield. To study the use of precision agriculture strategies, the objective of this work was to develop and test a procedure of applying variable rates of fertilizers and evaluate yield response in coffee with regard to the application of phosphorus and potassium according to the requirements indicated by grid soil sampling.
Material and methods
The experiment was conducted on one field located in Galia, São Paulo State, Brazil (coordinates 22º 18’ S and 49º 36’ W), comprising Typic Hapludox soils, with a weak A horizon, and a gently rolling topography, with good drainage (Figure 1). The 6.4 ha field was cultivated with coffee of the
Arabica variety (Coffea Arabica L.), “Mundo Novo”
cultivar at 4.0 m row spacing, for 11 years.
The field has been harvested since 2000 by a K3
Coffee Harvester (Máquinas Agrícolas Jacto S.A.®,
Pompéia, São Paulo State, Brazil) using an integrated yield monitor based on volume flow measurement. Due to the physiological alternation of yield that is inherent to coffee crops, yield records were obtained at every two years, which represented high-yield years in the biennial coffee cycle. However, in 2005, even though it was a year when a low yield was expected, the harvester could be used because grain coffee content on the trees made it viable. It was therefore feasible to evaluate a likely residual effect of treatments from the previous cycle.
Soil sampling was conducted in August 2003, with a total of 16 sampling points adjusted by the crop rows (Figure 1). The samples related to variable rate treatment were composed by ten sub-samples collected parallel and at 0.6 m from the plant line and spaced approximately 0.2 m each other, collected with a screw auger, to represent a sample at the 0 - 0.20 m depth. Following the sampling procedure used by the farmer, for the fixed fertilizer rate treatment, a composite sample was collected using the same 16 sampling points to get 16 sub-samples over the entire field, in the center of the rows.
Figure 1. Image of the experimental area, inside a larger plantation, showing the coffee rows and the 16 soils sampling points from August 2003 and October 2004.
Soil was analyzed for phosphorus and potassium
according to the procedures described by Raij et al.
(1987). Statistical analyses were performed using SAS®
software. The hypothesis of data normality was tested by the W test at p = 0.05 (SHAPIRO; WILK, 1965). Data which did not show a normal distribution were transformed to their logarithmic form (y = ln x) and again submitted to the W test. The variables relationships and effects in variable and fixed fertilizer rate application were tested by the analysis of variance with Snedecor’s F test and t test.
Based on soil analysis, fertilizer recommendations for phosphorus and potassium were determined for each sampling point according to criteria established by Raij et al. (1996) for coffee. Normally studies emphasize nitrogen, phosphorus and potassium, but in our conditions the recommendation of variable rate nitrogen is not possible based on soil samples. So the results were used to direct variable rate phosphorus and potassium application. The result from the composite sample from the sampling procedure used by the farmer was used for the constant rate recommendation.
The spatial dependence analysis for soil and yield variables (hulled coffee) was performed by fitting the data to the experimental semi-variogram, according to the regionalized variables theory
(TRV), using the GS+ 5.03 software
region depends only on the distance and direction of separation of both sites, not on their geographic location. Semi-variance at a given distance h is estimated as one half of the mean of the squared difference in all observations separated by the distance. The semi-variogram is the graphical representation of the semi-variance as a function of distance h (WEBSTER, 1985).
Inverse distance squared interpolation was used in mapping phosphorus and potassium recommendation data because no fit at these data to a semi-variogram was obtained. A raster surface of 10 m cells was developed from the interpolation. The interpolated values were used to generate fertilizer application maps by dividing the value of each cell by the purity content of the fertilizer source used (0.18 for the potassium source (KCl) and 0.58 for the single superphosphate (SS)). Potassium fertilizer was split into two identical
applications with rates varying from 124 to 258 kg ha-1
of KCl. Phosphorus was added in a single application,
which varied from 123 to 442 kg ha-1 of SS. Maps were
prepared using SSToolbox® GIS software (SST
Development Group®, Stillwater, OK, USA).
Fertilizer applications were made in strips, equivalent to the trees row width, with individual operations for the SS and the two KCl applications. Application was performed using a pull-type fertilizer-spreader prototype (Máquinas Agrícolas
Jacto SA®, Pompéia, São Paulo State, Brazil), with
double individual conveyor belts and pneumatic distribution of the fertilizers at the canopy area of the trees. The machine was pulled by a tractor
moving at 1.82 m s-1 and was equipped with a
controller for application at a variable rate governed by the conveyor belts speed and combined with variation in the gate height over the belt. The controller in this study read the application map as cells of 10 x 10 m, and used GPS for positioning. It applied the fertilizer at a variable rate on the right side, following the recommendation maps, while the application adopted by the farmer was performed on the left side of the machine. Fertilizations were conducted in November 2003 for all the SS and the first KCl application, and in December 2003 for the second KCl application.
Harvest was conducted at the end of July 2004. As the coffee harvester equipped with the yield monitor allowed the yield data to be collected in the variable rate strips separated from those treated with the constant fertilizer rate. The statistical analyses were conducted on hulled coffee yields. A factor of 0.17 was used to convert the coffee volume measured in the field by the monitor into hulled coffee weight; the
factor refers to the mean of three samples collected in the area, with a CV value of 4.86%.
Yield data were filtered to remove outlier values, with the adoption of methodology adapted from Menegatti and Molin (2004). Descriptive statistical analyses were performed based on the filtered set of data, in addition to a linear regression to verify the interaction between soil phosphorus and potassium contents after the application of fertilizers at variable rate and yield, and geostatistics and interpolation for the generation of maps.
In October 2004 soil sampling was performed to reevaluate the soil fertility. The collection of grid samples was made with a drill-type sampler, powered by a hydraulic motor transported by a ATV (quadricycle), following the same procedure of the previous sampling collection; two sets of 10 samples consisting of 10 sub-samples were obtained at the 0 - 0.20 m depth; one set was obtained on the rows that received variable rate fertilizer and the other on the rows that received constant fertilizer rate, so the field started to be treated as two separate areas, row by row. The data for soil P and K content were submitted to geostatistical analysis in order to verify spatial dependence.
Results and discussion
According to the recommendation for soil fertility levels for coffee in the region where the experiment was conducted (RAIJ et al., 1996), the mean values for phosphorus and potassium contents at the 0 - 0.20 m layer from the soil sampling from August 2003 were considered medium and low, respectively. The descriptive statistical analysis results for sampled phosphorus and potassium contents observed and recommended amounts for variable rate application are listed in Table 1. At the soil sample related to the fixed fertilizer rate the
contents observed were 30.0 kg ha-1 of phosphorus
and 148.5 kg ha-1 of potassium, both considered as
medium levels according to Raij et al. (1996). Based on that, the recommended doses for fixed rate were
32.68 kg ha-1 of phosphorus and 160.33 kg ha-1 of
potassium.
Although, in general, the mean values of variables for the entire study area fell into the medium fertility range, phosphorus values were
high, with contents varying from 10 to 78 kg ha-1,
corresponding to very low to high recommendation ranges. The potassium variable showed smaller amplitude, with contents ranging from 39.09 to
109.45 kg ha-1, corresponding to very low to low
Table 1. Descriptive statistical analysis for phosphorus (P) and potassium (K) contents observed in the soil (August 2003) and recommended for application.
Observed Recommended*
P** K P K
kg ha-1
Mean 27.16 71.14 36.67 184.8
Coefficient of variation (%) 69.36 25.64 30.93 21.66
Kurtosis 1.52 0.64 -0.59 -0.38
Asymmetry 1.30 0.76 -0.04 0.88
Minimum 10.00 39.09 13.33 116.5
Maximum 78.00 109.4 53.33 249.8
Number of Samples 16 16 16 16
Pr < W 0.0053 0.133
*Calculated from Raij et al. (1996). **P – phosphorus (kg ha-1 P = 0.5 mg dm-3); K –
potassium (kg ha-1 K = 0.01279 mmol c dm-3).
Total range must be viewed with reservation, since this measure takes into account only the two extreme values of a data set, and is often affected by a particularly discrepant value. The wide range of nutrient availability in a field may be problematic if the mean is used to manage the areas: at some locations the application of fertilizers will be underestimated, while in others, the application will be excessive. Such an application will result in economic losses from excessive fertilizer applications or yield losses from lower than optimal deficiencies in high demanding areas, and deleterious effects to the environment in low fertilizer demanding areas (SALVIANO et al., 1998).
The phosphorus values were not normally distributed, while the potassium values were p > 0.05, based on the Shapiro and Wilk normality test (1965). Corá et al. (2004), studing the behavior of phosphorus and potassium in the field, also observed that they did not adjust to a normal distribution. Therefore, there are some locations in the field with lower nutrient contents and others with higher contents, suggesting an alteration in native variability caused by management.
The potassium variable showed moderate variability (15% < CV < 35%) (WILDING; DREES, 1983), while the phosphorus variable showed high variability (CV > 35%), confirming results obtained by Salviano et al. (1998) in an association between Typic Hapludult and Lithic Udorthent soils. Chien et al. (1997) worked in alluvial soils cultivated with rice and obtained extremely high CV values for phosphorus (199%). This high variability was attributed to the soil fertilization effects. In the present experiment, the high CV value for phosphorus was maintained after the coffee harvest, following fertilization at both variable and constant rates (Table 2).
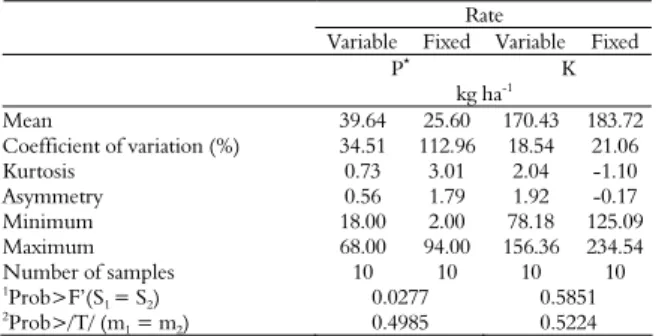
Table 2. Analysis of soil phosphorus and potassium contents (October 2004), for both, variable and fixed fertilizer rate treatments.
Rate
Variable Fixed Variable Fixed
P* K
kg ha-1
Mean 39.64 25.60 170.43 183.72
Coefficient of variation (%) 34.51 112.96 18.54 21.06
Kurtosis 0.73 3.01 2.04 -1.10
Asymmetry 0.56 1.79 1.92 -0.17
Minimum 18.00 2.00 78.18 125.09
Maximum 68.00 94.00 156.36 234.54
Number of samples 10 10 10 10
1Prob>F’(S
1 = S2) 0.0277 0.5851
2
Prob>/T/ (m1 = m2) 0.4985 0.5224
*P – phosphorus (kg ha-1 P = 0.5 mg dm-3); K – potassium (kg ha-1 K = 0.01279 mmol c
dm-3); 1F test –H
0 hypothesis for homogeneity of variances; 2t test –H
0 hypothesis: there
are no differences between soil nutrient content means in areas fertilized at variable and fixed rate.
The spatial distribution maps for phosphorus and potassium fertilizer rates applied at variable rate are found in Figure 2. There is a central region on the map that required higher phosphorus fertilizer rates and a region that required smaller potassium rates, overlapping this region, although with a different shape.
Figure 2. Map for the application (a) of potassium chloride (KCl) split into two applications (Nov. and Dec., 2003), and (b) single superphosphate (SS) (Nov., 2003).
In the bottom part of the map, both variables show a similar pattern, and both require higher fertilizer rates. The potassium constant fertilizer rate corresponds to the smallest variable potassium rate applied at variable rate. The low constant potassium rate may cause future nutritional problems to coffee in parts of the field, since coffee has a high demand for potassium (GALLO et al., 1999).
Variable rate fertilizer application ranged from 18
to 68 kg ha-1. In the area that received phosphorus
fertilizer at fixed rate, there was an increase in range,
with contents varying from 2 to 94 kg ha-1. The
range between maximum and minimum values was also wider for potassium in the area fertilized with a
with the area fertilized with a variable rate (78.18 to
156.36 kg ha-1), suggesting an increase in variability
with fixed rate potassium application.
Snedecor's F test for analysis of variance indicated homogeneity of variances between potassium contents applied at fixed and variable rate (p > 0.10); the phosphorus data, however, did not show the same behavior (p < 0.10). Application of the t Test indicated that there were no significant differences between soil variable means, after fertilization at fixed and variable rate (p > 0.05).
The analysis of variance for yield data (using an approximation of the t test, since there was no homogeneity of variances) revealed that there was a highly significant difference (p < 0.01) in mean yield between the area that received application of fertilizers at variable rate and the area that received a fixed fertilizer rate (Table 3). The yield data variability expressed by the coefficient of variation was higher in the area fertilized at variable rate, in contrast with the phosphorus and potassium data. Yield data before filtering had 694 and 713 points for variable and fixed rates treatments, reduced to 506 and 583 points after cleaning.
For the 2004 harvesting the mean yield (Table 3)
with fertilizer at variable rate was 2,557 kg ha-1,
resulting in a total production of 16,365 kg, while the mean yield with fertilizer at a fixed rate was
1,678 kg ha-1, resulting in a total production of
10,739 kg. The difference represents 34% of yield, i.e., the area previously fertilized at a constant rate obtained a yield that was 66% of the yield observed in the area fertilized at variable rate.
Table 3 also shows the yield behavior during the years before the experiment, as well as during 2005, in the cycle that followed the crop in which the variable rate treatments were applied. The analysis of variance for the yield data of that cycle revealed that there was also a highly significant mean yield difference (p < 0.0001) between the area that received fertilizer applications at variable rate and the area that received a constant rate. The yield data variability expressed by the coefficient of variation was similar in both conditions. It can be seen that there was a residual effect from treatments carried out during the previous cycle.
On average, coffee yield is declining, which might be related to the age of the plantation (11 years). It is a normal managing practice to trim the trees at different severity levels, depending on the yield reduction. Also, seasonal factors associated with climate may affect differently and significantly
the yield over the years. The fertilizer applications before 2003 were done by the farmer and based only on his practices, so the field was not spatially affected by site-specific treatments.
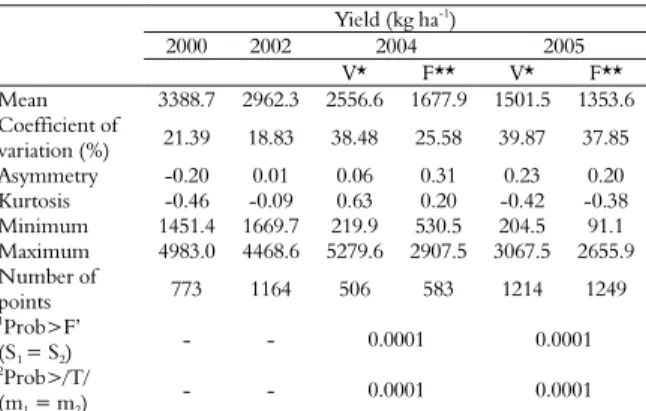
Table 3. Statistical analysis of hulled coffee yield data from August 2000, June 2002, August 2004, and July 2005.
Yield (kg ha-1)
2000 2002 2004 2005
V* F** V* F**
Mean 3388.7 2962.3 2556.6 1677.9 1501.5 1353.6 Coefficient of
variation (%) 21.39 18.83 38.48 25.58 39.87 37.85 Asymmetry -0.20 0.01 0.06 0.31 0.23 0.20 Kurtosis -0.46 -0.09 0.63 0.20 -0.42 -0.38 Minimum 1451.4 1669.7 219.9 530.5 204.5 91.1 Maximum 4983.0 4468.6 5279.6 2907.5 3067.5 2655.9 Number of
points 773 1164 506 583 1214 1249
1
Prob>F’ (S1 = S2)
- - 0.0001 0.0001
2Prob>/T/
(m1 = m2)
- - 0.0001 0.0001
*Yield in the area fertilized at variable rate; **Yield in the area fertilized at fixed rate; 1F
test – H0 hypothesis for homogeneity of variances; 2t test – H0 hypothesis: there are no
differences between yield means in areas fertilized at variable and fixed rate.
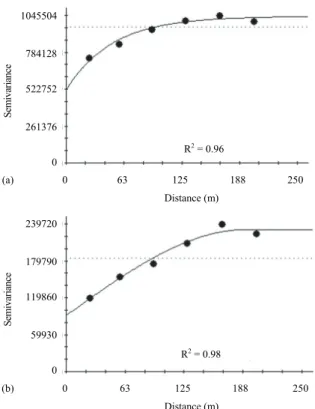
The semi-variogram models fitted to the yield data for 2004 are presented in Figure 3. The spatial distribution of the studies attributes is not random, as all presented median values for spatial
dependence, according to the relation C0/(C0+C)
(CAMBARDELLA et al., 1994), as 50.0 and 39.5% for fix and variable rate, respectively. There was spatial dependence in the area fertilized at variable rate at lower distance, indicated by the smaller range
value (A0 = 50.4 m), as well as by a higher nugget
effect relation (C0) with reference to the sill (C0 +
C) and a spherical model.
A better semi-variogram fit was obtained in the
area fertilized at fixed rate, with R2 = 0.98 and an
exponential model. A longer distance for spatial
dependence range was obtained (A0 = 193.6 m), and
there was a decrease of the relation between the nugget and sill effects, indicating greater spatial distribution of yield under uniform fertilization conditions in the area.
S
em
iv
aria
n
ce
1045504
784128
522752
261376
0
(a) 0 63 125 188 250
Distance (m)
S
em
iv
aria
n
ce
239720
179790
119860
59930
0
(b) 0 63 125 188 250
Distance (m)
Figure 3. Models and parameters of semi-variograms fitted to the coffee yield data: (a) in the area fertilized at variable rate; (b) in the area fertilized at fixed rate.
Figure 4. Interpolated yield maps for hulled coffee harvested in 2004, corresponding to (a) the area fertilized at a variable rate and (b) the area fertilized at a fixed rate.
Based on a visual analysis of the maps (Figures 2 and 4) it can be observed that the application of phosphorus fertilizer was greater in the central region of the field, coinciding with the high yielding central region observed in the yield maps. This fact was not verified in relation to potassium.
Similarly for the fertilizers, the amount of phosphorus fertilizer applied in 2004 at variable rate
would be 319 kg ha-1, while fertilizer at a fixed rate
would be 417 kg ha-1, resulting in fertilizer savings
of 98 kg ha-1. The difference represents an economy
of 23% in phosphorus fertilizer. With regard to the potassium fertilizer applied at variable rate, the total
would be 387 kg ha-1, while fertilizer at fixed rate
would be 334 kg ha-1. On average, the fertilizer
recommendation at a fixed rate was smaller than at a variable rate, generating a fertilizer demand increase
of 53 kg ha-1. This difference would result in a 13%
increase in the use of potassium fertilizer.
The semi-variograms for soil phosphorus and potassium content after harvesting could not be fitted, which was perhaps a consequence of the small number of the samples.
Fertilizer at variable rate was intended for the localized application of the correct rate of nutrient to the soil, to ensure yield in the coffee plantation. Therefore, higher rates were applied in regions where nutrient deficits existed, and smaller quantities were applied at locations with high contents, with the objective of homogenizing the amount of nutrients in the soil for better crop development. This could explain the low relationship that exists between the amounts of nutrient applied and crop yield, since application at variable rate is a technique that consists in the application of input according to the requirements of each part of the field, in an attempt to improve sites where soil deficits occur, in order to maximize yield.
Conclusion
The procedure of applying variable rates of fertilizers and evaluate yield response row by row proved to be effective and promising for long-term evaluation of precision agriculture techniques for coffee and other perennial crops. The area that received fertilizer applications at a variable rate of phosphorus and potassium fertilizers showed a 34% yield increase in relation to the area that received fixed rates for yield improvements. In 2004, the variable rate fertilizer provided a savings of 23% in phosphate fertilizer and a 13% increase in potassium fertilizer, when compared against fixed rate fertilizer. Yield in 2005, on the cycle that followed the variable rate treatment, presented residual effect from the previous cycle. Variable rate phosphorus and potassium appears to be a promising fertilizer management strategy for coffee.
References
CAMBARDELLA, C. A.; MOORMAN, T. B.; PARKIN, T. B.; KARLEN, D. L.; NOVAK, J. M.; TURCO, R. F.; KONOPKA, A. E. Field-scale variability of soil properties in central Iowa soils. Soil Science Society of America Journal, v. 58, n. 5, p. 1501-1511, 1994.
R2
= 0.96
CHIEN, Y. J.; LEE, D. Y.; GUO, H. Y. Geostatistical analysis of soil properties of mid-west Taiwan soils. Soil Science,v. 162, n. 4, p. 291-298, 1997.
CORÁ, J. E.; MOTOMIYA, A. V. D. A.; PEREIRA, G. T.; BERALDO, J. M. G. Assessment of spatial variability of soil attributes as a basis for the adoption of precision agriculture in sugarcane plantations. Revista Brasileira de Ciência do Solo, v. 28, n. 6, p. 1013-1021, 2004. GALLO, P. B.; RAIJ, B. VAN; QUAGGIO, J. A.; PEREIRA, L. C. E. Resposta de cafezais adensados à adubação NPK. Bragantia, v. 58, n. 2, p. 341-351, 1999. MENEGATTI, L. A. A.; MOLIN, J. P. Remoção de erros em mapas de produtividade via filtragem de dados brutos. Revista Brasileira de Engenharia Agrícola e Ambiental, v. 8, n. 1, p. 126-134, 2004.
RAIJ, B. Van; QUAGGIO, J. A.; CANTARELLA, H. Análise química de solo para fins de fertilidade. Campinas: Fundação Cargill, 1987.
RAIJ, B. Van; CANTARELLA, H.; QUAGGIO, J. A. Estimulantes. In: RAIJ, B. VAN; CANTARELLA, H.; QUAGGIO, J. A.; FURLANI, Â. M. C. (Ed.). Recomendações de adubação e calagem para o Estado de São Paulo. Campinas: Instituto Agronômico e Fundação IAC, 1996. cap. 15, p. 97-101. (Boletim Técnico, 100). RENA, A. B.; MAESTRI, M. Fisiologia do cafeeiro. Informe Agropecuário, v. 11, n. 126, p. 26-40, 1985. ROBERTSON, G. P. GS+: Geostatistics for the environmental sciences. Version 5.03 Beta, Plainwell: Gamma Design Software, 1998.
SALVIANO, A. A. C.; VIEIRA, S. R.; SPAROVEK, G. Variabilidade de atributos de solo e de Crotalaria juncea em área severamente erodida. Revista Brasileira de Ciência do Solo, v. 22, n. 1, p. 115-122, 1998.
SCHUELLER, J. K. A review and integrating analysis of Spatially-Variable Crop Control of crop production. Fertilizer Research, v. 33, n. 1, p. 1-34, 1992.
SHAPIRO, S. S.; WILK, M. B. An analysis of variance test for normality: complete samples. Biometrika, v. 52, n. 3-4, p. 591-611, 1965.
TRANGMAR, B. B.; YOST, R. S.; UEHARA, G. Application of geostatistics to spatial studies of soil properties. Advances in Agronomy, v. 38, n. 1, p. 45-94, 1985.
WEBSTER, R. Quantitative spatial analysis of soil in the field. Advances in Soil Science, v. 3, n. 1, p. 1-70, 1985. WILDING, L. P.; DREES, L. R. Spatial variability and pedology. In: WILDING, L. P.; SMECK, N. E.; HALL, G. F. (Ed.). Pedogenesis and soil taxonomy: concepts and interactions. New York: Elsevier, 1983. p. 83-116.
Received on September 30, 2008. Accepted on August 25, 2009.