http://www.uem.br/acta ISSN printed: 1806-2636 ISSN on-line: 1807-8672
Doi: 10.4025/actascianimsci.v37i1.23206
Repeatability and phenotypic stabilization of Panicum maximum
accessions
Janaina Azevedo Martuscello1*, Thiago Gomes dos Santos Braz2, Liana Jank3, Daniel de Noronha Figueiredo Vieira da Cunha1, Bruno Patrick da Silva Lima4 and Leandro Pereira de Oliveira4
1
Departamento de Zootecnia, Universidade Federal de São João Del-Rei, Av. Visconde do Rio Preto, s/n, 36300-000, São João Del Rei, Minas Gerais, Brazil. 2
Departamento de Zootecnia, Universidade Federal dos Vales do Jequitinhonha e Mucuri, Diamantina, Minas Gerais, Brazil.
3
Embrapa Gado de Corte, Campo Grande, Mato Grosso do Sul, Brazil. 4
Universidade Federal de Alagoas, Arapiraca, Alagoas, Brazil. *Author for correspondence. E-mail: janaina@ufsj.edu.br
ABSTRACT. The experiment aimed at determining repeatability coefficients for four methods (analysis of variance, principal components-correlation and covariance matrices and structural analysis), number of harvests necessary to increase accuracy and phenotypic stability of yield characteristics of accessions of
Panicum maximum. The experiment was conducted in a completely randomized design with 35 genotypes and three replications. Five cuts were made and material was weighed and dried to obtain total, stem, leaf and dead forage dry matter yields. The repeatability coefficients in the different methods, for the evaluated characteristics, ranged from 0.1867 and 0.6583. The estimates of repeatability coefficients obtained for the evaluated characteristics by analysis of variance were generally smaller than the ones obtained with the other methods. By the principal components (based on the covariance matrix), the estimates were usually larger than those for the other methods. Therefore, it is possible to recommend this method to estimate the coefficient of repeatability for traits evaluated in this study. Considering that levels of 80 or 90% of confidence in the evaluation of the relative superiority of the accessions for all the evaluated characteristics are satisfactory, five harvests are sufficient for the choice of the best accession.
Keywords: determination coefficients, forages, breeding.
Repetibilidade e estabilização fenotípica em acessos de
Panicum maximum
RESUMO. O experimento foi conduzido objetivando-se determinar os coeficientes de repetibilidade, por quatro métodos (Análise de Variância, de Componentes principais - matriz de correlação e covariância e a Análise estrutural), o número de cortes necessários para aumento de acurácia e a estabilização fenotípica de características de produção em acessos de Panicum maximum. O experimento foi conduzido em delineamento inteiramente casualizado com 35 genótipos e três repetições. Foram realizados cinco cortes e as amostras foram pesadas e secas para obtenção da produção de matéria seca total, de colmo, folhas e material morto. Os coeficientes de repetibilidade nos diferentes métodos, para todas as características, oscilaram entre 0,1867 e 0,6583. As estimativas da repetibilidade obtidas pelo método da análise de variância foram quase sempre menores que as obtidas pelos demais métodos. Pelo método dos componentes principais (baseado na matriz de covariância), as estimativas foram sempre maiores em relação aos demais métodos. Portanto, é possível recomendar esse método para estimativas do coeficiente de repetibilidade para as características avaliadas nesse estudo. Considerando satisfatórios os níveis de 80 ou 90% de confiabilidade para avaliação da superioridade relativa dos acessos para todas as características avaliadas, as cinco medições realizadas são suficientes para escolha do melhor acesso.
Palavras-chave: coeficiente de determinação, forrageiras, melhoramento.
Introduction
For animal production to be economically viable and competitive productivity must be increased and pasture management should be seen as a primary source of increment in profits. However, no management is suitable without the correct choice of the forage. In this context, the producer of the Agreste ecosystem lacks variability of cultivars to
During the selection process of new cultivars to be implemented in a specific pastoral ecosystem, it is important to ensure the genetic superiority of the selected cultivar. The analysis of successive measurements of a particular agronomic trait is important in the selection of perennial forage plants, since it is expected that the initial superiority or inferiority of a cultivar, in relation to others, be maintained along the measurements. Thus, the measure of consistency of the position in relation to the classification of individuals during successive measurements of a particular character is called repeatability (Turner & Young, 1969). According to Cruz and Regazzi (1997) repeatability can be defined as the correlation between successive measurements obtained from a same individual, with assessments made over time or space.
In perennial species propagated by apomixes (clonal reproduction), as in the case of Panicum maximum, the estimate of the repeatability coefficient indicates the degree of influence of the permanent effects on the phenotypic variation observed and allows the prediction of the performance of individuals (Di Renzo et al., 2000). Furthermore, the repeatability expresses the maximum value that the broad-sense heritability can achieve, since it expresses the proportion of phenotypic variance that is attributable to genetic differences confounded with the permanent effects that act on the cultivar. In this context, the repeatability coefficient will address the heritability coefficient when the variance provided by the permanent effects of the environment is reduced. Therefore, repeatability is an essential tool to guide breeding studies (Cruz & Regazzi, 1997; Shimoya et al., 2002).
When a characteristic presents high repeatability, there is an indication that a small gain in accuracy will be achieved with an increase in the number of repeated measurements. On the other hand, when repeatability is low, a large number of measurements will be required in order to achieve a satisfactory value of determination.
Thus, the aim of this work was to determine the repeatability coefficients for four methods (analysis of variance, principal components-correlation and covariance matrices and structural analysis), the number of harvests needed to increase accuracy and phenotypic stability of yield characteristics in
P. maximum accessions grown in the Agreste region of the Alagoas State.
Material and methods
The experiment was conducted in the experimental area of the Federal University of Alagoas / Campus Arapiraca, from July 2010 to July 2011. The city of Arapiraca is located in the region of the sub-humid Agreste, where the climate is of the As’ type according to Koppen climate classification, with a dry season in summer and rainy fall/winter. The soil of the experimental area, classified as oxisol (red-yellow latosol - (EMBRAPA, 2006) was collected and evaluated for chemical characteristics. Soil samples were collected in the layer 0-20 cm and sent to a specialized laboratory for analysis, which presented the following results: pH (H2O) = 5.4;
Ca+2 = 4.7 cmol
c dm-3; Mg+2 = 2.2 cmolc dm-3; Al+3
= 0.0 cmolc dm-3; H + Al = 4 cmolc dm-3; SB = 7.23
cmolc dm-3; CTC = 11.23 cmolc dm-3;V (%) = 64.4;
P = 68 cmolc dm-3 e K+ = 142 cmolc dm-3.
The experiment was conducted in a completely randomized design with 35 treatments, characterized by P. maximum genotypes PM04, PM10, PM11, PM13, PM14, PM15, PM17, PM18, PM19, PM20, PM21, PM22, PM23, PM25, PM30, PM32, PM33, PM34, PM35, PM36, PM37, PM38, PM39, PM40, PM41, PM43, PM44, PM45, PM46, PM47, PM271 (previously selected by Embrapa Beef Cattle) and cultivars Mombaça, Tanzânia, Massai and Milênio, and three replications. The experiment was established in 4 m2 plots (2 x 2 m),
spaced 1 m between plots. The cultivars were sown at a spacing of 10 cm between rows and 5 cm between plants. According to the results of the soil analysis, 20 kg ha-1 P
2O5 as superphosphate (applied
in the row), 100 kg ha-1 N (urea) and 80 kg ha-1 K
2O
(KCl) were applied (topdressing) to the soil used in the experiment. Fertilization with nitrogen and potassium was performed after complete establishment of the plants. After the harvests, maintenance fertilization consisted of 50 kg ha-1 N
(urea) and 30 kg ha-1 K
2O (KCl).
During the experimental period, five harvests per plot were done, four in the rainy season (July 19, 2010, September 5, 2010, June 3, 2011 and July 7, 2011) and one in the dry season (March 28, 2011). The plants were cut at 20 cm from the soil.
The repeatability coefficient (r) was estimated by four statistical procedures in order to evaluate the consistency of the estimate, allowing more reliable conclusions about the characteristics surveyed. The estimators of the repeatability coefficients were obtained using: method of analysis of variance, principal components method (based on the covariance or correlation matrix) and structural analysis (based on the correlation matrix).
To estimate the repeatability coefficient by the method of analysis of variance (ANOVA), the statistical model with two factors of variation was used:
ij j i
ij g a e
Y
in which μ = overall mean; gi = random effect of
the ith cultivar under the influence of the permanent
environment; aj = fixed effect of the temporary
environment on the jth measure; e
ij = effect of the
temporary environment associated to the jth measure
on the ith cultivar.
For this model, the coefficient of repeatability was determined as:
2 22 g g ' ij ij ' ij ij ˆ ˆ ˆ Y , Y V Y , Y cov r
where σ2
g is the covariance between repeated
measurements in each cultivar.
By the method of principal component analysis, the repeatability coefficient based on the correlation matrix and the matrix of phenotypic variances and covariances was estimated. The method of the correlation matrix was proposed by Abeywardena (1972) and is based on the attainment of the matrix of correlations between repeated measurements and subsequent estimation of the eigenvalues and the normalized eigenvectors. Among the estimated eigenvectors those that have the elements with the same sign and close magnitudes are identified, since this is the one that best expresses the tendency of the cultivars to maintain their relative positions in the various periods. The coefficient was estimated by the equation:
1 1 1 ˆ r
where ˆ1 is the eigenvalue of the correlation matrix associated to the eigenvector which elements have the same sign and similar magnitude and η is the number of measurements;
By the method based on the phenotypic variance and covariance, the repeatability coefficient was obtained by the equation:
1
2 2 1 Y Y ˆ ˆ ˆ ˆ r
where ˆ1 is the eigenvalue of the phenotypic variance and covariance matrices associated to the eigenvector whose elements have the same sign and similar magnitude, Y2 2ge2 is the variance of the character Y and η is the number of measures.
The method of the structural analysis based only on the interclass correlation matrix and was estimated by the equation:
1 1 ˆ'Rˆ r
where ˆ'Rˆ ˆ1 eigenvalue of the matrix of the intraclass correlations associated to the eigenvector which elements have the same sign and similar magnitude and ˆ' is the eigenvector associated to
1
ˆ
so that ˆ'ˆ 1 and η is the number of measures. For each characteristic, the minimum number of measurements necessary to achieve efficiency in the selection process (η0), based on the pre-determined
determination coefficients (80, 85, 90, 95 and 99%) was estimated by:
R
r r R o 2 2 1 1 where R2 = determination coefficients and r =
coefficient of repeatability.
The stability of phenotypic traits was evaluated using the methods of principal components obtained from the intraclass correlation matrix for the successive measurements, considering 2, 3, subsequently, until all n evaluations were performed. Therefore, n-1 analyses were done on two consecutive measures; n-2 analyses were done on three consecutive evaluations until reaching five measurements (Martuscello et al., 2007).
All analyzes were performed using the GENES software in the Biometrics section (Computational Genetics and Statistics Applicative).
Results and discussion
The coefficient of repeatability (r) observed for the
height (principal components method: correlation) and the lowest values for dry matter of dead/senescent forage (method of analysis of variance).
Generally, low repeatability was observed for the characteristic dry matter of dead/senescent forage, irrespective of the method used for estimating the coefficient. This may be explained by the fact that this characteristic presents high variation throughout the year, as reported in other studies (Cano et al., 2004; Martuscello et al., 2006). Furthermore, the low coefficient of repeatability may have occurred due to the higher accumulation of forage dead matter in the dry season, with consequent uneven distribution of that morphological component on the other harvests. Considering the accumulation of dead/senescent forage dry matter an undesirable trait in forage breeding and the low coefficient of repeatability observed for this trait in this study, the prerogative of choosing accessions that accumulate less dead forage dry matter may not be supported by the results obtained here.
The repeatability coefficients for plant height and total, leaf and stem dry matter yields, regardless of the method, may be considered medium to high (Table 1). These characteristics are important in breeding forage plants. Plant height is a characteristic that correlates with biomass yield and could be essential in indicating particular forage to the production system proposed, since shorter plants can be used in production systems with goats and sheep, while those that are taller may be indicated for cattle production. Lédo et al. (2008) observed repeatability coefficients between 0.603 and 0.748 for height of plots established with accessions of
P. maximum assessed by different estimation methodologies in 15 harvests.
The repeatability coefficient of stem dry matter yield ranged from 0.4458 (method of analysis of variance) to 0.6087 (principal components: covariance; Table 1). Stem accumulation is critical in the choice of the forage since higher values of stem dry matter yield necessarily indicates lower quality forage, considering that, at the level of rumen, stems have lower digestibility than leaves. Forage species that tend to elongate and accumulate
stems throughout the seasons should be considered inadequate in relation to the others, being those with higher yields and repeatability of leaf dry matter yields more indicated. The highest values of repeatability for stem dry matter yield indicate that accessions with higher accumulation of stems tend to exhibit this trait repeatedly, which prevents their choice in relation to the others. Thus, selection based on leaf dry matter yield tends to make the breeding process more efficient, especially in the final stage, where the evaluation of animal weight gain is the main indicator of the potential use of the plant.
Stem accumulation is a characteristic that directly influences the production of total dry matter yield, since all morphological components (leaf blade and stem) are considered. This is because stem elongation favors the exposure of leaf eaves to light, promoting higher accumulation of the total forage. It is observed in Table 1 that the coefficient of repeatability for total dry matter yield ranged from 0.4530 (method of analysis of variance) to 0.5238 (principal component method: covariance), with a coefficient of determination above 80%.
For leaf dry matter yield, the repeatability coefficients ranged from 0.4719 (method of analysis of variance) to 0.5150 (principal component method: covariance) and for percentage of leaves they ranged from 0.3119 (method of structural analysis) to 0.5772 (principal components method: covariance; Table 1). For these characteristics, the values of repeatability indicate reliability in identifying the best accessions, considering the five evaluations used. However, medium magnitude of the repeatability coefficient values of these characteristics may be explained by the variation in climatic conditions over repeated measurements. In this sense, to improve the confidence in the selection of this character, two strategies may be suggested: increasing directly the number of measurements and the use of measurements taken in the rainy and dry seasons as two distinct variables. This approach has been used by some breeders on forage breeding in Brazil (Botrel et al., 2000; Ferreira et al., 1999; Martuscello et al., 2009).
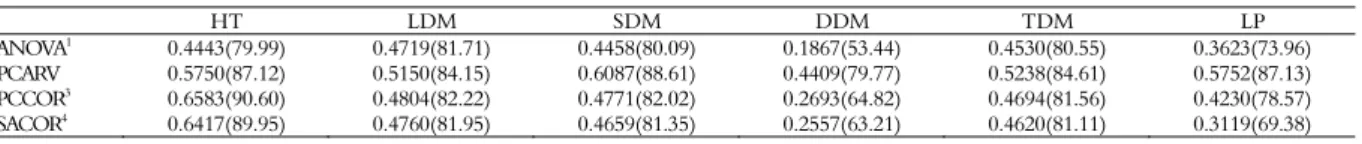
Table 1. Estimates of repeatability coefficient and coefficient of determination (in parentheses) of the characteristics plant height (HT), leaf dry matter yield (LDM), stem dry matter yield (SDM), dead/senescent forage dry matter yield (DDM), total dry matter yield (TDM) and percentage of leaves (LP) evaluated by four methods.
HT LDM SDM DDM TDM LP
ANOVA1 0.4443(79.99) 0.4719(81.71) 0.4458(80.09) 0.1867(53.44) 0.4530(80.55) 0.3623(73.96)
PCARV 0.5750(87.12) 0.5150(84.15) 0.6087(88.61) 0.4409(79.77) 0.5238(84.61) 0.5752(87.13)
PCCOR3 0.6583(90.60) 0.4804(82.22) 0.4771(82.02) 0.2693(64.82) 0.4694(81.56) 0.4230(78.57)
SACOR4 0.6417(89.95) 0.4760(81.95) 0.4659(81.35) 0.2557(63.21) 0.4620(81.11) 0.3119(69.38)
1analysis of variance; 2principal components analysis based on the residual variance and covariance matrices; 3principal components analysis based on the correlation matrix; 4structural
Regardless of the method used to estimate the coefficient of repeatability, the coefficients of determination of the evaluated characteristics ranged from 53.44 to 90.60% and may be classified as medium to high (Table 1). Since the coefficient of determination expresses the accuracy in predicting the actual value of the individual, the reliability in the selection of the best accessions of P. maximum, based, for example, on the phenotypic value of LDM, will be 84.15% (principal components method: covariance). Thus, five harvests were sufficient to achieve high reliability in predicting the performance of the different accessions.
It was found that the estimates of the repeatability coefficient obtained for the traits evaluated through the analysis of variance, were usually lower than the estimates obtained by the other methods (Table 1). It was also noticed that by the principal components method (based on the covariance matrix) these estimates were usually higher than those obtained for the other methods. Still, for all the evaluated traits, the estimates obtained for the four methods used demonstrated accuracy in the measures done and consistency in the superiority of the individuals. Martuscello et al. (2007) reported the advantages of the principal components method (based on the covariance matrix) to assess repeatability of agronomic characters in P. maximum. In addition, Cargnelutti Filho et al. (2004) evaluated P. maximum cultivars with and without sunshine restriction, and reported higher repeatability coefficients of yield characteristics when using the principal components method (based on the covariance matrix). According to Martuscello et al. (2007), differences among the estimates of the coefficients of repeatability from the methods used indicate the need for using the various methods available to obtain a precise interval within which, most likely, the actual value for the parameter may be found. Moreover, the identification of the most appropriate methods to evaluate forage traits may also be used as a strategy to improve the estimate of the parameter.
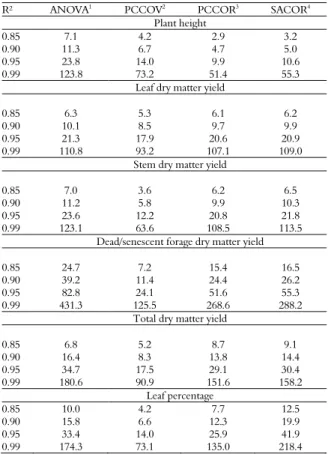
Table 2 shows the simulation of the number of measurements required to obtain different coefficients of determination of the characteristics evaluated in P. maximum accessions using the four methods. Note that as the accuracy increases when compared to the prediction of the real value of the evaluations with the methods used the number of measurements for all the characteristics increases considerably.
Data (Table 2) suggests that the attempt to increase accuracy beyond 95% would require a great increase in the number of measurements, which in
turn would add little in terms of precision, thus not justifying its use. With the selection of P. maximum
hybrids, Resende et al. (2004) obtained an estimate of 80% accuracy for leaf dry matter yield, with four years of harvests, but with low increase in selection efficiency after three years of evaluation (15 harvests). For Brachiaria brizantha, Basso et al. (2009) obtained 80% accuracy for this variable with six to 14 harvests, depending on the genotypes evaluated in different locations. Martuscello et al. (2007) in a study with half-sib hybrids of P. maximum, reported that the number of harvests needed to characterize dry matter yield with 80% probability of its actual value was a maximum of four (for the method of analysis of variance), and only one and two , for the method of principal components (based on the covariance matrix).
Table 2. Number of measurements of agronomic traits in hybrids of Panicum maximum in four methods of estimating the coefficient of repeatability.
R² ANOVA1
PCCOV2
PCCOR3
SACOR4
Plant height
0.85 7.1 4.2 2.9 3.2
0.90 11.3 6.7 4.7 5.0
0.95 23.8 14.0 9.9 10.6
0.99 123.8 73.2 51.4 55.3
Leaf dry matter yield
0.85 6.3 5.3 6.1 6.2
0.90 10.1 8.5 9.7 9.9
0.95 21.3 17.9 20.6 20.9
0.99 110.8 93.2 107.1 109.0
Stem dry matter yield
0.85 7.0 3.6 6.2 6.5
0.90 11.2 5.8 9.9 10.3
0.95 23.6 12.2 20.8 21.8
0.99 123.1 63.6 108.5 113.5
Dead/senescent forage dry matter yield
0.85 24.7 7.2 15.4 16.5
0.90 39.2 11.4 24.4 26.2
0.95 82.8 24.1 51.6 55.3
0.99 431.3 125.5 268.6 288.2
Total dry matter yield
0.85 6.8 5.2 8.7 9.1
0.90 16.4 8.3 13.8 14.4
0.95 34.7 17.5 29.1 30.4
0.99 180.6 90.9 151.6 158.2
Leaf percentage
0.85 10.0 4.2 7.7 12.5
0.90 15.8 6.6 12.3 19.9
0.95 33.4 14.0 25.9 41.9
0.99 174.3 73.1 135.0 218.4
1analysis of variance; 2principal components analysis based on the residual variance and
covariance matrices; 3principal components analysis based on the correlation matrix;
4structural analysis based on the correlation matrix.
components - structural analysis and correlations). On the other hand, for dead/senescent forage dry matter yield, the five measurements done were not sufficient to achieve 85% efficiency in the selection of the accessions. Accordingly, to achieve such a determination, between 7 and 25 harvests are necessary.
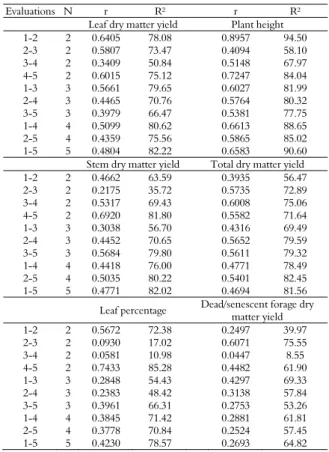
Table 3 presents the results of the phenotypic stability of the characteristics in the five harvests evaluated. Leaf dry mater yield and plant height presented the greatest coefficients of repeatability when harvests one and two were correlated (Table 3). For stem dry matter yield and leaf percentage, the highest repeatability coefficients were observed when harvests four and five were correlated, and, for total dry matter yield, when harvests three and four were correlated. For dead/senescent forage dry matter yield, a low repeatability coefficient was observed independently of the harvest correlations, which indicates non-stabilization of the genotypes for this trait.
Table 3. Stability of phenotypic traits in accessions of Panicum
maximum.
Evaluations N r R² r R²
Leaf dry matter yield Plant height
1-2 2 0.6405 78.08 0.8957 94.50
2-3 2 0.5807 73.47 0.4094 58.10
3-4 2 0.3409 50.84 0.5148 67.97
4-5 2 0.6015 75.12 0.7247 84.04
1-3 3 0.5661 79.65 0.6027 81.99
2-4 3 0.4465 70.76 0.5764 80.32
3-5 3 0.3979 66.47 0.5381 77.75
1-4 4 0.5099 80.62 0.6613 88.65
2-5 4 0.4359 75.56 0.5865 85.02
1-5 5 0.4804 82.22 0.6583 90.60
Stem dry matter yield Total dry matter yield
1-2 2 0.4662 63.59 0.3935 56.47
2-3 2 0.2175 35.72 0.5735 72.89
3-4 2 0.5317 69.43 0.6008 75.06
4-5 2 0.6920 81.80 0.5582 71.64
1-3 3 0.3038 56.70 0.4316 69.49
2-4 3 0.4452 70.65 0.5652 79.59
3-5 3 0.5684 79.80 0.5611 79.32
1-4 4 0.4418 76.00 0.4771 78.49
2-5 4 0.5035 80.22 0.5401 82.45
1-5 5 0.4771 82.02 0.4694 81.56
Leaf percentage Dead/senescent forage dry
matter yield
1-2 2 0.5672 72.38 0.2497 39.97
2-3 2 0.0930 17.02 0.6071 75.55
3-4 2 0.0581 10.98 0.0447 8.55
4-5 2 0.7433 85.28 0.4482 61.90
1-3 3 0.2848 54.43 0.4297 69.33
2-4 3 0.2383 48.42 0.3138 57.84
3-5 3 0.3961 66.31 0.2753 53.26
1-4 4 0.3845 71.42 0.2881 61.81
2-5 4 0.3778 70.84 0.2524 57.45
1-5 5 0.4230 78.57 0.2693 64.82
r = coefficient of repeatability.
Independent of the characteristic evaluated and the harvest combination, the correlation of harvest three with the others, tended to decrease the coefficient of repeatability of the characteristics
(Table 3), which may be explained by the season of harvest. The third harvest was performed at the end of the dry season, and it is known that there are changes in the ratio of morphological components of the plant along the seasons. The use of stabilized genotypes when obtaining repeatability estimates is of extreme importance.
There is, in some cases, the possibility of a trait to be governed by different gene sets, and genes are more or less active depending on the state of development of the individuals. In some cases, the inclusion of evaluations in an early stage where there is no expression of the full genetic potential of the plant, or later evaluations, where the forage already presents a certain degree of senescence, the repeatability may be underestimated. Thus, if the measured genotype is not stabilized, the variation within individuals will contain a substantial proportion of the variance of the genotype versus temporary environment interactions, and an increase in the number of measurements in order to reduce the variation within individuals may not be advantageous, since the additional variance may be sufficient to neutralize the reduction of the component.
Conclusion
For a reliable selection (80% probability) based on total, leaf and stem dry matter yields and plant height of P. maximum accessions in the region of the Agreste of Alagoas State, at least five harvests are necessary. Using the principal components (based on the covariance matrix), the estimates were usually larger than those of the other methods. Therefore, it is possible to recommend this method to estimate the coefficient of repeatability for traits evaluated in this study. The inclusion of dry season harvest decreases the estimate of the repeatability coefficient.
Acknowledgements
We are grateful to the National Council for Scientific and Technological Development (CNPq) for financial support
References
Abeywardena, V. (1972). An application of principal component analysis in genetics. Journal of Genetics, 61(1), 27-51.
Basso, K. C., Resende, R. M. S., Valle, C. B., Gonçalves, M. C. & Lempp, B. (2009). Avaliação de acessos de
Botrel, M. A., Ferreira, R. P., Cruz, C. D., Pereira, A. V., Viana, M. C. M., Rocha, R. & Miranda, M. (2000). Estimativas de coeficientes de repetibilidade para produção de matéria seca em cultivares de alfafa, sob diferentes ambientes. Revista Ceres, 47(274), 651-663. Cano, C. C. P., Cecato, U., Canto, M., Rodrigues, A. B.,
Jobim, C. C., Rodrigues, A. M., Galbeiro, S. & Nascimento, W. (2004). Produção de forragem do capim-tanzânia (Panicum maximum Jacq. cv. Tanzânia-1) pastejado em diferentes alturas. Revista Brasileira de Zootecnia, 33(6), 1949-1958.
Cargnelutti Filho, A., Souza Castilhos, Z. M. & Savian, L. S. J. F. (2004). Análise de repetibilidade de caracteres forrageiros de genótipos de Panicum maximum, avaliados com e sem restrição solar. Ciencia Rural, 34(3), 1-8. Cruz, C. D. & Regazzi, A. J. (1997). Modelos biométricos
aplicados ao melhoramento genético (Vol. 2): Ed. UFV. Di Renzo, M. A., Ibanez, M. A., Bonamico, N. C. &
Poverene, M. M. (2000). Estimation of repeatability and phenotypic correlations in Eragrostis curvula. The Journal of Agricultural Science, 134(2), 207-212.
EMBRAPA. (2006). Sistema brasileiro de classificação de solos
(Vol. 412).
Ferreira, R. P., Botrel, M. A., Pereira, A. V. & Cruz, C. D. (1999). Avaliação de cultivares de alfafa e estimativas de repetibilidade de caracteres forrageiros. Pesquisa Agropecuária Brasileira, 34(6), 995-1002.
Lédo, F. J. d. S., Pereira, A. V., Souza Sobrinho, F. d., Auad, A. M., Jank, L. & Oliveira, J. S. (2008). Estimativas de repetibilidade para caracteres forrageiros em Panicum maximum. Ciência Agrotecnologia, 32(4), 1299-1303.
Martuscello, J. A., Fonseca, D. M. d., Nascimento Júnior, D., Santos, P. M., Cunha, D. & Moreira, L. d. M.
(2006). Características morfogênicas e estruturais de capim-massai submetido a adubação nitrogenada e desfolhação. Revista Brasileira de Zootecnia, 35(3), 665-671.
Martuscello, J. A., Jank, L., Fonseca, D. M. d., Cruz, C. D. & Cunha, D. d. N. F. V. (2007). Agronomic characters repeatability in Panicum maximum Jacq. Revista Brasileira de Zootecnia, 36(6), 1975-1981.
Martuscello, J. A., Jank, L., Fonseca, D. M. d., Cruz, C. D. & Cunha, D. d. N. F. V. (2009). Among and within family selection and combined half-sib family selection in Panicum maximum Jacq. Revista Brasileira de Zootecnia, 38(10), 1870-1877.
Resende, R. M. S., Jank, L., Valle, C. B. d. & Bonato, A. L. V. (2004). Biometrical analysis and selection of tetraploid progenies of Panicum maximum using mixed model methods. Pesquisa Agropecuária Brasileira, 39(4), 335-341.
Shimoya, A., Pereira, A. V., Ferreira, R. d. P., Cruz, C. D. & Carneiro, P. C. S. (2002). Repetibilidade de características forrageiras do capim-elefante. Scientia Agricola, 59(2), 227-234.
Turner, H. N. & Young, S. S. (1969). Quantitative genetics in sheep breeding (Vol. 1). London: Macmillan & Co. Ltd.
Received on March 8, 2014. Accepted on October 3, 2014.