PLEASE NOTE
:
This is the author’s version of the manuscript accepted for publication in
European Journal of
Psychology of Education
. Changes resulting from the publishing process, namely editing,
corrections, final formatting for printed or online publication, and other modifications resulting
from quality control procedures, may have been subsequently added.
Abstract
Emotional intelligence (EI) has emerged as an important factor in an adolescent’s school
success. This study examines the developmental trajectories of EI in a Portuguese
secondary school, comparing an EI performance measure with an EI self-report
measure. Within a 3-wave longitudinal design, 395 students (Mage = 15.4; SD = 0.74)
completed both the Emotional Skills and Competence Questionnaire (ESCQ) and the
Vocabulary of Emotions Test (VET). Results revealed that EI exhibited different
developmental trajectories during late adolescence according to the type of measure
used: while students’ VET levels evidenced an increase during secondary school, the
ESCQ levels kept stable during this period. Moreover, students’ verbal ability, gender
and type of school (public vs. private) had no significant effect on their rate of EI change,
whereas students from lower socio-cultural and professional status backgrounds had
higher rates of growth compared to higher status adolescents.
1. Introduction
The transition to adolescence is recognised, both scientifically and tacitly, as a time of
considerable biological, psychological and social-cognitive changes, during which
individuals expand their social contexts, develop new roles within peer and family
contexts and search to define their identity (Lerner & Steinberg, 2009). Adolescence
constitutes a challenging developmental period, as well as a very stressful and
demanding one (Somerville, Jones, & Casey, 2010), requiring overwhelming efforts.
Researchers recently have become eager to explore the factors that allow adolescents
to adapt and to cope effectively with their demanding new tasks, and move forward
successfully in the developmental process (Lerner, Almerigi, Theokas, & Lerner, 2005).
Emotional intelligence (EI) as a new influential field has gained relevance in the
explanation of adolescents’ well-being and adaptation (Van der Zee, Thijs, & Schakel,
individual’s outcomes and achievement results (Brackett, Rivers, & Salovey, 2011).
Emotional intelligence can play a crucial role in mental and physical health (Schutte,
Malouff, Thorsteinsson, Bhullar, & Rooke, 2007); work and academic performance (Van
Rooy & Viswesvaran, 2004); and quality of social relationships (Kotsou, Nelis, Grégoire,
& Mikolajczak, 2011). Particularly in the academic context, the development of emotional
competencies contributes to students’ social and academic adjustment (Durlak,
Weissberg, Dymnicki, Taylor, & Schellinger, 2011; Greenberg et al., 2003), since
emotions can either block or potentiate students’ learning and consequently affect their
academic success (Pekrun, Goetz, Titz, & Perry, 2002). Emotional learning supports the
development of students’ interpersonal and cognitive skills that are required to achieve
appropriate social and developmental goals (Zins, Weissberg, Wang, & Walberg, 2001):
the reinforcement of students’ self consciousness, self-control, social awareness,
interpersonal skills and responsible decision making (CASEL, 2005) will have an impact
on academic adjustment mirrored by more positive conduct, fewer behavioural issues,
less distress and better results in evaluations (Greenberg et al., 2003). In the long run,
emotional learning will provide students with the ability to become more responsible and
informed, and more empathetic, productive and active in society and citizenship (Zins et
al., 2001).
Recently, several social and emotional learning school-based programmes have
been described in the literature and have reported positive effects on the development
of students’ social and emotional skills (Durlak et al. 2011). Promising results have
emerged in this field supporting the theoretical development of these competencies in
children (Denham, Wyatt, Bassett, Echeverria, & Knox, 2009), adolescents (Ruini et al.,
2009), and even college students (Nelis, Quoidbach, Mikolajczak, & Hansenne, 2009).
Currently, more attention has been directed towards EI’s conceptualisation and
assessment; however, the developmental trajectories of EI still lack proper exploration
in the literature (Denham, 1998; Saarni, 1999). Therefore, assuming that school stands
and competencies (Mayer & Salovey, 1997), this study aims to explore the
developmental trajectories of EI throughout secondary school by conducting latent
growth curve (LGC) analyses.
1.1. Emotional intelligence: through concept to assessment
Emotional Intelligence is usually considered as an ability “…to monitor one’s own and
others emotions, to discriminate among them and to use the information to guide one’s
thinking and actions” (Salovey & Mayer, 1990, p. 189). However, besides the more
commonly accepted ability-based perspective, EI has alternatively been conceptualised
as a trait (Petrides & Furnham, 2000), or as an integration of mixed models that include
both ability and personality aspects (Bar-On, Tranel, Denburg, & Bechara, 2003).
Over the last decade, significant efforts have been made to address the
assessment of EI and several measures have been developed (Ciarrochi, Chan, Caputi,
& Roberts, 2001), grounded in diverse theoretical conceptualisations of EI which have
reflected various inconsistencies in the field of EI measurement (Zeidner, Roberts, &
Matthews, 2002). Several authors have suggested that EI’s assessment by self-report
measures should not be based upon mixed models of EI (Boyatzis, Goleman, & Rhee,
2000) since self-report measures only appraise individuals’ own beliefs about their
capacities (Ciarrochi et al., 2001). However, if assessing EI conceptualised as an ability
model (Mayer, Caruso, & Salovey, 1999), the ability testing should be applied with
objective performance measures (Ciarrochi, et al., 2001) in order to evaluate the
individual’s actual capacity to perform, similarly to any other measure of intelligence.
Nonetheless, the fact that frequently both performance and self-report measures are
grounded in the ability-based perspective of EI should support the development of more
studies comparing both types of measures.
Regardless of this discussion, the literature has been questioning whether the two
Convergent validity studies, using EI self-report and performance measures based on
different theoretical backgrounds, have reported weak correlations (Brackett & Mayer,
2003). Nevertheless, even when supported by the same EI theoretical model, results
tend to confirm the lack of correlation between some factors (Lopes, Salovey, & Straus,
2003). These findings seem to be consistent with those in the general intelligence field,
whereas weak correlations between different types of measures were found (Furnham
& Rawles, 1999).
1.2. Emotional intelligence developmental trajectories in secondary schools
Over the last decade, along with the increasing interest in the introduction of social and
emotional abilities teaching in schools, questions related to EI’s development have been
raised. While recent results tend to confirm the development and plasticity of emotional
competencies as outcomes of specific programmes, the developmental trajectory of
emotional skills still requires investigation. Although there is evidence that EI seems to
be mostly nurtured and that emotional knowledge can be developed through a process
of maturation (Cooper, 1997), including learning and training as part of an individual’s
growth process (e.g., Denham, 1998; Mayer et al., 1999; Saarni, 1999) EI’s
developmental phases throughout the life span have never been documented. In search
of a similar cognitive development pattern associated with age, Mayer, Caruso, and Salovey (1999), using the ability-based measure MEIS, noted that adults scored higher in EI skills than adolescents. However, those findings arose from a study with a cross-sectional design that limited the conclusions able to be drawn related to EI’s development criterion. Furthermore, research with EI’s trait measures (TEI; Keefer,Holden, & Parker, 2013) indicated that, compared to ability-based measures, EI can have different
developmental trajectories with a possible decrease in EI competencies over time. The
when assessing their own and their peers’ competencies, which can lead to a decrease
in their self-perceptions (Harter, 2012). However, although some studies found a
decrease in particular EI skills (Sallquist et al., 2009), inter and intrapersonal studies
exploring the development of EI in the academic context tend to be scarce or
inconsistent.
Most studies have referred to the socialisation of particular emotional
competencies, such as emotion perception, and understanding or self-regulation
(Denham, 1998; Saarni, 1999). In light of the lack of a supportive body of EI’s
developmental research, this present 3-wave longitudinal study intends to study EI
developmental trajectories throughout the secondary school period. Moreover, by using
and comparing two types of ability-based measures (performance vs. self-report) it is
expected that different features of EI developmental paths may be demonstrated
throughout the secondary school period.
Given the association of EI with other forms of intelligence, in particular the
crystalised intelligence domain, this study will explore the impact that students’ verbal
abilities have upon the evolution of an EI’s performance measure throughout secondary
school.
The effects on the development of EI of particular socio-demographic and type of
school variables needs further consideration. For example, gender, although repeatedly
documented as having an impact on EI levels (mostly favouring girls e.g., Costa, Faria,
& Takšić, 2011; Goldenberg, Matheson, & Mantler, 2006), may result in different
development EI skills paths. Higher socio-economic status is often related to higher EI
skills (Côté, Gyurak, & Levenson, 2010), but less is known about its influence on EI
trajectories over time. Moreover, research exploring differences in students of public and
private school systems has shown that differences in the levels of achievement of private
over public school students remain small after controlling for achievement gains (Witte,
1992) and school environment (Cherchye, Witte, Ooghe, & Nicaise 2010); in some
2007). Therefore, students attending different types of schools can be exposed to
different cognitive or social-emotional learning strategies and follow different EI
developmental paths.
Consequently, the present study will explore the effects on EI development at
secondary school level of socio-demographic variables, such as students’ gender and
socio-cultural and professional status (SCS; SPS), as well as the type of school.
This research aims to (1) explore EI’s developmental trajectories in a secondary
school, (2) use and compare two EI types of measures, self-report and performance, and
(3) explore the moderator effect of specific sociodemographic and type of school
variables on the development of EI.
2. Method
2.1. Participants
A total of 395 Portuguese secondary school students (213 female and 182 male)
took part in a longitudinal study throughout the 3 years of secondary school (10th to 12th
grade). At the 10th grade participants ranged from 14 to 17 years-old (M = 15.4; SD =
.74) and the majority were included in the high sociocultural (51.6%) and high
professional status (51.9%), attending public schools (60.5%) and scientific and
technological courses (48.4%).
2.2. Measures
2.2.1. The Vocabulary of Emotions Test (VET) is a performance measure based in the third branch of EI’s ability model, Understand
Herambašić and Velemir (2003) in the Croatian academic context with
secondary school students, VET comprises 35 items, corresponding to
emotional saturated target-words, and follows the same format of any other
classic vocabulary test. The task presented request the subject to choose
one adjective (from 6 available) which has the closest meaning to the target
word (emotion). For example, considering the target word “touching” the
subject has to choose the adjective with the closest meaning of the target
word from the following: “gentle”; “moving”; “proud”; “sensitive”; “bashful”;
“ruthless”. This test has a correct answer, based on a solution from a
Croatian dictionary. The original version of VET revealed good
psychometric properties: moderate correlations with other Intelligence tests
(California Tests of Mental Maturity – Vocabulary Test – r = .67, p = .00and
Logical Thinking – r = .33, p = .00), and other EI tests (Analysis of Emotions
Test – r = .46, p = .00), and 44% of specific predictive power over classic
intelligence tests. Also, results have shown that VET has proper reliability
(α = .90) (Takšić & Mohorić, 2008). The Portuguese adaptation of the
instrument (Costa et al., 2011) has demonstrated good psychometrics
properties: appropriate VET’s item difficulty (M = .55; SD = .22), satisfactory
internal consistency (.71) and differential validity (presenting both gender
and cultural differences – favoring Portuguese students over Croatian ones
and, in overall, girls).
2.2.2. TheEmotional Skills and Competence Questionnaire (ESCQ)
is a 42-item self-report measure, based on Mayer and Salovey’s (1997) EI
model, that comprises 3 subscales: Perceive and Understand Emotion
(PUE; 14 items - “I am able to tell the difference if my friend is sad or
disappointed”), Express and Label Emotion (EE; 14 items - “I can easily
items – “I can maintain a good mood, even when the people around me are
in a bad mood”). The instrument was originally developed by Takšić,
Mohorić and Duran (2009) in the Croatian context but has been adapted
and validated to several cultural contexts (Faria et al., 2006; Takšić et al.,
2009). In fact, across different studies, ESCQ has repeatedly revealed
good psychometric properties: confirming the three-factor structure
underlying ESCQ dimensions, revealing good reliability (between .72 and
.92), positive correlations between the dimensions (between .49 and .54)
(Faria et al., 2006; Takšić et al., 2009) and presenting absolute and relative
satisfactory fit indices (NNFI=.93; CFI=.94; RMR=.04; RMSEA=.04;
Stocker & Faria, 2012).
2.3. Procedure
After schools and their head teachers formally accepted this research, informed
consents were acquired from students’ parents for their personal assurance. All
participants filled out the TVE and the ESCQ individually in their classrooms, with the
presence of the researcher and students’ teacher, after brief group instructions on the
answer formats. The purpose of the study as well as the confidentiality and anonymity
guaranties were explained to the participants. The administration lasted on average 25
minutes. Student’s verbal-ability indicator was based in their final Portuguese grade in
the end of the first secondary school year (10th grade).
2.4. Data analysis
Ideal for exploring longitudinal change in behavior, since it is based in the study of
individual differences in developmental functions, latent growth curve modeling (LGM;
throughout the secondary school. The individual growth for EI is a function of a latent
intercept and a latent slop. The latent intercept corresponds to the initial status of
student’s EI at 10th grade (time 1; baseline). The latent intercept reflects the average
initial value at the start of the longitudinal change process. The second factor, the latent
slope, represents the rate of change (increase or decrease) in EI over the period of study
(Duncan et al., 2006).
Moreover, with LGC models it is possible to explore if supposed predictors are able
to explain the variance in the growth process. In this study it was explored the impact
that student’s gender, sociocultural and professional status, and type of school have in
EI changes throughout secondary school level.
The LGC models analyses included two steps and were tested with AMOS 22.0
program using maximum likelihood estimation. Firstly, it was explored the individual
change in EI (both self-report and performance measures) throughout the 3-years period
- the unconditional growth curve model, that focused on the factor loadings’ intercept and
slope. Next, the model was improved by adding a predictor variable (the conditional
model). In order to reduce the possibility of Error Type I, only if the level of significance
confirmed the differences between the new conditional model and the unconditional one,
it would be taken the following step: the analysis of the individual trajectories with the
influence of the selected predictors. The goodness of fit of the LGC models were
evaluated considering the following indices (Hu & Bentler, 1999): Chi-square statistics,
root-mean-square error of approximation (RMSEA) of .06 or less, comparative fit index
(CFI) and the Tucker-Lewis Index (TLI, or Non-Normed Fit Index: NNFI): best if above
3. Results
3.1. Descriptive results
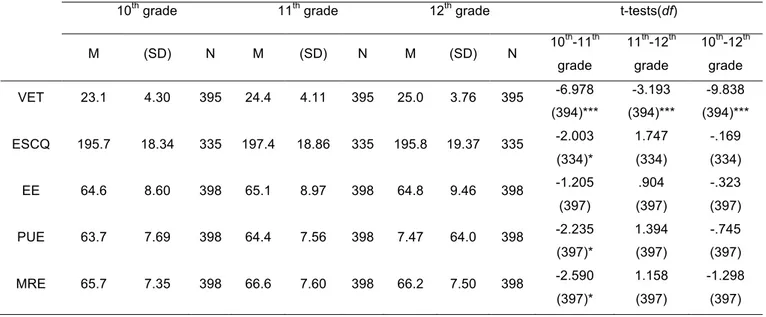
To assess the global change in EI’s levels between the three-years of secondary
school, descriptive statistics were performed in each year (Table 1). The EI levels of the
performance measure, VET, increased continuously from 10th to 12th grade, reaching at
the 12th grade the higher average level of VET.
The self-report measure, ESCQ, registered a slight increase from 10th to 11th grade
(Table 1), reaching at 11th grade the highest level and kept stable through the final period
of secondary school. While the Perceive and Understand Emotion (PUE) and Manage
and Regulate Emotion (MRE) dimensions of ESCQ revealed a significant increase from
10th to 11th grade, the Express and Label Emotion (EE) dimension did not prove to
change over time. These results substantiated further LGC analyses to estimate whether
these patterns of changes could be confirmed in longitudinal models.
(Insert Table about 1 here)
3.2. Individual trajectories
The LGC model identifies the trajectories of changes of EI’s evolution during the
three-year measurement points of secondary school (10th, 11th and 12th grade).
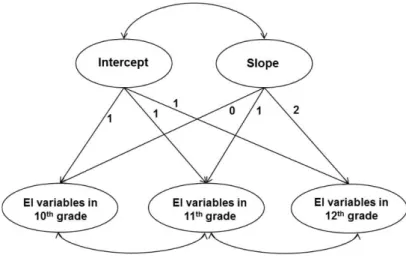
An unconditional linear growth model, with the factor loadings of the intercept
constrained to 1 and the factor loadings of the slope constrained to 0, 1 and 2, was
(Insert Figure about 1 here)
3.2.1. VET: EI’s performance measure.
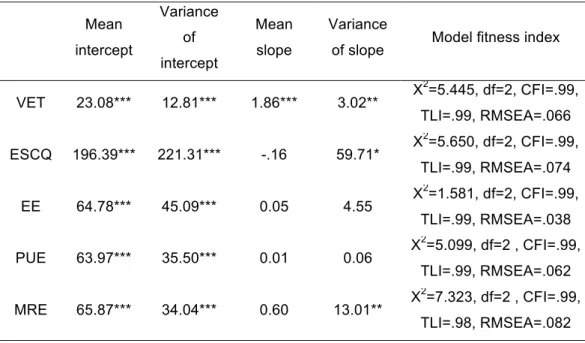
The three-year unconditional model of VET was analyzed (Figure 1). The linear
growth model revealed a good fit to the data (X2=5.445, df= 2; X2/df=2.722, CFI=.99,
RMSEA=.066; cf. Table 2). The significant and positive mean slope indicated student’s
growth in VET levels throughout the secondary school (1.86, p < .001). Student’s had a
higher development of EI’s skills from 10th to 11th grade (32%), although they had
continued to increase until 12th grade (12%). Moreover, the variances of the latent
intercept and slope were significant (p < .001) indicating variability around the average
intercept and inter-individual differences in the change trajectories, respectively (Byrne,
2012). This fact justifies the exploration of conditional models with the addition of
variables that could explain the variation in the individual trajectories. Those students
with lower levels of EI experienced a higher growth throughout the secondary school
period (- 3.21, p = .002).
(Insert Table 2 about here)
3.2.2. ESCQ: EI’s self-report measure.
The viability of the linear development model of ESCQ was calculated through the
unconditional model and displayed good results (X2=5.650, df= 2, X2/df=2.825, CFI=.99,
student’s ESCQ levels were stable throughout the secondary school (-.162, p = .101).
The fact that the variances of the intercept and slope of ESCQ were significant, indicating
inter-individual differences in the development of EI, lead to further analyses with ESCQ
LGC conditional models. Moreover, the non-significant covariance between the intercept
and slope (-12.79, p = .535) demonstrated that there is no relation between the student’s
initial level of ESCQ and EI’s development throughout the assessed school period.
Moreover, the unconditional model estimated separately for the three ESCQ
dimensions revealed good fit to the data: EE (X2=1.581, df=2, CFI=.99, TLI=.99,
RMSEA=.038; cf. Table 2); PUE (X2=5.099, df =2 , CFI=.99; cf. Table 2); MRE (X2=7.323,
df =2 , CFI=.99, TLI=.98, RMSEA=.082; cf. Table 2). The non-significant mean slope in
the three dimensions indicated that students, similarly to ESCQ total scale, did not
increase these competencies during secondary school (cf. Table 2). The variances of
the latent intercept were significant (p < .001) indicating variability around the average
intercept for the three dimensions and the variance of the slope was significant for the
MRE dimensions exposing the inter-individual differences in the change trajectories.
Inter-individual variability was found in the unconditional models which lead to
exploratory analyses of the effect of some socio-demographic and type of school’s
variable predictors.
3.3. Predictors of EI’s individual trajectories
In order to identify the predictors of the individual differences in the evolution of EI
during the secondary school period, socio-demographic and type of school variables
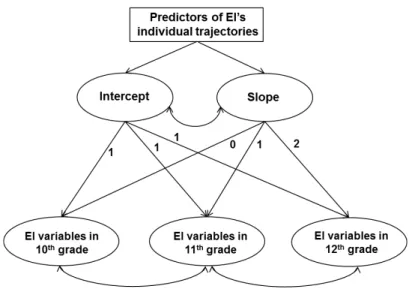
were added to the linear growth model. Several conditional linear growth models were
estimated to both EI’s variables (VET and ESCQ and dimensions; cf. Figure 2).
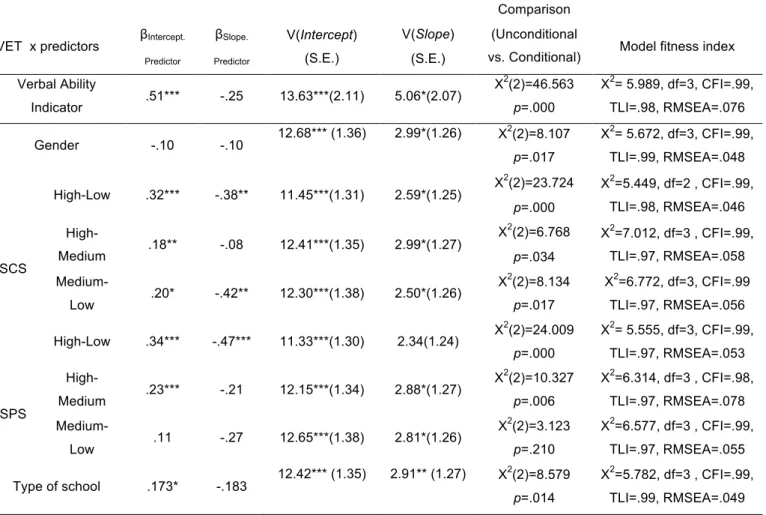
3.3.1. Predictors of VET’s individual trajectories.
First-of-all in order to explore the influence that students’ verbal abilities could have
in the explanation of VET levels’ evolution, a conditional model with the verbal ability
indicator as a predictor of EI’s individual trajectories was estimated (Figure 2). The
introduction of the verbal ability indicator improved VET’s conditional model (p < .001, cf.
Table 3). These results lead to the analyses of inter-individual differences in VET’s
development throughout the explored period. The verbal-ability indicator’s conditional
model revealed that students with better language skills had higher initial levels in VET
(β Intercept.Verbal ability indicator = .51, p < .001), but there were no evidence however, that both
groups had different rates of growth during the secondary school period (β Slope.Verbal Ability
indicator = -.25, p =.057).
Separately conditional models with gender, SCS, SPS, and type of school as
predictors of EI’s individual trajectories were used to estimate whether different groups
influenced changes on EI over time (Figure 2). Every model fitted the data very well (cf.
Table 3). In general, all the model comparisons proved that the new conditional models
with the proposed predictors were better explaining EI’s development throughout the
secondary school (p < .05, with the exception of Medium-Low SPS model, cf. Table 3),
which allowed the pursuit of the inter-individual differences in VET’s changes over time.
The gender conditional model revealed that boys and girls did not differ in their initial
levels of VET (β Intercept.Gender = -.10, p =.10) and in their changes over time (β Slope.Gender =
-.10, p =.381). The SCS and SPS conditional models of VET indicated that in general,
student’s with higher status had better levels of VET in 10th grade (β Intercept.SPS & SCS = p
<.05, cf. Table 3) and those students from lower SCS had a higher rate of growth during
the secondary school when compared to medium and higher status and lower SPS when
compared to higher status (β Slope.NSP & NCS = p < .05, cf. Table 3). Also, concerning the
type of school students attend to, students from private schools have higher levels of
VET in 10th grade when compared to students from public schools. There were no
school period. Moreover, all the conditional models analyzed acknowledged other
sources of variability both in average intercept and in inter-individual changes over time
(V (Intercept) and V (Slope) = p <.05).
(Insert Table 3 about here)
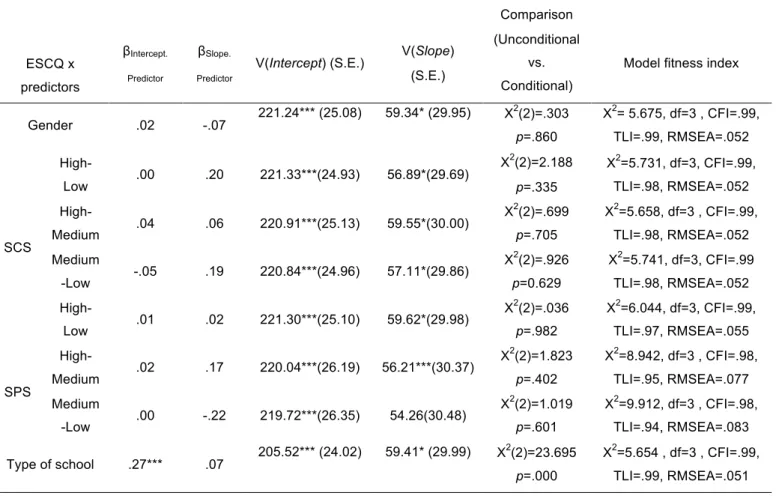
3.3.2. Predictors of ESCQ individual trajectories.
3.3.2.1. ESCQ individual trajectories.
The previous conditional models were reproduced to explore which of the proposed
predictors exerted influence in ESCQ individual trajectories throughout secondary school
(Figure 2). Although every model proved a good fit to the data (cf. Table 4), only the type
of school model comparison evidenced that the addiction of this predictor actually
improved the explanation of EI’s development over time (p < .001, cf. Table 4). In fact,
further analyses of the type of school conditional model demonstrated that students from
private schools had higher levels of ESCQ in 10th grade when compared to the students
of public school (β Intercept.Type of school = p <.01, cf. Table 4), but that the type of school
students attended to did not have impact on the change of their ESCQ level during the
secondary school (β Slope.type of school) = p >.05, cf. Table 4). Also, other sources of variability
both in intercept and slope were recognized by the conditional model (V (Intercept) and
V (Slope) = p < .05).
(Insert Table 4 about here)
The conditional models of gender, SCS, SPS, and type of school as predictors of EE,
PUE and MRE individual trajectories were estimated (Figure 2). Similarly to the total
ESCQ conditional models, every model fitted the data well, however, only the type of
school conditional model in the three dimensions, the SPS high-low model in the PUE
and MRE and also the SPS high-medium model for the PUE conditional model (p < .05)
met the assumption of explanation improvement over the initial unconditional model. The
following analysis proved that students from higher SPS had higher levels of PUE
(βIntercept.SPS High-Low = .20, p < .01), and MRE (βIntercept.SPS High-Low = .19, p < .01) in 10th grade
than the students from the lower status and even than the students from medium status
in PUE (βIntercept.SPS High-Medium = .13, p <.01). Also, the type of school conditional model
demonstrated that students from private schools had higher levels of EE (βIntercept.Type of
school = .20, p < .00), PUE (βIntercept.Type of school = .23, p < .00) and MRE (βIntercept.Type of school =
.15, p < .01), in the initial measurement point, but then again did not have impact on the
way these dimensions evolved during the secondary school (βSlope.Type of school) = p > .05).
In general, all the conditional models highlighted that other sources, not considered in
these models, have impact on the intercept and slope variability (V (Intercept) and V
(Slope) = p < .05).
4. Discussion
Considered by many as the “missing piece” in a student’s education, the
promotion of a positive socio-emotional development in a school context has been
emerging as a crucial factor in a student’s personal and academic success. The present
study attempted to extend the understanding of emotional development in schools by
analysing the evolution of EI in late adolescence throughout the secondary school period,
using and comparing two types of measures (self-report vs. performance).
The findings revealed that EI can follow different developmental trajectories
types of measures failed to overlap in the evolution of EI in the secondary school period.
An increase in EI skill, assessed by the performance measure, was achieved throughout
the secondary school for all students. These results are consistent with the supposed
development and maturation of EI over time and life experiences (e.g., Denham, 1998;
Keefer et al., 2013; Mayer, et al., 1999; Saarni, 1999). The school, and particularly the
secondary school context, may provide opportunities to expose students to challenging
emotional experiences that can have a positive impact upon adolescents’ EI maturation
and development.
The components of the EI self-report measure tended to remain stable
throughout the secondary school period. The developmental path that the
self-perceptions of emotional competence followed may reflect a different aspect of EI.
Besides the possibility of no significant maturation over the explored period, the
observation that EI skills (measured by the VET) have shown positive development
suggests the presence of different development trajectories of students’ perceptions of
EI competence. These results may indicate that students do mature, but also reveal
students’ lack of confidence in their emotional abilities when facing a particularly
challenging and emotionally loaded situation (Somerville et al., 2010). Also, students can
become cognitively and socially more experienced and self-critical in this period (Harter,
2012) and therefore do not report that they have developed emotional skills or, when
responding to self-report measures, tend to implicitly compare themselves to their peers
and undervalue their competence. The lack of consistency in the development of the two
EI components over time may be because performance and the self-report measures,
being related to a more objective and subjective approach to students’ emotional
competencies, can capture different aspects of the EI domain (Sternberg, 1988).
The observation that in every model sources of inter and intrapersonal variability
were highlighted by the results, led to exploration of the effect that students’ verbal
abilities, gender, SCS, SPS and type of school could exert upon the developmental
The VET performance measure requires a verbal-based task to assess emotional
comprehension, and VET evolution scores may reflect the influence of students’ actual
verbal and language abilities; therefore, a verbal-ability indicator was used within the EI
developmental path assessment. The results confirmed that students with better verbal
and language skills at the beginning of secondary school had higher scores in the VET,
which was expected because of EI’s association with other intelligence domains (Mayer
et al., 2008; Roberts et al., 2008). However, the level of student’s language proficiency
did not have an impact upon performance on VET over time. Moreover, students’ gender
improved the EI developmental model for the performance measure. Nonetheless,
gender did not differentiate boys’ and girls’ EI evolution throughout the secondary school;
and, particularly in the initial period of this academic stage, neither gender outperformed
the other. The observation that gender did not have an impact upon VET’s development
reflects the similar development trajectories of EI in late adolescence in both genders.
Although differences between the genders regarding emotional responses and skills can
be found in earlier academic stages, their exposure to increasingly challenging personal
and scholarly tasks in the secondary school period may produce a similar development
of EI skills in both groups, balancing possible differences in their emotional
competencies.
In general, students with higher levels of SCS and SPS had higher levels of
emotional skills (VET and VET, PUE and MRE dimensions, respectively) in the first
secondary school grade, as expected according to the literature (Côté et al., 2010).
Students’ SPS and SCS had a significant effect on EI development; students of lower
socioeconomic status had a higher rate of EI growth in the secondary school period.
These results reflect the importance of these socio-demographic variables in the
differential development of students’ emotional domains. As an important context for
promoting and nurturing students’ social and emotional skills, the schools provide formal
and informal strategies that enhance emotional competence for all students; particularly
valuable resource, maximising their potential growth. Although the type of school that
students attend did not have an impact on the way EI components evolved during
secondary school, this variable was a systematic predictor of interpersonal differences.
Recent research has challenged the idea of that students may achieve more in private
compared to the public institutions (Cherchye et al., 2010; Witte, 1992). In this study,
although students from both academic contexts had similar EI developmental patterns,
at the start of secondary school students attending private schools had higher levels of
EI (in both performance and self-report measures). These results may perhaps reflect
private schools’ more positive investment in social and emotional strategies, and the
school climate in the final academic stages. Nonetheless, private schools have, in
general, a more selective socioeconomic context which can amplify the differences
between the two types of schools.
This research has some limitations. In particular, within this longitudinal study
there were only three measurement points, one for each year of secondary school, which
is the minimum required to conduct LGC analyses. The use of more measurement points
within the period of study would have allowed more precise and reliable trajectory results
(Byrne, 2012). Moreover, consistent with multiyear longitudinal studies (Denham et al.,
2009), the rate of nonresponse is by far one of the greatest limitations in these studies.
In this particular case, the longitudinal final sample included only 60% of the original
participants; the numbers had continuously decreased through the analysed period.
Consequently, students who had been retained, dropped out or transferred to other
schools were excluded from the final sample. Moreover, the use of more performance
indicators of other EI ability-based dimensions (particularly regarding managing and
regulating emotion) could have broadened the perspective of the EI developmental path
throughout this period.
The current findings indicate that students’ levels of the EI performance measure
can evolve as a result of school and social experiences during adolescence, while the
Consequently, it is important that future studies continue to scrutinise the probably
different aspects assessed by each type of measure, and the bridges established
between them. Furthermore, it is also crucial to investigate the formation of EI in the early
educational stages, and its evolution at younger ages. Moreover, other
socio-demographic and academic predictors should be explored and recognised as
consistently important factors, both in EI’s group differentiation and in EI’s developmental
trajectories.
While the literature on adolescents’ objective EI abilities has increased, much
remains unknown about the developmental dynamics of adolescents’ EI subjective
self-perceptions and objective skills (Keefer et al., 2013). Research addressing the
developmental trajectories of emotional skills can shed light upon how these abilities
evolve and are influenced throughout students’ cognitive and academic stages,
substantiating the adaptive role of emotions in students’ adaptation and success.
Research in this area should support the developmental features of EI and reinforce the
5. References
Bar-On, R., Tranel, D., Denburg, N. L., & Bechara, A. (2003). Exploring the neurological
substrate of emotional and social intelligence. In J. T. Cacioppo & G. G. Bernston
(Eds.), Key readings in social psychology: Social neuroscience, (pp. 223-37). New
York, NY: Psychology Press.
Boyatzis, R. E., Goleman, D., and Rhee, K. (2000). Clustering competence in emotional
intelligence: Insights from the Emotional Competence Inventory (ECI)s. In R.
Bar-On & J.D.A. Parker (Eds.), Handbook of emotional intelligence, (pp. 343-362). San
Francisco, CA: Jossey-Bass.
Brackett, M. A., & Mayer, J. D. (2003). Convergent, discriminant and incremental validity
of competing measures of emotional intelligence. Personality and Social
Psychology Bulletin, 29, 1147-1158. doi: 10.1177/0146167203254596
Brackett, M., Rivers, S. E., & Salovey, P. (2011). Emotional intelligence: Implications for
personal, social, academic, and workplace success. Social and Personality
Psychology Compass, 5, 88-103. doi:10.1111/j.1751-9004.2010.00334.x
Byrne, B. M. (2012). Structural Equation Modeling With Mplus. New York, NY:
Routledge.
Center on Education Policy (CEP) (2007). Are private high schools better academically
than public high schools? Retrieved from
http://www.edline.com/uploads/pdf/PrivateSchoolsReport.pdf
Cherchye, L., Witte, K. D., Ooghe, E., & Nicaise, I. (2010). Efficiency and equity in private
and public education: a nonparametric comparison. European Journal of
Operational Research, 202, 563-573.
Ciarrochi, J., Chan, A., Caputi, P., & Roberts, R. (2001). Measuring emotional
intelligence. In J. Ciarrochi, J. P. Forgas, & J. D. Mayer (Eds.), Emotional
intelligence in everyday life: A scientific inquiry (pp. 25-45). Philadelphia: Taylor &
Collaborative for Academic, Social, and Emotional Learning (CASEL). (2005). Safe and
sound: An educational leader’s guide to evidence-based social and emotional
learning programs – Illinois edition. Retrieved September 1, 2014 from
http://casel.org/wp-content/uploads/2011/04/Safe_and_Sound_ILedition.pdf
Cooper, R. (1997). Applying emotional intelligence in the workplace. Training and
Development, 51, 31-38.
Costa, A., Faria, L., & Takšic, V. (2011). Vocabulary of Emotions Test (VET): A
cross-cultural validation in Portuguese and Croatian contexts. Psychological Topics, 21,
413-424.
Côté, S., Gyurak, A., & Levenson RW. (2010). The ability to regulate emotion is
associated with greater well-being, income, and socioeconomic status. Emotion,
10, 923-933.
Denham, S. A. (1998). Emotional development in young children. New York: Guilford
Press.
Denham, S. A., Wyatt, T. M., Bassett, H. H., Echeverria, D., & Knox, S. S. (2009).
Assessing social-emotional development in children from a longitudinal
perspective. Journal of Epidemiology and Community Health, 63, 137-152.
doi:10.1136/jech.2007.070797
Duncan, T. E., Duncan, S. C., & Strycker, L. A. (2006). Latent variable growth curve
modeling. Concepts, issues, and applications. Mahwah: Lawrence Erlbaum.
Durlak, J. A.,Weissberg, R. P., Dymnicki, A. B., Taylor, R. D., & Schellinger, K. (2011).
The impact of enhancing students’ social and emotional learning: A meta-analysis
of school-based universal interventions. Child Development, 82, 405-432.
Faria, L., Lima Santos, N., Takšić, V., Räty, H., Molander, B., Holmström, S., ... Toyota,
H. (2006). Cross-cultural validation of the Emotional Skills and Competence
Questionnaire (ESCQ). Psicologia, 2, 95-127.
Furnham, A., & Rawles, R. (1999). Correlations between self-estimated and
Goldenberg, I., Matheson, K., & Mantler, J. (2006). The assessment of emotional
intelligence: A comparison of performance-based and self-report methodologies.
Journal of Personality Assessment, 86, 33-45.
Greenberg, M. T., Weissberg, R. P., O’Brien, M. U., Zins, J. E., Fredericks, L., … Elias,
M. J. (2003). Enhancing school-based prevention and youth development through
coordinated social, emotional, and academic learning. American Psychologist, 58,
466–474. doi:10.1037/0003-066X.58.6-7.466
Harter, S. (2012). Construction of the self: Developmental and sociocultural foundations.
New York, NY: Guilford Press.
Hu, L., & Bentler, P. M. (1999). Cutoff criteria for fit indexes in covariance structure
analysis: Conventional criteria versus new alternatives. Structure Equation
Modeling, 6, 1-55.
Keefer, K. V., Holden, R. R., & Parker, J. D. A. (2013). Longitudinal assessment of trait
emotional intelligence: Measurement invariance and construct continuity from late
childhood to adolescence. Psychological Assessment, 25, 1255-1272.
Kotsou, I., Nélis, D., Grégoire, J. & Mikolajczak, M., (2011). Emotional plasticity:
conditions and effects of improving emotional competence in adulthood. Journal of
Applied Psychology, 96, 827-39. doi: 10.1037/a0023047.
Lerner, R. M., Almerigi, J. B., Theokas, C., & Lerner, J. V. (2005). Positive youth
development: A view of the issues. Journal of Early Adolescence, 25, 10-16. doi:
10.1177/0272431604273211
Lerner, R. M., & Steinberg, L. (Eds.). (2009). Handbook of adolescent psychology (3rd
ed.). Hoboken, NJ: Wiley. doi: 10.1002/9780470479193
Lopes, P. N., Salovey, P., & Straus, R. (2003). Emotional intelligence, personality, and
the perceived quality of social relationships. Personality and Individual Differences,
35, 641-658.
Mayer, J. D., Caruso, D., & Salovey, P. (1999). Emotional intelligence meets traditional
Mayer, J. D., & Salovey, P. (1997). What is emotional intelligence? In P. Salovey, & D.
Sluyter (Eds.), Emotional development and emotional intelligence: Educational
implications (pp. 3-31). New York, NY: Basic Books.
Nelis, D., Quoidbach, J., Mikolajczak, M., & Hansenne, M. (2009). Increasing emotional
intelligence: (How) is it possible? Personality and Individual Differences, 47,
36-41. doi:10.1016/j.paid.2009.01.046
Pekrun, R., Goetz, T., Titz, W., & Perry, R.P. (2002). Academic emotions in student’s
self-regulated learning and achievement: A program of quantitative and qualitative
research. Educational Psychologist, 37, 914-106.
Petrides, K. V., & Furnham, A. (2000). On the dimensional structure of emotional
intelligence. Personality and Individual Differences, 29, 313-320.
Ruini, C., Ottolini, F., Tomba, E., Belaise, C., Albieri, E., Visani, D., ... Fava, G. A. (2009).
School intervention for promoting psychological well-being in adolescence. Journal
of Behavior Therapy and Experimental Psychiatry, 40, 522-532.
doi:10.1016/j.jbtep.2009.07.002
Saarni, C. (1999). The development of emotional competence. New York, NY: Guilford
Press.
Sallquist, J.V., Eisenberg, N., Spinrad, T., Reiser, M., Hofer, C., Liew, L., & Eggum, N.
(2009). Positive and negative emotionality: Trajectories across six years and
relations with social competence. Emotion, 9, 15-28. doi: 10.1037/a0013970
Salovey, P., & Mayer, J. D. (1990). Emotional intelligence. Imagination, Cognition and
Personality, 9, 185-211.
Schutte, N. S., Malouff, J. M., Thorsteinsson, E. B., Bhullar, N., & Rooke, S. E. (2007).
A meta-analytic investigation of the relationship between emotional intelligence
and health. Personality and Individual Differences, 42, 921–933.
Somerville, L. H., Jones, R. M., & Casey, B. J. (2010). A time of change: Behavioral and
neural correlates of adolescent sensitivity to appetitive and aversive environmental
Sternberg, R. J. (1988). The triarchic mind: A new theory of human intelligence. New
York, NY: Cambridge University Press.
Stocker, J., & Faria, L. (2012). Competência percebida no ensino secundário: do
conceito à avaliação através de um questionário compósito. [Competence in
secondary school: from conceptualization to assessment through a composite
questionnaire]. Psicologia, 21, 113-140.
Takšić, V., Herambasic, D., & Velemir, B. (2003). Vocabulary of Emotions Test (VET 35).
Rijeka: Authors’ edition.
Takšić, V., & Mohoric, T. (2008, july). Vocabulary of Emotion Test (VET): Ability measure
of emotional intelligence. Paper presented at the XXIX International Congress of
Psychology. Berlin, Germany.
Takšić, V., Mohorić, T., & Duran, M. (2009). Emotional Skills and Competence
Questionnaire (ESCQ) as a self-report measure of emotional intelligence. Horizons
of Psychology, 18, 7-21.
Van der Zee, K., Thijs, M., & Schakel, L. (2002). The relationship of emotional
intelligence with academic intelligence and the Big Five. European Journal of
Personality, 16, 103-125. doi:10.1002/per.434
Van Rooy, D. L., & Viswesvaran, C. (2004). Emotional intelligence: A meta-analytic
investigation of predictive validity and nomological net. Journal of Vocational
Behavior, 65, 71-95. doi: 10.1016/S0001-8791(03)00076-9
Witte, J.F. (1992). Private school versus public school achievement: Are there findings
that should affect the educational choice debate? Economics of Education Review,
11, 371–394.
Zeidner, M., Roberts, R. D., & Matthews, G. (2002). Can emotional intelligence be
schooled? A critical review. Educational Psychologist, 37, 215-231.
Zins, J. E., Weissberg, R. P., Wang, M. C., & Walberg, H. J. (2001). Social-emotional
learning and school success: Maximizing children’s potential by integrating
Figure 1. Unconditional Latent Growth Curve Model for intraindividual variability of EI variables
(VET, ESCQ, EE, PUE, MRE). Intercept loadings constrained to 1 and slope loadings
Figure 2. Conditional Latent Growth Curve Model for intraindividual variability of EI’s variables
explained by the predictors (Verbal ability indicator, Gender, SCS, SPS, type of school). Intercept
Table 1. Descriptive statistics of EI variables (VET, ESCQ) for adolescents by secondary school
grade and t-test results.
Note: M = mean; SD = standard deviation; t-tests - Paired Samples t-test score; Significance for
t-tests: *** p < .001, ** p < .01, *p<.05.
10th grade 11th grade 12th grade t-tests(df)
M (SD) N M (SD) N M (SD) N 10 th
-11th
grade
11th-12th
grade
10th-12th
grade
VET 23.1 4.30 395 24.4 4.11 395 25.0 3.76 395 -6.978 (394)***
-3.193
(394)***
-9.838
(394)***
ESCQ 195.7 18.34 335 197.4 18.86 335 195.8 19.37 335 -2.003 (334)*
1.747
(334)
-.169
(334)
EE 64.6 8.60 398 65.1 8.97 398 64.8 9.46 398 -1.205 (397)
.904
(397)
-.323
(397)
PUE 63.7 7.69 398 64.4 7.56 398 7.47 64.0 398 -2.235 (397)*
1.394
(397)
-.745
(397)
MRE 65.7 7.35 398 66.6 7.60 398 66.2 7.50 398 -2.590 (397)*
1.158
(397)
-1.298
Table 2. Estimates of EI variables in LGM (unconditional models).
Note: *** p < .001, ** p < .01, * p < .05. Mean
intercept
Variance
of
intercept
Mean
slope
Variance
of slope Model fitness index
VET 23.08*** 12.81*** 1.86*** 3.02** X
2
=5.445, df=2, CFI=.99, TLI=.99, RMSEA=.066
ESCQ 196.39*** 221.31*** -.16 59.71* X
2
=5.650, df=2, CFI=.99,
TLI=.99, RMSEA=.074
EE 64.78*** 45.09*** 0.05 4.55 X
2
=1.581, df=2, CFI=.99,
TLI=.99, RMSEA=.038
PUE 63.97*** 35.50*** 0.01 0.06 X
2
=5.099, df=2 , CFI=.99,
TLI=.99, RMSEA=.062
MRE 65.87*** 34.04*** 0.60 13.01** X
2
Table 3. Estimates of predictors of VET in LGM (Conditional models).
VET x predictors βIntercept. Predictor
βSlope.
Predictor
V(Intercept) (S.E.)
V(Slope) (S.E.)
Model
Comparison
(Unconditional
vs. Conditional) Model fitness index
Verbal Ability
Indicator .51*** -.25 13.63***(2.11) 5.06*(2.07)
X2(2)=46.563
p=.000
X2= 5.989, df=3, CFI=.99,
TLI=.98, RMSEA=.076
Gender -.10 -.10 12.68*** (1.36) 2.99*(1.26) X 2
(2)=8.107
p=.017
X2= 5.672, df=3, CFI=.99,
TLI=.99, RMSEA=.048
SCS
High-Low .32*** -.38** 11.45***(1.31) 2.59*(1.25) X 2
(2)=23.724
p=.000
X2=5.449, df=2 , CFI=.99,
TLI=.98, RMSEA=.046
High-Medium .18** -.08 12.41***(1.35) 2.99*(1.27)
X2(2)=6.768
p=.034
X2=7.012, df=3 , CFI=.99,
TLI=.97, RMSEA=.058
Medium-Low .20* -.42** 12.30***(1.38) 2.50*(1.26)
X2(2)=8.134
p=.017
X2=6.772, df=3, CFI=.99
TLI=.97, RMSEA=.056
SPS
High-Low .34*** -.47*** 11.33***(1.30) 2.34(1.24) X 2
(2)=24.009
p=.000
X2= 5.555, df=3, CFI=.99,
TLI=.97, RMSEA=.053
High-Medium .23*** -.21 12.15***(1.34) 2.88*(1.27)
X2(2)=10.327
p=.006
X2=6.314, df=3 , CFI=.98,
TLI=.97, RMSEA=.078
Medium-Low .11 -.27 12.65***(1.38) 2.81*(1.26)
X2(2)=3.123
p=.210
X2=6.577, df=3 , CFI=.99,
TLI=.97, RMSEA=.055
Type of school .173* -.183
12.42*** (1.35) 2.91** (1.27) X2(2)=8.579
p=.014
X2=5.782, df=3 , CFI=.99,
TLI=.99, RMSEA=.049
Note: For gender, 0=female and 1=male; For SCS, 0=lower status and 1= higher status; For
SPS, 0=lower status and 1= higher status; for type of school, 0=public school and 1=private
Table 4. Estimates of predictors of ESCQ and dimensions in LGM (Conditional models). ESCQ x predictors βIntercept. Predictor βSlope. Predictor
V(Intercept) (S.E.) V(Slope) (S.E.) Model Comparison (Unconditional vs. Conditional)
Model fitness index
Gender .02 -.07
221.24*** (25.08) 59.34* (29.95) X2(2)=.303
p=.860
X2= 5.675, df=3 , CFI=.99,
TLI=.99, RMSEA=.052
SCS
High-Low .00 .20 221.33***(24.93) 56.89*(29.69)
X2(2)=2.188
p=.335
X2=5.731, df=3, CFI=.99,
TLI=.98, RMSEA=.052
High-Medium .04 .06 220.91***(25.13) 59.55*(30.00)
X2(2)=.699
p=.705
X2=5.658, df=3 , CFI=.99,
TLI=.98, RMSEA=.052
Medium
-Low -.05 .19 220.84***(24.96) 57.11*(29.86)
X2(2)=.926
p=0.629
X2=5.741, df=3, CFI=.99
TLI=.98, RMSEA=.052
SPS
High-Low .01 .02 221.30***(25.10) 59.62*(29.98)
X2(2)=.036
p=.982
X2=6.044, df=3, CFI=.99,
TLI=.97, RMSEA=.055
High-Medium .02 .17 220.04***(26.19) 56.21***(30.37)
X2(2)=1.823
p=.402
X2=8.942, df=3 , CFI=.98,
TLI=.95, RMSEA=.077
Medium
-Low .00 -.22 219.72***(26.35) 54.26(30.48)
X2(2)=1.019
p=.601
X2=9.912, df=3 , CFI=.98,
TLI=.94, RMSEA=.083
Type of school .27*** .07
205.52*** (24.02) 59.41* (29.99) X2(2)=23.695
p=.000
X2=5.654 , df=3 , CFI=.99,
TLI=.99, RMSEA=.051
Note: For gender, 0=female and 1=male; For SCS, 0=lower status and 1=higher status; For
SPS, 0=lower status and 1= higher status; for type of school, 0=public school and 1=private