Emma Galli, Ilde Rizzo, Carla Scaglioni
Transparency, quality of institutions and
performance in the Italian Municipalities
WP11/2017/DE/UECE
_________________________________________________________
W
ORKINGP
APERSTransparency, quality of institutions and performance in the Italian Municipalities
Emma Galli
Sapienza University of Rome, Department of Social and Economic Sciences
Ilde Rizzoж
University of Catania, Department of Economics and Business
Carla Scaglioni
Richmond University – Rome Study Center; Mediterranean University of Reggio Calabria, DiGiec
Abstract
In this paper, we aim at evaluating from an economic perspective the recent Italian legislation on
transparency to investigate whether the potentialities of transparency as a tool to improve
performance and integrity are fully exploited. We first construct a synthetic indicator (CTI) consisting
of two sub-indicators, CTI Integrity and CTI Performance, which are able to describe in numerical
terms the overall degree of transparency of Italian public administrations as well as the two different
aspects of the public activity’s transparency. Then, using as a sample of Italian municipalities, we
address the question whether there is a relation between the fulfillment of transparency obligations
and both the institutional quality and the performance of the public administration activity. Our
preliminary results suggest that our transparency indicators show a satisfactory correlation with
widely used measures of the quality of institutions as well as with the official data on municipalities
public spending performance.
JEL Classification: K2, K4, H3, H7
Keywords: Transparency, quality of institutions, local governments, accountability, performance.
ж
Introduction
Recently public administrations have been required to be more transparent in providing
information about their activities with the aim of increasing their accountability, improving the use
of public resources and enhancing citizens’ trust in public institutions. Integrity and performance
issues in government are at the forefront of the political and economic debate worldwide. Diffusion
of corruption and abuse of power in governments have led to a growing demand of access to public
information. In Italy, major reforms have been introduced since the end of the first decade of this
century, but scarce integrity and performance in the public sector are still a ‘hot’ unresolved problem.
In this paper, we aim at evaluating from an economic perspective the recent Italian legislation on
transparency to investigate whether the potentialities of transparency as a tool to disclose relevant
information about the public activity to the stakeholders, to prevent corruption and waste of public
resources and to favour accountability, are fully exploited. In other words, we try to answer the
following question: is the degree of transparency of a public administration somehow correlated with
the quality of the local institutions and theirperformance? In such a perspective, we first propose a
new approach to measure transparency and then develop an empirical analysisto investigate whether
there is a relation between the fulfillment of transparency obligations, the quality of the institutional
environment and the performance of the public administration activity. By focusing on a sample
including all the main Italian Municipalities (so-called Province Capitals), our empirical analysis can
be considered a starting point to investigate the complex relationship between transparency, quality
of institutions and performance in the public sector, which so far has not received great attention. The
analysis develops as follows. Section 2 presents a survey of the literature. Section 3 offers a short
overview of the main features of the Italian legislation on the performance and transparency of public
administrations. Section 4illustratesthe empirical analysis. The characteristics of the sample and the
methodology employed to build the new indicator of transparency are described; then some
institutions and performance in the Italian municipalities. Section 5 provides some concluding
remarks.
Related literature
Transparency and governance
The increasing demand for transparency as a fundamental claim in democratic societies is one of
the policies undertaken to monitor the performance in the public activity, favour accountability and
reduce corruption of public officials (Holzner and Holzner 2006).
Literature about transparency finds the theoretical underpinning in the agency theory and the
legitimacy theory (for an extensive review, see Ferraz Esteves de Araújo and Tejedo-Romero2016).
According to the agency theory, in the relation between public officials (the agents) and citizens (the
principal) some problems arise when there is asymmetry of information and policy makers do not act
in the interests of the citizens. Transparency in public activity is a means to improve policy
effectiveness and make policy makers more accountable. According to the legitimacy theory acquired
from the literature of the private organizations, the diffusion of information is a way to legitimate
actions to their stakeholders.
There are many definitions of transparency but all of them consider the openness in the flow of
economic, political, social information to the relevant stakeholders as the core of the phenomenon
(Kaufmann and Kraay 2002; Meijer 2009; 2013). Public administrations are requested to engage in a
more active disclosure of information (the so-called proactive transparency), while in the past they
were passively providing it on request, and at their own discretion (the so-called reactive
transparency) (see, among others, Piotrowski 2008; Meijer et al. 2012). There is a rich literature on
the conceptual aspects of transparency, and the contributions on its measurement and consequently the
empirical analyses are growing1.
1
There are several ways to address the measurement issue: a “bottom up” approach, which develops
measures of transparency based on the stakeholders’ opinions through surveys. Along the lines of this
approach there are few initiatives by international organizations such as the OECD Open Government
Data project and the World Economic Forum Global Competitiveness Report, and partial/single
country indicators provided by Transparency International, like for the Spanish Municipalities, as
well as worldwide economic and politico-institutional transparency indexes based on several
independent sources (Bellver and Kaufmann 2005).Other contributions have developed specific
transparency indexes based on a participatory method, like Ferreira da Cruz et al. (2016) for the
Portuguese municipalities and Bertelli and Piotrowski (2010) for the New Jersey municipalities.
A “top down” approach, instead, constructs legal/formal indicators moving from the existing
transparency regulation. To our knowledge there are no relevant contributions in the literature which
have tried to estimate a broad transparency indicator based on norms and regulations; however, some
contributions have measured fiscal transparency indicators based on financial and non-financial
information published on website of public administrations (for a survey, see Jorge et al. 2011).The
“top down” approach is suitable to address the Italian case where there is a complex legislative
framework, which disciplines transparency obligations and the monitoring of their fulfilment. Based
on these different measures of transparency, a branch of literature tries to address the relation between
different dimensions (economic and political) of transparency and accountability (see, among others,
Blumkin and Gradstein2002; Meijer 2013); some contributions focus on the relation between
transparency and corruption. Within this latter field of research, some contributions are worth
mentioning. Islam (2004) empirically investigates the impact of the timely availability of information
about economic data as well as of the regulation of the access to information on the quality of
governance in 125 developing countries. Reinikka and Svenson (2004) illustrate a field experiment
in Uganda where a newspaper campaign was aimed at reducing corruption in the management of a
officials. Olken (2007) presents a field experiment in over 600 Indonesian villages road projects
where an increase in government audits from 4 percent of projects to 100 percent reduced missing
expenditures by 8 percentage points, while grassroots participation in monitoring had little average
impact. Piotrowski and Van Ryzin (2007), using data from a U.S. national online survey of more than
1,800 respondents, built several indices to measure citizens’ demand for transparency at the local
level. They find that age, political ideology, confidence in government leaders, frequency of
contacting government, and the perception that the access to government is insufficient, are positively
correlated with the public demand for transparency, although the determinants differ for each
dimension.
Kolstad and Wiig (2009) argues that transparency in resource revenues such as the Extractive
Industries Transparency Initiative (EITI) has been insufficient and needs to be complemented by other
policies. Lindstedt and Naurin (2010), using cross-sectional data, find that making political
institutions more transparent turns out to be an effective measure to reduce corruption only if
conditions for publicity and accountability as education, media circulation and free and fair elections
are strong. Drawing from a field experiment on access to ration cards among New Delhi’s slum
residents, Peisakhinand Pinto (2010) demonstrate that India’s recently adoption of a freedom of
information law is almost as effective as bribery in helping the poor to secure access to basic public
services.
Another branch of literature has empirically investigated the determinants of transparency in
different countries. Alt et al. (2006), using a unique data set on transparent budget practises, which
consists of survey responses to a questionnaire sent to the budget officials of the fifty states of the
USA from 1972 to 2002, show that political competition and fiscal imbalances are associated with
higher fiscal transparency, while political polarization is associated with lower transparency.
Navarro et al. (2014) find that factors such as financial risk, demography and awareness of
information (general, environmental, economic and social) of the local governments in Nordic
countries. Esteller and Polo-Otero (2008) find that in the Catalan municipalities fiscal transparency
is mostly determined by political competition, the number of inhabitants, and the accumulation
ofdebt. Caamaño et al. (2011) examine budget transparency for 33 municipalities in Galicia and find
that unemployment is negatively correlated with fiscal transparency while the institutional variables
are not. Bastida et al. (2011) show that municipalities collecting more taxes and receiving more
transfers disclose more financial information. Moving from the analysis of fiscal transparency’s
website content of the Portuguese and Italian local governments, Jorge et al. (2011) find that the size
of the municipalities and the rate of abstentionism in the last local elections are the only significant
determinants of transparency. Using a measure of municipal transparency in New Jersey, Bertelli and
Piotrowski (2010) find that, among several economic, social and institutional determinants, only the
level of education, the percentage of elderly people and the size of the budget are significantly
correlated with transparency. Alcaraz-Quiles et al. (2015) provide evidence that socio-economic
factors such as education, population density, access to internet as well as e-government factors such
as the provision of public information online, the percentage of procedures completed after online
start, the level of online services provided and broadband availability, are all relevant to the disclosure
of information by the Spanish regional governments. Albalate (2013), drawing on the 2010
transparency indexes constructed by Transparency International for Spanish Municipalities, finds that
large municipalities and left-wing local government leaders are associated with better transparency
indexes. Ferraz Esteves de Araújo and Tejedo-Romero (2016) analyse the determinants of
transparency in Spanish municipalities using the same Transparency International indexes and find
that transparency level is associated with unemployment rate, investment, electoral turnout, political
ideology, political competition and size of the population, while public debt and gender are not.
Transparency may play an important role especially at local level. A considerable bulk of literature
emphasizes that at this level of government greater efficiency in the provision of public services is
likely to occur, depending on the inter-jurisdictional competition which in turn enhances the control
process by the citizens and guarantees greater accountability of the public officials (see a recent paper
by Hong 2017). A close analysis of such a literature is outside the scope of this paper2 and only the
main conclusions will be briefly recalled here. It is widely claimed that, under given assumptions, the
resource allocation is more efficient in a decentralized context, since local governments enjoy better
information about citizens’ preferences (and services costs). Moreover, at local level, citizens’
political participation is likely to be greater as well as local government accountability. In a public
choice perspective, it is claimed that fiscal decentralization tends to constrain the tendency of the
public sector to expand (Brennan and Buchanan 1980; Ashworth et al. 2012), because of the
competition across local governments. As Qian and Weingast (1997, 88) stress, “competition among
jurisdictions forces governments to represent citizen interests and to preserve markets”. Moreover,
the experimentation of innovative policies to improve the efficiency at local level would be favoured
by decentralization.
More recently, at decentralized level the crucial role of information and the related incentive
structures are also enhanced3 but a crucial issue is the trade-off between local accountability
(sensitivity of outcomes to local preferences) and the central internalization of inter-jurisdictional
interdependencies (Besley and Coate 2003).
However, alongside the above-mentioned benefits, the literature points out several shortcomings
of decentralization such as those deriving by the existence of economies of scale, by spillovers effects
and by a lower quality of local bureaucracy. Moreover, if citizens/taxpayers lack information the
2 For a survey, see Oates (2008).
claimed accountability would be lower and, therefore, the potential benefits of a decentralized
approach might be reduced4.
Finally, it is interesting to point out that local governments might be captured more easily by
lobbies and specific interests and more open to corruption. According to Redoano (2010) the link
between decentralization and lobbying is rather ambiguous. At the same time, the relationship
between decentralization and corruption is not well defined: however, empirical evidence offered by
Fisman and Gatti (2002) using cross-section data would suggest that decentralization is associated
with lower levels of corruption; Fiorino et al. (2015), using time-series data, suggest that more
decentralized fiscal and spending powers are related to lower levels of corruption.
The legislative framework on transparency: rules and actors
Rules of transparency
The issue of proactive transparency of public sector organizations has received attention in Italy
since 2005, when the Code of digital administration5 has been approved; few years after, in 2009, it
has evolved toward the concept of ‘total accessibility’, as a major tool for the reform of public
administration6. New rules and evaluation criteria as well as new standards for transparency have
been established to improve the performance and accountability of central government and an
independent specialized Commission (Commissione per la valutazione, l’integrità e la trasparenza
delle pubbliche amministrazioni– CiVIT) has been instituted to oversee the implementation of such
a reform. OECD (2013,31) stresses that the 2009 reform has promoted the advancement of the
transparency agenda, so that “Italy is a leader among OECD countries regarding the disclosure of
public information.” In practice, however, the real impact of the reform on the performance of public
4Among the others, see Boadway et al. (1999); Besfamille (2004); Reinikka and Svensson (2004).
5 Legislative Decree n. 82/2005, “Code of digital administration”
administrations as well as on the availability of good quality information has been quite limited
(CiVIT, 2012).According to Cacciatore et al.(2016) this is the result of a policy design requiring
public administrations to fulfill transparency very promptly, without having time for re-organizing
their internal processes coherently with their new information tasks.
In any case, notwithstanding implementation problems, the 2009 reform can be considered the
starting point of a continuously evolving legislation on transparency, which through time has
increasingly adopted a prevailing focus on the promotion of integrity and prevention of corruption.
A complete review of Italian regulation on these issues is outside the scope of this paper. Here, it is
enough to recall that the pillar of this renewed effort is the Anticorruption Bill7, which, among the
other things8, has put the basis for a legislative decree issued in 2013 on publication requirements,
transparency and disclosure of information by the public administration. The rules introduced in 2013
enlarge the subjective scope of transparency – so that the obligations of publications apply to more
than 10,000 subjects, i.e. all public offices at any level of government and public companies – as well
as its objective scope – about 270 detailed obligations to be published in a standardised format
(Amministrazione trasparente). Transparency obligations cover a very wide and diversified scope:
information about the organization of the public administration with respect to politico-administrative
bodies and top public managers and officials9, information about the private-public companies
providing local public services10, external consulting and collaborations, public procurement,
management of the property and assets, timing of the payments and provision of public services. The
legislative decree also regulates the exercise of the right to access information, such as the civic access
7 Law no. 190/2012, containing “Provisions for the prevention and repression of corruption and illegality in Public
Administration”.
8 For details on the provisions of the Anticorruption Bill and on its implementation, see ANAC (2013), ANAC (2014) and ANAC (2015).
9 Information includes curriculum vitae, competences, salaries, fiscal declarations, statements about the inexistence of conflicts of interest.
to the information, and provides certain limits to transparency, including the protection of sensitive
personal information.
Indeed, government attention for transparency has continued through time, with a further reform
of transparency in 201611, which has also introduced the generalized dissemination of information
upon request12.
The actors of transparency
The implementation of the transparency rules introduced in 2013 relies on several actors. At
decentralized level, each public organization is compelled to implement transparency obligations and
to identify a Responsible for Transparency; the Independent Evaluation Unit (Organismo
Indipendente di Valutazione - OIV)13 assesses the fulfilment of transparency obligations within each
public organization and certifies it on the public organization’ s web site; public opinion searches for
information with the principle of civic access allowing for the indirect monitoring of the degree of
transparency of each public organization.
At central level, the National Anticorruption Authority (Autorità Nazionale Anticorruzione -
ANAC)14 performs regulatory and monitoring functions. On one hand, ANAC issues guidelines
aimed at interpreting legislation, defining in details the transparency obligations for the public
administrations and regulating its implementation15; on the other hand, the Authority undertakes
monitoring activities on the fulfilment of transparency obligations both on single public organizations
11 Legislative decree n. 97/2016, containing “Revision and simplification of rules on the prevention of corruption, publicity and transparency”. It is part of a wider reform for the reorganization of public administrations.
12 The reform follows the Freedom of Information (FOI) approach.
13 OIV is appointed in each administration by the political decision-maker. It has many tasks also implying the evaluation of performance.
14 The National Anticorruption Authority is identified in the former Commission for Evaluation, Transparency and Integrity (CIVIT). Law 114/2014 has redesigned its mission: it has enlarged its powers to prevent corruption and to foster transparency while it is not uncharged anymore of monitoring the performance of public organizations. Moreover, ANAC also regulates and monitors public procurement.
(mainly in response to complaints on non-compliance) and on samples of public organizations (ex
officio). It has also the power to issue sanctions for non-compliance with mandatory publication
obligations16.
As ANAC (2013) outlines in its “Report on the first year of implementation of Law n. 190/12”,
the sustainability and the effectiveness of the complex and burdensome regulation established in 2013
cannot be taken for granted. In fact, a complex and uniform regulation applies to public
administrations and agencies, even if they differ in terms of size and type of activity, disregarding its
high ‘opportunity cost’, especially for small size municipalities and public bodies. The budget
stringencies faced by public administrations, makes the fulfilment of transparency obligations hardly
sustainable.
Moreover, also the effectiveness of transparency as a means to promote public sector
accountability and widespread forms of social control appears questionable. ANAC (2013) also notes
that in the first year of implementation, such regulation has mainly enhanced the bureaucratic
tendency to formal compliance, embedded in Italian public administration, rather than promoting a
real effort toward improving accountability and performance. In short, bureaucrats, being risk averse,
tend mainly to ‘comply’ rather than to actively produce valuable information. The poor quality of
transparency seems somehow confirmed by the OECD 2014 “Survey on Open Government Data”
(OECD, 2015); in fact, according to the OECD Ourdata Index17, Italy still ranks low, below the
OECD average and far from other European countries, such as France and United Kingdom.
Nor the other actors operating at decentralized level appear to have fully exploited the potentialities
offered by the legislation on anti-corruption and transparency. In fact, as far as public opinion is
concerned, it seems that the demand of transparency from the bottom is still limited, though increasing
16The legislative decree n. 97/2016 enlarges ANAC’s sanction powers, as stated by the legislative decree n. 33/2013 (art. 14 and 22).
through time, as demonstrated by the number of citizens’ complaints to ANAC regarding lack or
shortcomings in transparency (ANAC 2013; 2015; 2016)18.
OIV is formally independent but its effectiveness in carrying out evaluation activities as well as
transparency certifications may be endangered by its close relationship with the administration, which
appoints OIV members, thus eventually weakening its independence19.Currently the OIV
competences have been enlarged by legislation on transparency and integrity and, as OECD (2013 p.
13) suggests, its role would “need to be carefully assessed and clearly delineated throughout
implementation”.
Monitoring transparency
As it was pointed out before, since 2013 ANAC has undertaken monitoring activities ex officio.
Being aware of the complexities related to the completion of the transparency requirements, it has
adopted a stepwise approach. Monitoring activity has developed in different sessions, aimed at
assessing the fulfilment of selected transparency obligations considered relevant to prevent corruption
and foster accountability20; many resolutions have been issued, each focusing on different sets of
obligations. Thus, through time, it is not possible to make a comparison across public administrations
and within each of them to understand transparency trends.
ANAC has carried out monitoring mainly indirectly, using OIVs statements, as well as directly,
verifying public organizations websites. The comparison between direct and indirect monitoring
shows that in some cases OIVs’ statements certifies a higher degree of fulfilment than the one
18 ANAC reports complaints towards 150 public administrations in 2013, 340 in 2014 and 542 in 2015.
19 Such a system is under review with a tendency to reduce the strength of such a relationship. A reform is under way, establishing a national list of experts from which each administration has to choose the members of its OIV.
assessed by ANAC through direct monitoring, especially as far as the quality, openness and updating
of data are concerned (ANAC 2013).
Moreover, it is worth noting that monitoring refers only to small samples, especially if compared
with the huge number of public administrations - more than 10,000 public organizations- compelled
to fulfill transparency obligations21. For such a reason, the evaluation of the results of ANAC
monitoring requires caution.
However, having in mind the above limitations it is worth noting that from ANAC monitoring
(ANAC 2013; 2015; 2016) compliance appears rather jeopardized across different types of public
organizations, with small municipalities exhibiting more difficulties of compliance than larger ones.
Compliance also appears to differ depending on the type of information. From ANAC monitoring
it emerges that while the publication of data is overall rather widespread, the level of completeness
of the published information differs across various types of information. It is high with respect to the
information related to the specific activities of the administration, to procurement and to the
allowance of economic benefits22; the level of completeness is rather low for information regarding
political-administrative bodies, external consulting and collaborations, timing of payments, length of
administrative procedures, management of public assets and public utilities companies. Overall, it
seems that information, which is more related to management and performance, are less transparent
than others. A closer analysis of the degree of fulfilment of transparency obligations is offered below.
A new transparency indicator
Sample and methodology
21 ANAC has monitored ex officio165 different types public organizations in 2013-14; 98 different types of public organizations in 2015 and 42 different types of public organizations in March 2016. For more details, see ANAC (2013, 2015 and 2016).
We built a new measure of transparency using a sample including the main municipalities
(Province Capitals) located in Italian Ordinary Statute Regions23 in different areas of the country (40
in the North, 24 in the Center and 25 in the South). The sample is quite diversified: municipalities are
differently populated, ranging from Rome (2,617,175 inhabitants) to Urbino (15,270)24.About 42%
of the municipalities have population between 90.000 to 45.000 inhabitants and are mostly located in
the South. The largest municipalities (accounting for more than half of the population of the overall
sample) are located in the North, with the exception of Rome, Naples and Bari. Table 1 summarizes
the descriptive statistics of the sample distribution by geographical area.
Table 1. Sample distribution by geographical area
Macro Area
Municipalities in the sample by geographical area Number % Cumulate Cohorts of Population (inh. %)
.
250.000 and above 249.999-90.000 89.999-45.000 44.999-15.000
North 40 45% 15% 45% 32,5% 7,5%
Centre 24 27% 8,3% 33,3% 41,7% 16,7%
South 25 28% 8% 28% 56% 8%
All
sample 89 100% 11% 37% 42% 10%
Source: own elaborations on Istat (2013)
We follow a “top down” approach to construct an indicator of transparency moving from the
existing regulation, which disciplines transparency obligations and the monitoring of their fulfilment.
To this aim, we first build a completely new dataset containing information about several aspects of
public administration activity, issued and validated according to ANAC resolution n.77/2013 - by the
OIV). By law25, all the institutions are requested to publish the OIVs certifications and the relative
filled-in format on their websites under the section Amministrazione Trasparente.
23 Italy is politically and administratively divided in twenty Regions. Five enjoy a special statute (Regioni a Statuto
Speciale, or RSS) because of their multilingual status, borderline position or secessionist movements
(Friuli-Venezia-Giulia, Sicilia, Sardegna, Trentino Alto Adige consisting of the two Autonomous Provinces of Trento and Bolzano, Valle d’Aosta). Fifteen Regions (Piemonte, Lombardia, Veneto, Emilia-Romagna, Toscana, Liguria, Marche, Umbria, Abruzzo, Lazio, Molise, Basilicata, Campania, Puglia, Calabria) are characterized by an ordinary statute (Regioni a
Statuto Ordinario, or RSO).
24The mean and median population of all the Italian Municipalities in 2013 were about 7,500 and 2,500 inhabitants, respectively. Therefore, a municipality with more than 15,000 people is considered a medium-large city.
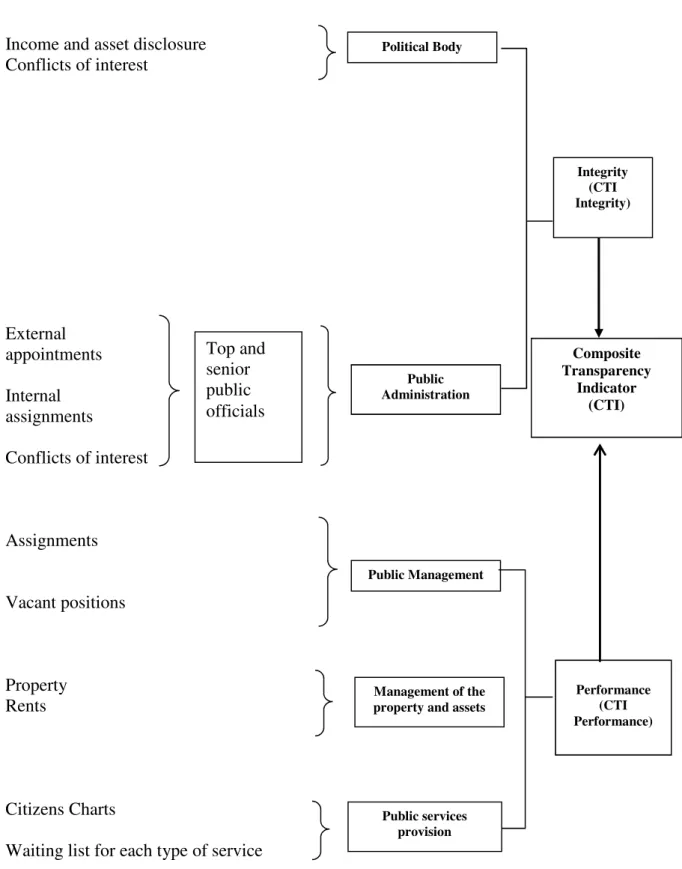
We organize the selected information in two groups: one labelled Integrity, includes items such as
income and asset disclosure and conflicts of interest (on both politicians and top and senior public
officials); the other, labelled Performance, includes information about the management of public
property, the timeliness of public services provision, the quality of public services (see Figure 1).
The value of each of the selected items is based on the OIV evaluation (according to the criteria
established by ANAC) in terms of level of publication, degree of completeness and qualitative
information. The scale goes from 0 to 3, with the exception of ‘publication of data’ which range from
0 to 2; for the purpose of our computation, we rescale the items from 0 to 3. Finally, we normalize
the values and set the average for all indices equal to unity (following the methodology employed by
Afonso et al. 2005; Afonso and Scaglioni 2006). The values for each item are recalculated relative to
the average and are given equal weight, consistently with the ANAC methodology26.
The outcome is a new composite indicator of transparency (CTI), which is constructed as a simple
average of the two sub-indicators referring to Integrity (CTI Integrity) and Performance (CTI
Performance). Those indicators are computed for all the municipalities in the sample and then
aggregated on regional basis, to facilitate the analysis of the patterns.
Figure 1 - Items included into the Composite Transparency Indicator (CTI).
Income and asset disclosure Conflicts of interest
External appointments
Internal assignments
Conflicts of interest
Assignments
Vacant positions
Property Rents
Citizens Charts
Waiting list for each type of service
Political Body Top and senior public officials Composite Transparency Indicator (CTI) Public Administration Integrity (CTI Integrity) Public Management
Management of the property and assets
Performance (CTI Performance)
Transparency across the Italian Regions
As it emerges from Figure 2 the CTI exhibits marked differences across the 89 municipalities of
our sample across Regions27. The latter perform a Transparency Average Compliance of 1,04 (on the
scale 0 to 3).The degree of transparency varies from 0.05 (or -95% below the average achieved by
the other Regions) for Molise to 3.23 (or +223% above the average) for Emilia Romagna. Marche
(1.04; 4%) is the Region mostly aligned with the average. Lombardia and Piemonte are both below
it, although with a different degree of fulfilment of the transparency obligations and respectively with
0.98 (-2%) and 0.78 (-22%). On the contrary, Liguria and Veneto are both significantly above the
average with their 1.31 (+31%) and 1.22 (+22%). Lazio reaches the second position in the ranking
with its 1.51 (+22%). Toscana and Umbria display 1.18 (+18%) and 1.10 (+10%), respectively. Puglia
is the only Region among the Southern which exhibits a performance above the average (1.12; +12%).
All the others occupy the latest positions with the following figures: Abruzzo 0.76 (-24%),
Basilicata0.29 (-71%), Calabria 0.24(-76%) and Campania 0.20(-80%).
Overall, with respect to the macro-areas, Northern and Central Regions show positive values in
accomplishing the transparency obligations (50% and 21%, respectively), although they are quite
diversified going from 0.77 (-23%) for Piemonte to 2.23 (123%) for Emilia Romagna.Lowest values
are shown instead by the Southern Regions, except for Puglia. Specifically, their average is about
-56%, ranging from 0.76, performed by Abruzzo, to the aforementioned Molise (-95%).
Figure 2 – Composite Transparency Indicator by Regions (CTI, 2013)
Source: our elaborations.
Regarding to the sub-indicator CTI Integrity (see Figure 3.a), on average, Northern-Regions
display a positive value significantly above the average (+59%), while the Central and Southern ones
show negative values (-11% and -56%).
Looking at the CTI Performance (Figure 3b), on average, the picture is slightly different. Northern
and Central Regions perform significantly above the average (+41% and 52%, respectively), while
Southern show a negative value on average (-69%).
In both cases, the best and the least performers are in line with the results of the CTI. Again, Emilia
Romagna exhibits the highest value (+277% for CTI Integrity and +167% for CTI Performance),
while Molise the lowest (-91% for CTI Integrity and -100% for CTI Performance). Overall, no
systematic relation appears to occur between the level of CTI and each sub-indicator at regional level;
Figure 3 – CTI Integrity and CTI Performance by Regions
a.CTI Integrity b.CTI Performance
Source: our elaborations.
Then we look at the detailed items of the OIV transparency certifications to further investigate the
differences among the sub-indicators. It emerges a wide heterogeneity across municipalities in the
access to the information (in many cases information is published in pdf files) as well as in the
fulfilment of the obligations, especially for the items about the engagements of both senior public
officials and top managers and the quality of the information about the provision of public services.
For example, when the so-called Citizens Charts (Carte dei Servizi) of the public services exist, they
generally do not refer to all the services and do not contain any indicator to evaluate their provision.
Overall, the degree of completeness is quite low in most of the municipalities and this is reflected in
OIV’s scores. On the contrary, all the municipalities publish the list of their properties and assets,
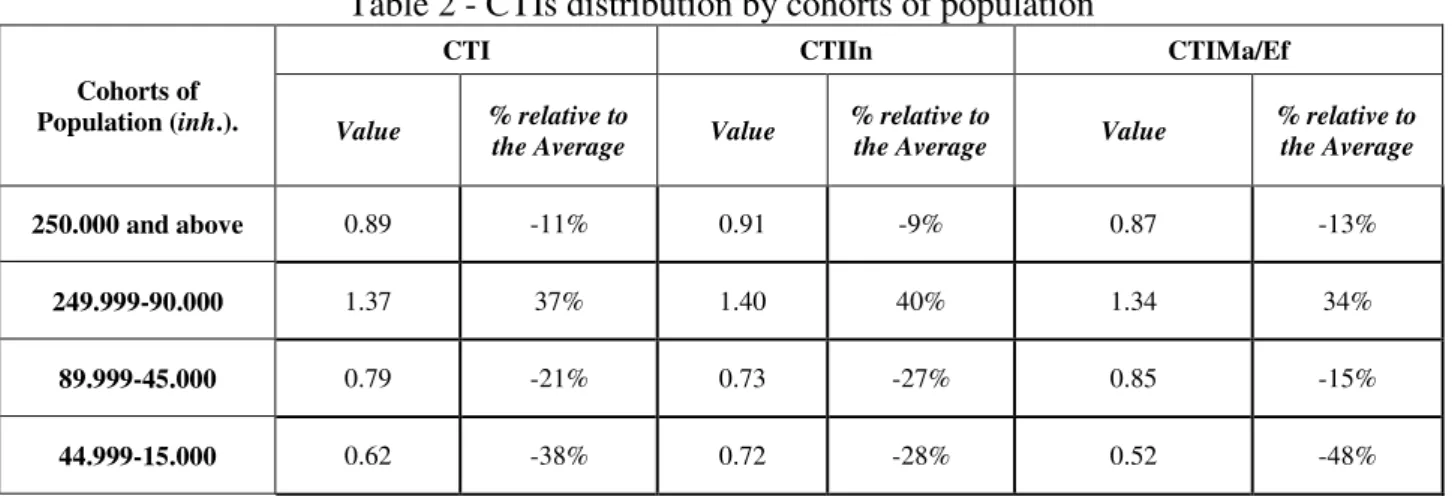
Aforementioned, overall on the ANAC scale (from 0 to 3), the Transparency Average Compliance
of our sample is 1.04 and thetwo extremes values are represented by 1.74 and 0.08. Focusing on the
CTIs by cohorts of population (see Table 2), we can conclude that municipalities size matters. Values
above the average of both the CTI and the CTI Performance are concentrated in the central cluster
(249,999-90,000 inhabitants), while the extremes always show lower values. However, the large
municipalities are the most efficient in displaying the information about the provision of public
services and the public property and assets. As far as Integrity is concerned, again only the relative
larger municipalities show values above the average, while the others do not perform well. In this
context, one might conclude that, while the smallest municipalities may lack resources and expertise
to accomplish all the transparency obligations, the largest may have difficulties in publishing a
complete set of information given their complex organization.
Table 2 - CTIs distribution by cohorts of population
Cohorts of Population (inh.).
CTI CTIIn CTIMa/Ef
Value % relative to
the Average Value
% relative to
the Average Value
% relative to the Average
250.000 and above 0.89 -11% 0.91 -9% 0.87 -13%
249.999-90.000 1.37 37% 1.40 40% 1.34 34%
89.999-45.000 0.79 -21% 0.73 -27% 0.85 -15%
44.999-15.000 0.62 -38% 0.72 -28% 0.52 -48%
Source: own elaborations.
Once we have measured the degree of transparency for the main Italian municipalities, we address
the question whether the ones which are characterized by a higher level of transparency compliance
are located in an area with higher level of quality of institutions and display a better performance in
the provision of public services. To this end, we compare our transparency outcomes with two
well-established indicators which measure, respectively, the quality of institutions (Nifo and Vecchione
2014) and the performance in the provision of public services (SOSE 2016).
The first, called Institutional Quality Index (IQI), is a synthetic indicator constructed on the
hierarchy framework of the World Bank’s WGI for the period 2004-2012 and based on 24 elementary
indexes clustered into five dimensions: 1) voice and accountability (participation in public elections.
number of associations and social cooperatives, degree of freedom of press); 2) government
effectiveness (endowment of social and economic facilities, ability of local governments to manage
the provision of public services); 3) regulatory quality (capacity of the administrations to encourage
and protect business activity, expressed in terms of economic openness, number of public employees,
business density, mortality and environment); 4) rule of law (crimes against property and reported,
tax evasion, judges’ productivity, trials length); 5) control of corruption (crimes against the public
administration, number of administrations run by a commissioner appointed by the central
government, the Golden-Picci Corruption Index). The index is normalized and ranges from 0 (lowest
institutional quality) to 1 (highest institutional quality)28.
The performance of the local public administrations is measured using the official data on
quantitative level of the service provision (QLS) provided by SOSE (2016) on the website
OpenCivitas for the municipalities located in the Ordinary Statute Regions29. QLS is a synthetic
measure of two dimensions. the expenditure gap (i.e. the difference between the actual and standard
28For further details on the methodology, see Nifo and Vecchione (2014).
expenditures) calculated for each public service through the Regression Cost Base Methodology30
and the output gap (i.e. the difference between the actual and standard level of services). In other
words, the indicator QLS measures the capacity of the municipalities to satisfy the demand for local
public services by citizens along a scale which goes from 0 (low performance) to 10 (high
performance)31.
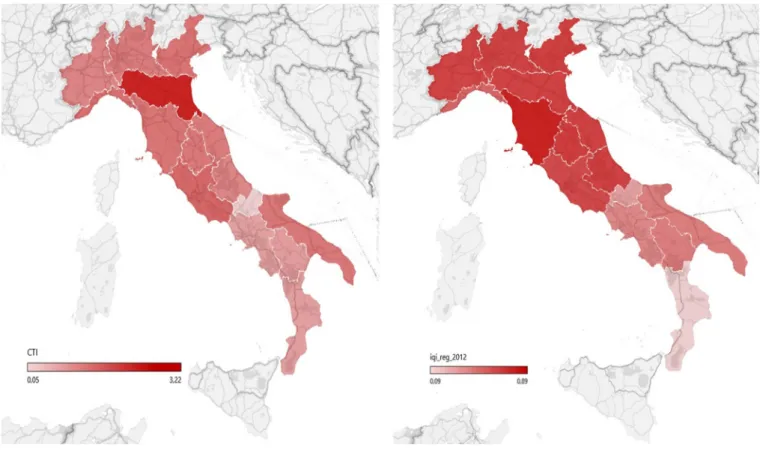
Figure 4exhibits the two indicators CTI and IQI (the latter refers to the value of 2012), both
calculated at the regional level. High levels of IQI are more concentrated in the Northern and Central
regions, while CTI shows a more fragmented picture. In Southern Regions, lower levels of
transparency compliance are associated to a lower level of institutional quality. Overall the two
figures fit rather well though discrepancies appear for Piemonte, Umbria and Marche.
Figure 4 – CTI and IQI
a. CTI b.IQI
30For further details on the methodology, see Porcelli et al. (2016).
Source: own elaborations.
Figure 5shows the pattern of the indicators CTI and QLS (the latter refers to 2013, the last year
currently available). Overall the highest levels of QLS are concentrated in the Northern and Central
Regions. All the Northern Regions show QLS values above the average (which is 5.43) with the
exception of Liguria (4.96). Marche provides the highest quantitative level of public services (6.15).
Most of the Southern Regions instead rank in the lowest positions in the sample as values of the
QLS are below the average (5.43).
Figure 5 – Degree of transparency (CTI) and performance (QLS)
Source: own elaborations.
Simple correlations
We provide a preliminary measure of the relation of transparency with quality of institutions and
performance respectively, using simple correlations. Given that the CTIs are ordinal values, we use
the Spearman’s rank correlation coefficient32. For the sake of completeness, we also use the Pearson’s
product moment correlation coefficient33. In most cases, the values are very similar and lead to the
same conclusions (see Table 3).
The Spearman’s rank correlation coefficient between CTI and IQI is 0.87(the Pearson coefficient
is slightly lower, 0.75); it is 0.84 between CTI and QLS (the Pearson coefficient is slightly lower,
32Being a nonparametric (distribution-free) rank statistic, Spearman’s coefficient is appropriate when either or both variables are skewed or ordinal (Valzand and Thompson 1994; Xu et al. 2010).
0.78). This high level of correlation is rather encouraging as far as the reliability of our CTI is
concerned, suggesting a positive and significant relation between CTI and both IQI and QLS.
Then, we correlate both IQI and QLS with CTI Integrity and CTI Performance, respectively. The
quality of the institutions is highly correlated with both (0.87 and 0.79 with CTI Integrity; 0.82 and
with CTI Performance). The performance in the provision of public services is highly correlated with
CTI Integrity (0.84 and 0.74); surprisingly, less correlated with the CTI Performance (0.67 and 0.58).
A likely explanation is that QLSs closely refer to well identified public services while CTI
Performance includes items which are broadly related to management. Finally, we select three of the
items of IQI (voice and accountability, government effectiveness and control of corruption) which
are the dimensions mainly associated with the transparency issue.
The CTI confirms a high correlation with voice and accountability (0.86), government
effectiveness (0.84) and control of corruption (0.88). Specifically, both CTI Integrity and CTI
Performance are highly correlated with government effectiveness and control of corruption (0.88 and
0.84, respectively); slightly less with voice and accountability (0.81 for the CTI Performance and
0.89 for the CTI Integrity).
Based on these preliminary results we may conclude that our measure of transparency, in both its
integrity and performance dimension, seems to be quite robust and reliable. Transparency turns out
to be significantly and positively correlated with both the well-established indicators of the quality of
institutions and the performance of the provision of public services, showing that there is a nexus
Table 3 -Level of correlation among transparency, quality of institutions and performance (α= 0.05)
INDICATORS
STATISTICS
RhoSpearman’s RPearson’s
TOTAL INDICATORS
- CTI / IQI 0.87 0.75
- CTI / QLS 0.86 0.78
CTI and IQIs SUB-INDICATORS
- CTI / Corruption 0.88 0.73
- CTI / Government Effectiveness 0.84 0.70
- CTI / Voice 0.86 0.70
CTIs SUB-INDICATORS and IQIs SUB-INDICATORS
- CTIIn / Corruption 0.87 0.78
- CTIIn / Government Effectiveness 0.88 0.82
- CTIIn / Voice 0.89 0.85
- CTIMa/Ef / Corruption 0.80 0.79
- CTIMa/Ef / Government Effectiveness 0.84 0.80
- CTIMa/Ef / Voice 0.81 0.77
Source: own elaborations.
Conclusion
In this paper, we address a research question which is almost unexplored in the literature, i.e.
whether there is a relation between transparency, quality of institutions and performance of public
administrations, using Italy as a case study.
We make a first step in this direction suggesting a new methodological approach which produces
a synthetic indicator of transparency (CTI) consisting of two sub-indicators, CTI Integrity and CTI
Performance, which are able to describe the overall degree of transparency of public administration
construct a new dataset collecting official data from the websites of the main municipalities (Province
Capitals) located in all the Italian Ordinary Statute Regions.
Though at a preliminary stage, our analysis confirms that transparency matters. Our indicators
show a satisfactory correlation with widely used measures of the quality of institutions as well as with
the official data on municipalities performance provided by OpenCivitas.
On this ground we may conclude, on the one hand, that our indicators are reliable and robust in
representing transparency as a dimension of a ‘good administration’; on the other hand, that Italian
main municipalities exhibit a quite diversified picture where the degree of transparency seems to be
related to the quality of institutions in the region as well as to their public spending performance.
Some policy implications can be drawn to design cost-effective transparency rules. Fulfilling
transparency obligation is costly and therefore it is important to evaluate its impact. In this
perspective, the stability of rules and obligations and the consolidation of such tools would be very
useful to foster the effectiveness of transparency and reduce the costs of its implementation. Stability
would also allow to evaluate through time the impact of regulation on public administration behavior.
Finally, the correlation between transparency and the quality of institutional environment suggests
that transparency might be challenged in low quality social and institutional environment; this could
be considered a red flag, e.g. a kind of risk assessment indicator at territorial level, to orientate
ex-ante measures to foster transparency and monitoring public administration activities.
Afonso, Antonio, Ludger Schuknecht and Vito Tanzi. 2005.“Public sector efficiency: an international comparison.”Public choice 123(3-4): 321-347.
Afonso, Antonio, and Carla Scaglioni. 2006.“An Assessment of Telecommunications Regulation Performance in the European Union”. ISEG Economics Working Paper No. 07/2006/DE/UECE. Available at SSRN: http://ssrn.com/abstract=849027 or http://dx.doi.org/10.2139/ssrn.849027.
Albalate, Daniel. 2012. “The institutional. economic and social determinants of local government transparency.”Working Paper 2012/10. Research Institute of Applied Economics. University of Barcelona.
Alcaraz-Quile, Francisco J., Andrés Navarro-Galera, and David Ortiz-Rodríguez. 2015. “The Influence of Administrative Culture on Sustainability Transparency in European Local Governments.”Administration & Society 1 –40.
Alt, James E., David D. Lassen, and Shanna Rose. 2006. “The causes of fiscal transparency: evidence from the US States”. IMF Staff Papers 30.
ANAC – Autorità Nazionale Anticorruzione. 2013.Rapportosul primo anno di attuazione della
legge n. 190/2012.Roma.
ANAC – Autorità Nazionale Anticorruzione. 2014. Relazione annuale sull’attività svolta. Anno 2013.Roma.
ANAC – Autorità Nazionale Anticorruzione. 2015. Relazione Annuale 2014. Roma.
ANAC – Autorità Nazionale Anticorruzione. 2016. Relazione Annuale 2015. Roma.
Ashworth, John.,Emma Galli, and Fabio Padovano. 2012.“Decentralization as a constraint to Leviathan: a panel cointegration analysis.”Public Choice11: 1-26.
Bastida, Francisco,Bernardino Benito, andMaría-Dolores Guillamón. 2011. “The determinants of local governments’ financial transparency.”Local Government Studies 37(4): 391-406.
Bellver, Ana, and Daniel Kaufmann. 2005. “Transparenting Transparency: Initial Empirics and Policy Applications.” World Bank Policy Research Working Paper. The World Bank.
Bertelli, Anthony, and Suzanne J. Pietrowsky. 2010. “Measuring municipal transparency.” Unpublished paper prepared and presented at 14th IRSPM conference Bern. Switzerland on 1rst April.
Besfamille, Martin. 2004.“Local Public Works and Intergovernmental Transfers Under Asymmetric Information.”Journal of Public Economics88(1-2):353-375.
Besley, Timothy, and Stephen Coate. 2003.“Centralized versus Decentralized Provision ofLocal Public Goods: A Political Economy Approach.”Journal of Public Economics87(12): 2611-2637.
Boadway, Robin, Isao Horiba, and Jha Raghbendra. 1999.“The Provision of Public Services by Government Funded Decentralized Agencies.”Public Choice100(3-4):157-184.
Brennan, Geoffrey,and James M. Buchanan. 1980.The Power to Tax: Analytical Foundations of a
Fiscal Constitution. Cambridge. UK: Cambridge University Press.
Caamaño-Alegre, Jose, SantiagoLago-Peñas, Francisco Reyes-Santias, and Aurora Santiago-Boubeta. 2011. “Budget Transparency in Local Governments: An Empirical Analysis.”International
Studies Program Working Paper 11-02.Andrew Young School of Policy Studies.Georgia State
University.
Cacciatore, Federica, Fabrizio Di Mascio, and Alessandro Natalini. 2016. “La politica della trasparenza in Italia: Meccanismi sociali e dinamiche del contesto.” mimeo.
CiVIT-Commissione per la valutazione, l’integrità e la trasparenza delle pubbliche amministrazioni. 2012. Relazione sulla performance delle amministrazioni centrali anno 2011. Roma
Cucciniello, Maria, Gregory A. Porumbescu and Stephan Grimmelikhuijsen. 2016. “25 Years of Transparency Research: Evidence and Future Directions”. Public Administration Review 77(1): 32– 44.
Curtin, Deirdre, Albert Meijer, and Maarten Hillebrandt. 2012.“Open Government: Connecting Vision and Voice.” International Review of Administrative Sciences 78(1): 10-29.
Esteller, Alejandro, and José Polo-Otero. 2010. “Análisis de los determinantes de la transparencia fiscal: Evidencia empírica para los municipios catalanes.”Documentos de Trabajo FUNCAS. 560/2010.
Ferraz Esteves de Araujo, Joaquim F., and Francisca Tejedo-Romero. 2016. “Political and Economics Determinant of Information Transparency in Spanish Local Governments”. mimeo.
Ferreira da Cruz, Nuno, António F. Tavares,Rui Cunha Marques, Susana Jorge, and Luís de Sousa. 2016. “Measuring Local Government Transparency.” Public Management Review 18(6): 866-893.
Fiorino, Nadia, Emma Galli, and Fabio Padovano. 2015.“How long does it take for government decentralization to affect corruption.”Economics of Governance 16: 273–305.
Fisman, Raymond, and Roberta Gatti. 2002.“Decentralization and Corruption: Evidence across Countries.”Journal of Public Economics83(3): 325-345.
Heald, David. 2006. “Varieties of Transparency”. In Transparency: The Key to Better
Governance?e dited by Christopher Hood and David Heald: 25-43. Oxford UK: Oxford University
Press.
Holzner, Burkart, and Leslie Holzner. 2006. Transparency in Global Change: the vanguard of the
Open Society. Pittsburgh PA: University of Pittsburgh Press.
Hong, Sounman, 2017. What Are the Areas of Competence for Central and Local Governments? Accountability Mechanisms in Multi-Level Governance. Journal of Public Administration Research
and Theory, 27 (1): 120-134.
Islam, Roumeen. 2004. “Do more transparent governments govern better?”Policy Research
Working Paper 3077.World Bank
Jorge, Susana M., Patricia Moura Sa, Anna Francesca Pattaro, and Pedro R. Lourenço. 2011. “Local government financial transparency in Portugal and Italy: A comparative exploratory study on its determinants.” Paper presented at the 13th Biennial CIGAR conference held in Ghent (Belgium) on 9-10 June.
Kaufmann, Daniel, and Aart Kraay. 2002.“Growth without Governance.”Policy Research
WorkingPaper 2928.World Bank.
Kolstad, Ivar, and Arne Wiig. 2009.“Is Transparency the Key to Reducing Corruption in Resource-Rich Countries?”World Development37(3): 521-532.
Lindstedt, Catharina and Daniel Naurin. 2010. “Transparency is not Enough: Making transparency effective in Reducing corruption.”International Political Science Review 31(3): 301-321.
Meijer, Albert. 2009.“Understanding Modern Transparency. ” International Review of
Administrative Sciences75(2):255-269.
Meijer, Albert. 2013.“Understanding the Complex Dynamics of Transparency.”Public
Administration Review73(3): 429-439.
NavarroGalera, Andrés, Araceli de los Rios Berjillos,Mercedes Ruiz Lozano, and Pilar Tirado Valencia. 2015.“Identifying motivation of the local governments to improve the sustainability transparency.”Review of Administrative Sciences 45: 149-167.
Nifo, Annamaria and Gaetano Vecchione. 2014. “Do Institutions Play a Role in Skilled Migration? The Case of Italy.”Regional Studies 48(10): 1628-1649.
Oates, Wallace E. 2005. “Toward a Second-generation Theory of Fiscal Federalism.”
International Tax and Public Finance 12(4): 349 - 373.
Oates, Wallace E. 2008. “On the Evolution of Fiscal Federalism: Theory and Institutions.”National
Tax Journal LXI: 313-334.
OECD. 2013. Reinforcing public sector integrity for sustainable economic growth of Italy.Paris.
OECD. 2013. 2015. Government at a glance. Paris.
Olken, Benjamin A. 2007. “Monitoring Corruption: Evidence from a Field Experiment in Indonesia.”Journal of Political Economy 115(2):200-249.
Porcelli, Francesco,Francesco Vidoli, and Roberto Dispotico. 2016.” Public Sector Economics and the Need for Reforms. A Simple Four Quadrants Model to Monitor the Performance of Local Governments.”In Public Sector Economics and the Need for Reforms. Edited by Apostolis Philippopoulos: 273-301. Cambridge MA: MIT Press.
Park, Heungsik, and John Blenkinsopp. 2011.“The roles of transparency and trust in the relationship between corruption and citizen satisfaction.”International Review of Administrative Sciences 77(2): 254-274.
Peisakhin, Leonid, and Paul Pinto. 2010.“Is transparency an effective anti-corruption strategy? Evidence from a field experiment in India.”Regulation and Governance 4: 261-280.
Piotrowski, Suzanne J. 2008. Governmental Transparency in the Path of Administrative Reform. Albany. NY State: University of New York Press.
Piotrowski, Suzanne J., and Gregg G. Van Ryzin. 2007. “Citizen Attitudes Toward Transparency in Local Government.”The American Review of Public Administration 37(3): 306-323.
Redoano, Michela. 2010.“Does Centralization Affect the Number and Size of Lobbies?”Journal
of Public Economic Theory12(3):407 - 435.
Reinikka, Ritva, and Jakob Svensson. 2004.“Local Capture: Evidence from a Central Government Transfer Program in Uganda.”The Quarterly Journal of Economics. 119(2):678-704.
SOSE. 2016. The Italian way towards Standard Expenditure Needs. Accessed February 13th.
http://www.opencivitas.it/progetto-fabbisogni-standard
Tommasi, Mariano, and Federico Weinschelbaum.2007. “Centralization vs. Decentralization: A Principal-agent Analysis.” Journal of Public Economic Theory9(2): 369-389.
Valz, Paul D., and Mary E. Thompson. 1994. “Exact inference for Kendall’s s and Spearman’s ρ
with extension to Fisher’s exact test in r×c contingency tables.”Journal of Computational and
Graphical Statistics 3(4):459–472.