MASTER OF SCIENCE IN
Actuarial Science
MASTER
’
S FINAL WORK
INTERNSHIP REPORT
Recent Social Security Reforms and its Impact on
Old Age Pensions: A Simulation Analysis for Portugal
Gabriela Miriam Kinnunen da Silva
MASTER OF SCIENCE IN
Actuarial Science
MASTER
’
S FINAL WORK
INTERNSHIP REPORT
Recent Social Security Reforms and its Impact on
Old Age Pensions: A Simulation Analysis for Portugal
Gabriela Miriam Kinnunen da Silva
Supervisors:
Doutora Maria Teresa Medeiros Garcia
Mestre Carla Sá Pereira
i
Recent Social Security Reforms and its Impact on Old
Age Pensions: A Simulation Analysis for Portugal
Abstract
In Portugal, the public old age pension system funding is based on the pay
as you go method wh
ere workers’ contributions pay the pensions of current
pensioners. Throughout the years, many changes have been done in the Social
Security system legislation, namely regarding retirement pensions. The most
recent reform caused an increase in the normal retirement age and added some
factors to the calculation of the retirement benefit.
In this report we analyze the impact of those reforms on the old age pension
benefit under the Social Security system and on the present value of private
pension funds responsibilities. Therefore, we consider the main features of both
the public old age pension system and the complementary private pension
plans, offered by banks to their employees.
Keywords: normal retirement age; retirement pension; Social Security system;
ii
Reformas Recentes na Segurança Social e o Seu Impacto
nas Pensões de Velhice: Uma Simulação para Portugal
Resumo
Em Portugal, o financiamento do sistema público de pensões de velhice é
baseado no método de repartição em que as contribuições dos trabalhadores
pagam as pensões dos atuais reformados. Ao longo dos anos, muitas alterações
foram efetuadas na legislação do sistema da Segurança Social, nomeadamente
no que se refere às pensões de reforma. Assim sendo, as reformas mais recentes
levaram ao aumento da idade normal de reforma e adicionaram alguns fatores
ao cálculo do benefício da pensão de reforma.
Neste relatório, iremos analisar o impacto dessas reformas no valor das
pensões de reforma no âmbito do sistema de Segurança Social e no valor atual
das responsabilidades dos fundos de pensões privados. Assim, iremos
considerar as principais características quer do sistema público de pensões quer
dos planos de pensões privados complementares, oferecidos pelos bancos aos
seus colaboradores.
Palavras-chave: idade normal de reforma; pensão de reforma; Segurança Social;
iii
Acronyms and Abbreviations
ACT: Collective Work Agreement (
Acordo Colectivo de Trabalho
).
ALE: Average life expectancy at age 65. It is published annually by the INE.
DL: Decree-Law.
IAS: Social Support Index (
Indexante dos Apoios Sociais
). The IAS is defined by
the Ordinance at vigor that year. At the moment it is equal to 419,22 euros as
defined by the Ordinance no. 286-A/2014 at December 31.
INE: Portuguese Statistics Institute (
Instituto Nacional de Estatística
).
NRA: Normal retirement age.
OECD: Organization for Economic Co-operation and Development.
PAYG: Pay as you go.
PBO: Present value of the benefits with past service or projected benefit
obligation.
SF: Sustainability factor.
iv
Table of Contents
Preface ... 1
1. Introduction ... 2
2. Complementary pension plans ... 3
3. Portuguese Social Security system ... 5
3.1. The current Social Security system ... 5
3.2. Retirement pension requirements ... 6
3.3. Retirement pension ... 7
4. Recent reforms in the Social Security Pension ... 9
4.1. Normal retirement age ... 9
4.2. Sustainability factor ... 11
4.3. Bonus factor ... 13
5. Impact of the reforms ... 14
5.1. Impact on SS pension – real population ... 14
5.1.1. Impact of the change in the NRA ... 15
5.1.2. Impact of the Sustainability Factor ... 17
5.1.3. Impact of the additional bonus factor ... 17
5.1.4. The total impact of the reform ... 18
5.1.4.1. The impact in the value of the pensions ... 18
5.1.4.2. The impact in the present value of the responsibilities with past services ... 19
5.2. Impact on SS pension - standard population ... 21
5.3. Banking sector ... 25
5.3.1. Complementary pension plan ... 25
5.3.2. Impact of the reform on complementary pensions - example ... 26
6. Conclusions ... 28
7. References ... 30
Appendix A: Social Security old age pension variables ... 32
Appendix B: ALE and NRA projections ... 33
Appendix C: Results of the SS Pension ... 39
v
List of Charts
Chart 1: Evolution in the world’s old age dependency ratio ... 5
Chart 2: Projection of ALE by the 3 models from 2016 to 2100... 10
Chart 3: Comparison between the real ALE and the one estimated by the 3 models ... 38
Chart 4: Impact of the NRA (Scenario 1) ... 44
Chart 5: Impact of the NRA (Scenario 2) ... 44
Chart 6: Impact of the NRA (Scenario 3) ... 45
List of Tables
Table I: Some advantages and disadvantages of complementary pension plans ... 4Table II: SS Pension for beneficiaries with more than 20 years of contributions ... 7
Table III: SS Pension computation ... 8
Table IV: SF evolution from 2008-2026... 12
Table V: Impact of the reform in the value of the SS pensions ... 19
Table VI: Impact of the reform in the PBO ... 20
Table VII: Impact of the reform in the PBO (with modified data) ... 20
Table VIII – Average monthly net income in Portugal, by age group ... 21
Table IX: Standard population based on INE's information ... 21
Table X: Impact of the reform on the value of pensions for a standard population ... 22
Table XI: Retirement date and age according to DL no. 167-E/2013 for a standard population ... 23
Table XII: Sustainability Factor for each scenario ... 23
Table XIII: Impact of the reform in the PBO for a standard population ... 24
Table XIV: Impact of the reform in the PBO of banks ... 26
Table XV: Discounted payback period for each model ... 27
Table B. I: Projection of ALE and the retirement age for 2016-2040 (Model 1) ... 33
Table B. II: Projection of ALE and the retirement age for 2016-2040 (Model 2) ... 35
vi
Table C. I: Population data ... 39
Table C. II: SS pensions computed with the DL no. 187/2007 ... 40
Table C. III: SS pensions computed with the DL no. 167-E/2013 ... 40
Table C. IV: Modified Population data ... 41
Table C. V: Changes done from the real population to the modified population ... 41
Table C. VI: SS pensions computed with the DL no. 187/2007 (modified population) ... 42
Table C. VII: SS pensions computed with the DL no. 167-E/2013 (modified population) ... 42
Table D. I: Impact of NRA (Scenario 1) ... 43
Table D. II: Impact of NRA (Scenario 2) ... 43
Table D. III: Impact of NRA (Scenario 3) ... 44
1
Preface
This work is the result of a three-month curricular internship done in the actuarial department of Ernst & Young (EY). During this period of time, I had the opportunity to work in non-life insurance and pension funds.
In non-life, I analyzed the data of past claims and the projections of future claims mainly by Chain Ladder and Bootstrap methods.
I N T R O D U C T I O N
2
1.
Introduction
The SS system has been a very discussed theme in most of the countries across the world. This discussion is due to the current demographic and economic developments that may not be compatible with the PAYG method, which is the method used to finance most of the SS systems in the world (MacNicol, 2004; Population Reference Bureau, 2009)). Although opinions on the sustainability of the SS system seem to diverge a lot, most of the countries have taken measures to increase the NRA and to change the benefits formulas, in order to make the system more sustainable from the financial point of view1. Portugal has
been no exception.
In the last 8 years, there have been many changes in the Portuguese SS, although some of them are temporary. The most relevant are:
DL no. 187/2007 at May 10 – changed the SS pension benefit and added a SF; DL no. 167-E/2013 at December 31 – changed the NRA, the SF and other factors.
Therefore, it’s important to analyze the impact of the most recent reforms in the SS. These reforms impact not only the SS pension, but also complementary pension plans. If the SS legislation is constantly changing, complementary pension funds will have to deal with a high level of uncertainty, as the amount of their responsibilities may suffer a significant increase or decrease, depending on the legislation.
This report will focus on the SS old age retirement pension and the complementary old age pension plans that are associated to it. In order to do so, we will analyze the most recent reform (DL no. 167-E/2013) and its impact on complementary pensions. As one of the most known sponsors of complementary pension plans in Portugal is the banking sector, we will study the impact DL no.167-E/2013 had in the banks responsibilities with old age pensions. All results presented in this document were computed in Excel using Visual Basic for Applications (VBA).
1
C O M P L E M E N T A R Y P E N S I O N P L A N S
3
2.
Complementary pension plans
Pension plans can be qualified in many ways. If we focus on the relationship of the pension plans with the SS, we can divide them as:
1. SS independent pension plans: pension plans where the computation of the
benefits doesn’t depend on the benefit or any parameter of the SS pension;
2. Complementary pension plans: pension plans where the benefit depends on the
benefit or some parameter of the SS pension.
2.1 Fully integrated with the SS: the total benefit of the employee (pension of the
plan + SS pension) is defined. The pension fund pays the difference between the benefit the employee should receive and the benefit paid by the SS.
2.2 Partially integrated with the SS: it is similar to the fully integrated with the only difference that it has an upper limit to the amount the pension plan pays. 2.3 Suppletive pension plans: other pension plan that depend on the SS pension
(i.e., 2 × SS pension).
C O M P L E M E N T A R Y P E N S I O N P L A N S
4
Table I: Some advantages and disadvantages of complementary pension plans
Remark: The description of these kind of pension plans present in Bodie (1990) helped to construct this summary.
Advantages Disadvantages
T
o t
h
e
e
mp
loy
e
r
Attract employees because it provides
them an insurance against the changing
of SS legislation;
Transfers the SS risk from the employee
to the company;
Uncertainty relatively to the amount of
contributions the company has to do;
T
o t
h
e
e
mp
loy
e
e
Ensure retirement income equity for all
employees;
The employer covers adverse changes in
the SS retirement benefit;
The employee knows what benefit he/she
will receive when he/she retires;
The employee can't add more
contributions if he/she wants;
The employee doesn't decide how the
P O R T U G U E S E S O C I A L S E C U R I T Y S Y S T E M
5
3.
Portuguese Social Security system
3.1.
The current Social Security system
The SS systems are very different from country to country2 not only in the computation
of its pensions but also in its requirements and, most important, in its funding method. There are funded and unfunded SS systems (Plamondon et al., 2002). In Europe most of them are unfunded – their funding method consists in a PAYG basis where workers’ contributions are used to pay the pensions of today’s retirees. This kind of funding method may not be sustainable because countries, in general, have been confronted with an increasing old-age dependency ratio3.
Chart 1: Evolution in the world’s old age dependency ratio
Source: World Bank, 2015.
Portugal has a system that is neither completely funded nor completely unfunded. A part of the Portuguese SS is based on a PAYG system but the other is funded based through the creation of the Financial SS Stabilization Fund (Fundo de Estabilização Financeira da Segurança Social), a pension reserve fund. Many countries have adopted this kind of measure due to the high transition costs associated with a change from a PAYG to a SS
2
See OECD (2015) for a detailed explanation of the SS pensions system for the countries of G20 (G20 includes Argentina, Australia, Brazil, Canada, China, India, Indonesia, Japan, Mexico, Russia, Saudi Arabia, South Africa, South Korea, Turkey, US and the EU countries).
3
Usually the old age dependency ratio is computed asno. of people aged 65 and overno. of people aged 15 -65 .
P O R T U G U E S E S O C I A L S E C U R I T Y S Y S T E M
6 system similar to Chile4 (Kritzer, 2002), completely funded. In Portugal, the majority of the
benefits granted by the SS are still financed by the PAYG system; the Financial SS Stabilization Fund works as a small buffer that can only guarantee the benefits payment during approximately one year (13,78 months according to the last report issued by the Fund at 2014) 5.
The current SS system in Portugal is based in the Social Security Basic Law approved by the Law no. 4/2007 at January 16.
This report will only focus in the old age retirement pension since the others are not included in its scope6.
3.2.
Retirement pension requirements
In Portugal, an individual who decides to retire before the NRA will usually get a reduction in his pension. On the other hand, if the individual retires after the NRA a bonus will be added to his pension. This kind of penalty/bonus system exists to motivate the active population to retire later.
An individual who wishes to retire without any reduction in his SS pension needs to verify two requirements: his retirement age has to be equal or higher than the NRA and he must have 15 years or more of contributions for the SS, as defined by the article no. 19 of the DL no. 187/2007. However, there are four cases, referred below, that are exceptions to these two requirements7:
The flexibility of the retirement age;
The anticipation of the retirement age caused by the nature of the job;
Temporary measures for the specific protection of companies or activities by conjectural reasons;
In the case of long term involuntary unemployment;
4
In the Chilean model, the PAYG system was replaced by a system where workers contribute to individual retirement savings accounts.
5
Pursuant to article no. 1 of the Regulamento de Gestão do Fundo de Estabilização Financeira da
Segurança Social, the goal of the Financial SS Stabilization Fund is to provide enough funds to
cover the expectable expenses with pensions, during at least 2 years.
6
The SS system also provides other kinds of pensions, i.e., disability pensions.
7
P O R T U G U E S E S O C I A L S E C U R I T Y S Y S T E M
7 We will only analyze the standard situation of retiring at an age equal or higher to the NRA since the majority of the Portuguese population does so - as can be seen in the OECD (2015).
3.3.
Retirement pension
If a beneficiary decides to retire at the NRA – i.e. there is neither penalty nor bonus in the benefit received – the SS pension is computed as follows (please see Appendix A in order to get a better understanding of the SS old age pension computation):
If a beneficiary is admitted after January 1, 2002:
And the beneficiary has 20 or less years of contributions:
𝑃8= 𝑅𝐸 × 2% 𝑁, with 2% 𝑁 ≥ 30%
And the beneficiary has more than 20 years of contributions:
In this case, the formula used to compute the pension will depend of the RE of the beneficiary. In Table II computation for each level of RE is presented.
Table II: SS Pension for beneficiaries with more than 20 years of contributions
RE Monthly Pension received (P)
𝑃 = 𝑅𝐸 × 2,3% × 𝑁
𝑃 = (1,1 𝐼𝐴𝑆 × 2,3% × 𝑁) + {(𝑅𝐸 − 1,1 𝐼𝐴𝑆) × 2,25% × 𝑁}
𝑃 = (1,1 𝐼𝐴𝑆 × 2,3% × 𝑁) + (0,9 𝐼𝐴𝑆 × 2,25% × 𝑁) + {(𝑅𝐸 − 2 𝐼𝐴𝑆) × 2,2% × 𝑁}
𝑃 = (1,1 𝐼𝐴𝑆 × 2,3% × 𝑁) + (0,9 𝐼𝐴𝑆 × 2,25% × 𝑁) + (2 𝐼𝐴𝑆 × 2,2% × 𝑁) + {(𝑅𝐸 − 4 𝐼𝐴𝑆) × 2,1% × 𝑁}
𝑃 = (1,1 𝐼𝐴𝑆 × 2,3% × 𝑁) + (0,9 𝐼𝐴𝑆 × 2,25% × 𝑁) + (2 𝐼𝐴𝑆 × 2,2% × 𝑁) + (4 𝐼𝐴𝑆 × 2,1% × 𝑁) + {(𝑅𝐸 − 8 𝐼𝐴𝑆) × 2% × 𝑁}
Source: DL no. 187/2007 at May 10
If a beneficiary is admitted until December 31, 2001:
In the table below we have the summary of the SS pension computation for a beneficiary who is admitted in the SS until December 31, 2001.
8
P is the SS monthly pension of the beneficiaries admitted after January 1, 2002. [1,1 𝐼𝐴𝑆; 2 𝐼𝐴𝑆[
[2 𝐼𝐴𝑆; 4 𝐼𝐴𝑆[
[4 𝐼𝐴𝑆; 8 𝐼𝐴𝑆[
P O R T U G U E S E S O C I A L S E C U R I T Y S Y S T E M
8
Table III: SS Pension computation
If the beneficiary retires:
until December 31, 2016: after January 1, 2017:
𝑃∗=(𝑃1 × 𝐶1 + 𝑃2 × 𝐶2)
𝐶
𝑃∗=(𝑃1 × 𝐶3 + 𝑃2 × 𝐶4)
𝐶
𝐶 = 𝐶1 + 𝐶2; 𝐶 = 𝐶3 + 𝐶4;
Exception:
If the beneficiary has at least 46 years
of contributions he will receive the
maximum between this pension (𝑃∗) and the one computed previously (P).
Source: DL no. 187/2007 at May 10
𝑃2 is computed as 𝑃.
𝑃1 = 2% 𝑛 ×14×𝑁𝑅
15, where 30% ≤ 2% 𝑛 ≤ 80%
The SS pension is paid monthly and has 14 payments. At July and at December of each year the beneficiary receives the monthly pension plus an equal amount that corresponds to the Vacations and the Christmas subsidy.
Exceptions:
Notice that 𝑃1 has to verify 𝑷𝟏 ≤ 𝟏𝟐 × 𝑰𝑨𝑺 (unless 𝑃2 > 𝑃1).
R E C E N T R E F O R M S I N T H E S O C I A L S E C U R I T Y P E N S I O N
9
4.
Recent reforms in the Social Security Pension
As referred before, the evolution of demographic and economic factors has suggested that maybe the SS system needs some changes in its architecture. Having that in mind, the Government has been concerned in trying to revert this situation through changes in the legislation of the SS pensions.
The most important reform is probably the one done by the DL no. 167-E/2013 at December 31 which changes the DL no. 187/2007 at May 10. At the DL no. 167-E/2013 we can identify three main modifications to the previous system:
The NRA increased;
The Sustainability Factor (SF) formula changed;
A bonus factor was added for the computation of the retirement age - for workers with more than 40 years of contributions.
Each of these changes will be explained in further detail.
4.1.
Normal retirement age
Until 2013, the NRA in Portugal had remained constant in 65 for a long time, at least since 1949 – as can be observed in OECD (2011). However, it did not remain unchanged in this reform. The NRA changed from the usual 65 to 66 in 2014 and in 2015 in order to adjust it to the change occurred in the SF. However, after 2015 the NRA will change every year, depending on the evolution of the average life expectancy at age 65 (ALE). In the article no. 20 of DL no. 187/2007 including already the changes made by the DL no. 167-E/2013, the new normal age of retirement will be calculated as being the NRA at 2014 (66 years) plus 𝑚 months where:
𝑚𝑟9= ∑ (𝐴𝐿𝐸𝑖−2− 𝐴𝐿𝐸𝑖−3) × 12 ×23 𝑟
𝑖=2015
(𝟏)
R E C E N T R E F O R M S I N T H E S O C I A L S E C U R I T Y P E N S I O N
10 Notice that this expression can be simplified:
𝑚𝑟 = ∑𝑖=2015𝑟 (𝐴𝐿𝐸𝑖−2− 𝐴𝐿𝐸𝑖−3) × 12 ×23= 8 × ∑𝑟𝑖=2015(𝐴𝐿𝐸𝑖−2− 𝐴𝐿𝐸𝑖−3)=
= 8 × [(𝐴𝐿𝐸2013− 𝐴𝐿𝐸2012) + (𝐴𝐿𝐸2014− 𝐴𝐿𝐸2013) + ⋯ + (𝐴𝐿𝐸𝑟−3− 𝐴𝐿𝐸𝑟−4) + (𝐴𝐿𝐸𝑟−2−
𝐴𝐿𝐸𝑟−3)] = 8 × (𝐴𝐿𝐸𝑟−2− 𝐴𝐿𝐸2012)
and 𝑚 = [𝑚𝑟], i.e. 𝑚 represents the rounded integer part of 𝑚𝑟. So we can say that:
𝑁𝑅𝐴 = 66 years and [8 × (𝐴𝐿𝐸𝑟−2− 𝐴𝐿𝐸2012)] months (𝟐)
In order to better understand the impact this change will have in the evolution of the NRA, it is necessary to do a projection of the ALE. Appendix B shows the projection of ALE and NRA for three different10. These models represent an ALE with a constant annual
growth, an ALE that depends linearly on the ALE verified on the previous year and a model where the ALE depends linearly on time. Looking at the chart presented below we can see that model 1 and 3 have similar estimates while model 2 gives us a projection with a slower growth of ALE.
Chart 2: Projection of ALE by the 3 models from 2016 to 2100
In Chapter 5 we will analyze the impact these projections will have on pensions, for each of the chosen models.
10
In addition to these three models, we studied the use of a lognormal model and the use of a model who depends linearly of the ALE of the two previous years but rejected these options since the variables were not statistically significant.
0 5 10 15 20 25 30 35 40
2016 2026 2036 2046 2056 2066 2076 2086 2096
Av e ra ge l if e e xp e cta n cy a t 65 Year
Model 1 Model 2 Model 3
R E C E N T R E F O R M S I N T H E S O C I A L S E C U R I T Y P E N S I O N
11
4.2.
Sustainability factor
The SF is a ratio that reflects the evolution of the ALE; the higher is ALE in the future, the smaller will be SF, so, when it is applied to the pension calculation, the benefit will decrease.
This factor was introduced in Portugal for the first time in 2007 with the DL no. 187/2007. Its main purpose is to reduce or increase the amount of the benefit at retirement in function of the ALE. This way, pensions can be adjusted according with the evolution of the ALE.
The SF, before being changed by the DL no. 167-E/2013, was given by:
𝑆𝐹 =𝐴𝐿𝐸𝐴𝐿𝐸2006
𝑟−111
(𝟑)
With the alteration of the legislation, instead of considering the ALE at year 2006, the SF considers the ALE at year 2000 which has a higher reduction effect than the one used before. Therefore, the SF is:
𝑆𝐹 =
𝐴𝐿𝐸
𝐴𝐿𝐸
2000𝑟−1
(𝟒)
In order to analyze the impact of this reform, we can compute (4)/(3) which will give us the ratio 𝐴𝐿𝐸𝐴𝐿𝐸2000
2006 that is equal to 92,7% and corresponds to a reduction of 7,3%. So, when we
apply the new SF, independently of the behavior of the ALE we’ll get a reduction effect of 7,3% relatively to the SF obtained with the previous legislation. To illustrate the evolution of the SF from one DL to another we can analyze Table IV. In this table the values of SF computed with the formula given by (3) and by (4) are presented, that correspond to the 2nd and 3rd column of the table. We computed this factor since 200812 until 2026. We can
observe in Table IV that SF suffered a huge decrease along the years (due to the increase of ALE) which also means a higher reduction of the pensions where it is applied.
11 Where 𝑟 is the year of retirement.
12
R E C E N T R E F O R M S I N T H E S O C I A L S E C U R I T Y P E N S I O N
12
Table IV: SF evolution from 2008-2026
Retirement
year (r)
SF
DL no. 187/2007 DL no. 167/2013
2008 99,34% 92,08%
2009 98,52% 91,32%
2010 98,14% 90,97%
2011 96,50% 89,46%
2012 95,68% 88,69%
2013 95,22% 88,27%
2014 94,57% 87,66%
2015 93,83% 86,98%
2016 93,49% 86,66%
2017 92,67% 85,90%
2018 91,86% 85,15%
2019 91,07% 84,42%
2020 90,29% 83,69%
2021 89,52% 82,98%
2022 88,77% 82,29%
2023 88,03% 81,60%
2024 87,30% 80,92%
2025 86,58% 80,26%
2026 85,88% 79,61%
Remark: Please note that the values stated between year 2008 and 2016 are based on historical values, while the ones from 2017-2026 are computed with the projections from Model 1.
The SF presented in (4) is only applicable to people who retire after January 1, 2014; individuals who retired until December 31, 2013, had their pension computed with the previous SF. But the modification done to the formula of the SF was not the only change occurred. In the changes done in the DL no. 187/2007, this SF was created to reduce the
R E C E N T R E F O R M S I N T H E S O C I A L S E C U R I T Y P E N S I O N
13
4.3.
Bonus factor
The changes mentioned before have the objective of making the SS system more sustainable from a financial point of view. There are many disagreements, mainly political to the use of this kind of measures since they create dissatisfaction in the active population.
Modifications in pensions’ computation are usually seen as a sign of financial unsustainability, creating doubts on workers about the benefit they will actually receive at retirement. The 3rd change tries to reduce a little this demotivation from the workers. For the 1st time, a bonus factor is introduced to workers with more than 40 years of contributions13. Once a beneficiary makes 65 years and has more than 40 years of
contributions his NRA is reduced by 4 months for each extra year above the 40 – being the minimum retirement age 65.
The impact of these changes will be studied in more detail in Chapter 5.
13
T H E I M P A C T O F T H E R E F O R M S
14
5.
Impact of the reforms
There are many ways to measure the impact of a reform in the SS pensions’
computation. We will measure this effect in two ways:
Comparing the value of the pensions;
Comparing the present value of benefits (PVB).
In order to do so, we need to choose a funding method to compute the PVB. In this
report, we will always use the Projected Unit Credit method, since it is the funding
method recommended by IAS1914 for pension funds. Thus, the actuarial liability for
active members will be computed as the present value of benefits in respect of past
service (PBO), as can be seen below:
𝑷𝑩𝑶 = 𝑷𝑽𝑩 × 𝒑𝒂𝒔𝒕 𝒔𝒆𝒓𝒗𝒊𝒄𝒆
𝒕𝒐𝒕𝒂𝒍 𝒔𝒆𝒓𝒗𝒊𝒄𝒆 (𝟓)
This method takes into account expected future salary increases (therefore being
called a “Projected” method), it is an accrued benefit method (for more details see
McGill et al. (2005) or Pugh (2006)).
Notice that in this report we are only focusing in the impact for pensions of
employees who retire at the NRA.
5.1.
Impact on SS pension
–
real population
In this chapter, we will examine the impact of the change from the DL no. 187/2007
to the DL no. 167-E/2013 by analyzing the effect it had on the value of the SS pension
and on the present value of responsibilities with past service (for the Government). To
compute these effects we will use the population presented in Table C. I (see
Appendix C).
14
T H E I M P A C T O F T H E R E F O R M S
15
As we saw in the previous chapter, many factors changed from DL no. 187/2007 to
DL no. 167-E/2013 and therefore each of these factors has to be considered separately.
At the end of our analysis we will also verify the effect they have as a whole.
In order to see the impact of the reform we will compare the value of the SS pension
computed with the previous legislation (that we will call Before) and the SS pensions
that have the new changes included (that we will call After).
All computations assume that there will be no more changes in the most recent
legislation. In order to obtain the values presented in the tables below, we computed
the SS pension with the two legislations referred previously. All the results and
assumptions used to calculate the SS pension are presented in Appendix C and
AppendixD.
5.1.1.
Impact of the change in the NRA
Following the reasoning referred before we will first study the effect of the new
NRA. In order to check the impact of the change in the computation of NRA
exclusively, we have to assume that the values computed as After include only the
change occurred in the NRA. Our assumptions are detailed in the table below.
Assumptions
Before:
Pensions computed as defined in the DL no. 187/2007:
The NRA is 65
The SF is applied and computed as (3)
There is no bonus factor
After:
The NRA is computed with the formula given in (2) defined in DL no. 167-E/2013
The SF is applied and computed as (3)
There is no bonus factor
Nonetheless these assumptions are not enough because the change in the NRA brings up another question: the time value of money (i.e. receiving a pension of 900€ at 2015 or at 2025 isn’t the same as there exists inflation and interest). So we have to add
one extra assumption: there is an annual discount rate and we will use three different
T H E I M P A C T O F T H E R E F O R M S
16
Due to the constant increase of the ALE the use of formula (2) to compute the NRA
will cause an increase in its value. A rise in the NRA implies that people will retire
later, hence the increase will cause two effects:
1. Pensioners will have more years of contributions and possibly higher past
salaries which means an increase in the value of the pensions they will
receive;
2. Pensioners will receive their pensions later, receiving consequently fewer
payments and their pensions will suffer a reduction because of the interest
rate effect.
Thus, the value of the pensions will increase or decrease depending of which effect
is higher. Analyzing the results for each of the discount rate scenarios (Table D. I,
Table D.II and Table D.III in Appendix D), we can conclude that the change in the
NRA will either have a positive or negative effect in the pensions depending of the
discount rate. For Scenario 1 the effect referred in point 1 is higher than the effect
referred in 2 so we have an increase on the value of the pensions. However, the higher
is the discount rate, the higher is its effect. This effect is easy to verify in Scenario 2 and
Scenario 3: contrasting with the increase on the value of the pensions verified in
Scenario 1, in these scenarios we will have a decrease on pensions15.
The use of an adequate discount rate is therefore very important – since it has direct
impact on the conclusions taken. Looking at the discount rates used in 2015 by Banks
for pension funds, we can see the rates were around 2,5%16. Therefore, in the next
results we will use an annual discount rate of 2,5% as it is consistent with the current
Portuguese market.
15
The impact of the discount rate on pensions can be easily analyzed in Chart 4, Chart 5 and
Chart6 available in Appendix D.
16
T H E I M P A C T O F T H E R E F O R M S
17
5.1.2.
Impact of the Sustainability Factor
In this section we will study the impact of the SF alone and consequently we have to
consider the following assumptions:
Assumptions
Before:
Pensions computed as defined in the DL no. 187/2007:
The NRA is 65
The SF is applied and computed as (3)
There is no bonus factor
After:
The NRA is 65
The SF is not applied
There is no bonus factor
The pensions computed with these assumptions are presented in the Table D. IV
(see Appendix D). As referred earlier in Chapter 4, with the new legislation the SF is
no longer applied to the pensions of beneficiaries who retire at the NRA. As our scope
only includes pensioners who retire at the NRA, we would expect this change to cause
an increase in the pensions, ceteris paribus.
Our expectations are fulfilled since we verify and conclude (Table D. IV in
Appendix D) that this change increased a lot the value of the pensions, independently
of the model used. Calculating a sample mean, we can conclude that this new change
increased the pensions by 12,7%, 9,7% and 13,4% for models 1,2 and 3, respectively.
5.1.3.
Impact of the additional bonus factor
Regarding the bonus factor, its impact will not be analyzed separately since the
T H E I M P A C T O F T H E R E F O R M S
18
5.1.4.
The total impact of the reform
The conclusions taken in the previous sections can be summarized as follows:
1. The increase in the NRA has two effects:
a. It increases the value of the pension as there are more years of contributions;
b. It decreases the value of the pensions because of the interest rate effect.
2. The non-applicability of the SF will increase the value of the pensions;
3. The bonus factor, when applicable, should somehow reduce the effect given by
the increase of the NRA.
Analyzing the impact of the reform as a whole, as the discount rates are very low
and the effect of not applying the SF is very high this reform should lead to an increase
in the value of the pensions (i.e., the effect of 1a is higher than the effect of 1b).
Nevertheless a decrease on the PBO should be expected as people will retire later (i.e.,
pensioners will receive fewer payments).
To study the total impact of the new measures we will do the following:
For the column referred as Before we will calculate the SS pension as if the
DL no. 187/2007 was still in force;
For the column referred as After we will calculate the SS pension with the
new legislation in force (DL no. 167-E/2013);
We will consider an annual discount rate of 2,5%.
5.1.4.1.The impact in the value of the pensions
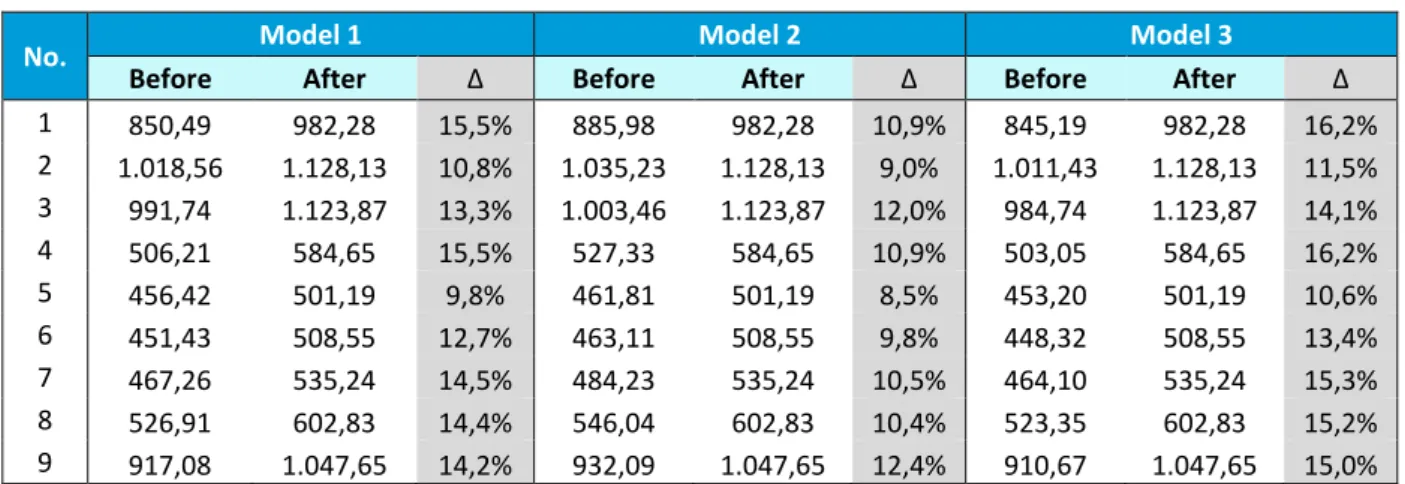
Looking at the table presented below, we can conclude that this new measure
T H E I M P A C T O F T H E R E F O R M S
19
Table V: Impact of the reform in the value of the SS pensions
No. Model 1 Model 2 Model 3
Before After ∆ Before After ∆ Before After ∆
1 850,49 982,28 15,5% 885,98 982,28 10,9% 845,19 982,28 16,2% 2 1.018,56 1.128,13 10,8% 1.035,23 1.128,13 9,0% 1.011,43 1.128,13 11,5% 3 991,74 1.123,87 13,3% 1.003,46 1.123,87 12,0% 984,74 1.123,87 14,1% 4 506,21 584,65 15,5% 527,33 584,65 10,9% 503,05 584,65 16,2% 5 456,42 501,19 9,8% 461,81 501,19 8,5% 453,20 501,19 10,6% 6 451,43 508,55 12,7% 463,11 508,55 9,8% 448,32 508,55 13,4% 7 467,26 535,24 14,5% 484,23 535,24 10,5% 464,10 535,24 15,3% 8 526,91 602,83 14,4% 546,04 602,83 10,4% 523,35 602,83 15,2% 9 917,08 1.047,65 14,2% 932,09 1.047,65 12,4% 910,67 1.047,65 15,0%
Remark: ∆ is the percentage of increase/decrease occurred from Before to After. Notice that the values in
After are referred to the same time reference than the ones in Before using an annual discount rate of 2,5%. The values are presented in euros.
5.1.4.2.The impact in the present value of the responsibilities with past services
In order to examine the impact of the reforms in the PBO we will need to add the
following assumptions:
Mortality Table: TV88/90;
Projected Unit Credit funding method.
The results obtained in the table below show that the PBO increased instead of
decreasing – with exception of beneficiary no. 3 and 9. These unexpected results are
due to a very peculiar feature of our population: most of the employees started
working at an early age (see Table C.I in Appendix C) thus when they get to age 65
they have almost 50 years of contributions, which allows them to benefit a lot from the
bonus factor. The effect of this feature can be summarized in the following way: with
this new reform our population will retire at age 65 or close but with a higher
pension17. So, we can conclude that in the case of PBO, we have to be careful with the
conclusions taken because its value will decrease or increase depending on the
characteristics of the population that is being used18.
17
To get a better understanding about the differences on the results obtained for each of the DL, please analyze Table C.II and Table C.III present in Appendix C.
18
T H E I M P A C T O F T H E R E F O R M S
20
Table VI: Impact of the reform in the PBO
No. Model 1 Model 2 Model 3
Before After ∆ Before After ∆ Before After ∆
1 78.576,14 90.752,37 15,5% 81.855,08 90.752,37 10,9% 78.086,22 90.752,37 16,2% 2 133.560,99 147.929,59 10,8% 135.747,15 147.929,59 9,0% 132.626,53 147.929,59 11,5% 3 131.634,15 121.718,95 -7,5% 133.189,15 121.718,95 -8,6% 130.705,28 121.718,95 -6,9% 4 45.947,34 51.913,75 13,0% 47.864,70 53.067,39 10,9% 45.660,86 51.913,75 13,7% 5 62.311,20 68.424,22 9,8% 63.047,28 68.424,22 8,5% 61.871,50 68.424,22 10,6% 6 51.399,58 57.903,32 12,7% 52.730,23 57.903,32 9,8% 51.045,97 57.903,32 13,4% 7 45.758,91 52.416,15 14,5% 47.420,36 52.416,15 10,5% 45.449,28 52.416,15 15,3% 8 51.056,63 57.114,77 11,9% 52.910,43 57.114,77 7,9% 50.711,15 57.114,77 12,6% 9 113.577,39 105.992,92 -6,7% 115.436,46 108.516,56 -6,0% 112.782,75 105.992,92 -6,0%
Remark: ∆ is the percentage of increase/decrease occurred from Before to After. Notice that the values in
After are referred to the same time reference than the ones in Before using an annual discount rate of 2,5%. The values are presented in euros.
With the purpose of understanding better the effect referred above, we will use our current population and change their date of entrance in the company to a later date (see Table C.V in Appendix C). The rest of the data will remain equal. In the table below, we
have the same impact analysis used in Table VI but with the modified data. In Table VII we get the results we were expecting: the PBO decreased.
Table VII: Impact of the reform in the PBO (with modified data)
No. Model 1 Model 2 Model 3
Before After ∆ Before After ∆ Before After ∆
1 73.500,86 71.696,90 -2,5% 76.568,02 70.375,44 -8,1% 73.042,59 71.696,90 -1,8% 2 120.175,37 121.560,70 1,2% 122.142,43 121.560,70 -0,5% 119.334,56 123.637,13 3,6%
3 131.637,72 121.722,35 -7,5% 133.192,76 121.722,35 -8,6% 130.708,83 121.722,35 -6,9% 4 42.129,80 40.860,59 -3,0% 43.887,85 41.153,90 -6,2% 41.867,12 40.860,59 -2,4%
5 59.599,71 56.983,07 -4,4% 60.303,76 56.983,07 -5,5% 59.179,15 56.983,07 -3,7% 6 49.016,95 46.603,62 -4,9% 50.285,92 46.603,62 -7,3% 48.679,73 46.603,62 -4,3%
7 41.661,64 40.703,95 -2,3% 43.174,32 41.744,72 -3,3% 41.379,73 40.703,95 -1,6% 8 46.437,21 46.746,39 0,7% 48.123,28 45.942,56 -4,5% 46.122,99 45.606,23 -1,1%
9 97.081,30 94.425,67 -2,7% 98.670,35 97.048,61 -1,6% 96.402,07 94.425,67 -2,1%
Remark: ∆ is the percentage of increase/decrease occurred from Before to After. Notice that the values in
After are referred to the same time reference than the ones in Before using an annual discount rate of 2,5%. The values are presented in euros.
T H E I M P A C T O F T H E R E F O R M S
21
the current active population, further analysis is needed since our data set is not an adequate sample of the Portuguese population.
5.2.
Impact on SS pension - standard population
Having in account the characteristics of our population19, we can conclude that the
results which apply to this particular set of beneficiaries don’t extend to the general population. Therefore we decided to evaluate the impact of the changes in a standard population. In order to perform that analysis we considered the following data:
Table VIII – Average monthly net income in Portugal, by age group
Age Monthly wage
From 15 to 24 years old 533 From 25 to 34 years old 725 From 35 to 44 years old 868 From 45 to 64 years old 906 With 65 years old or older 715
Source: INE, Inquérito ao Emprego
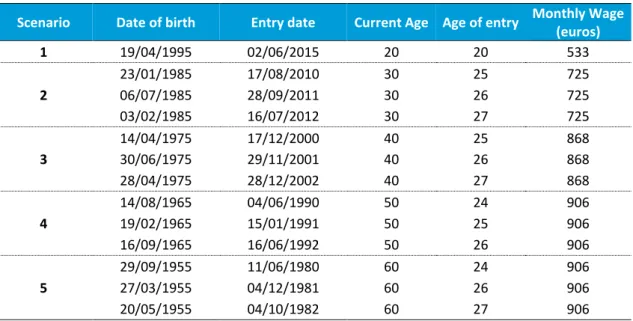
Based on this data we created five different scenarios for beneficiaries who are 20, 30, 40, 50 and 60 years old. With exception of one beneficiary who is 20 years old, we considered that this standard sample started working at an age between 24 and 2720.
Table IX: Standard population based on INE's information
Scenario Date of birth Entry date Current Age Age of entry Monthly Wage (euros) 1 19/04/1995 02/06/2015 20 20 533
2
23/01/1985 17/08/2010 30 25 725 06/07/1985 28/09/2011 30 26 725 03/02/1985 16/07/2012 30 27 725
3
14/04/1975 17/12/2000 40 25 868 30/06/1975 29/11/2001 40 26 868 28/04/1975 28/12/2002 40 27 868
4
14/08/1965 04/06/1990 50 24 906 19/02/1965 15/01/1991 50 25 906 16/09/1965 16/06/1992 50 26 906
5
29/09/1955 11/06/1980 60 24 906 27/03/1955 04/12/1981 60 26 906 20/05/1955 04/10/1982 60 27 906
19
The population analyzed has already an advanced age and has many years of contributions to the SS, these features do not represent the majority of the active population in Portugal .
20
T H E I M P A C T O F T H E R E F O R M S
22
To this part of the report it is important to refer that for our previous population we had small differences between the results obtained for each model (Table V and Table VI), in this analysis we will see higher deviances in the results between the models. This is due to the advanced age of our population and because the projections of ALE for the first years, for each model, do not differ a lot. If we analyze Chart 2, it’s easy to conclude that although the three models start the projections with similar values, afterwards there is a big drift between model 2 and model 1 and 3. These differences will be reflected in our results21.
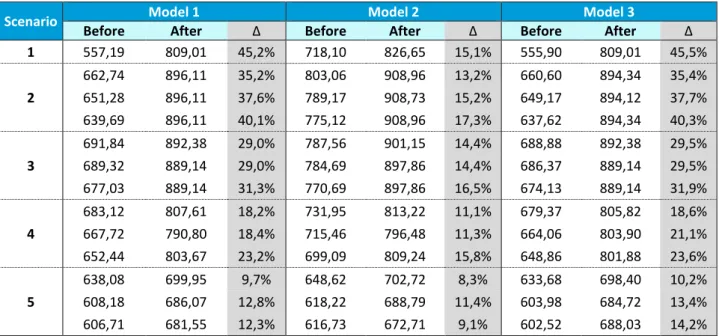
Table X: Impact of the reform on the value of pensions for a standard population
Scenario Model 1 Model 2 Model 3
Before After ∆ Before After ∆ Before After ∆ 1 557,19 809,01 45,2% 718,10 826,65 15,1% 555,90 809,01 45,5%
2
662,74 896,11 35,2% 803,06 908,96 13,2% 660,60 894,34 35,4%
651,28 896,11 37,6% 789,17 908,73 15,2% 649,17 894,12 37,7% 639,69 896,11 40,1% 775,12 908,96 17,3% 637,62 894,34 40,3%
3
691,84 892,38 29,0% 787,56 901,15 14,4% 688,88 892,38 29,5%
689,32 889,14 29,0% 784,69 897,86 14,4% 686,37 889,14 29,5% 677,03 889,14 31,3% 770,69 897,86 16,5% 674,13 889,14 31,9%
4
683,12 807,61 18,2% 731,95 813,22 11,1% 679,37 805,82 18,6% 667,72 790,80 18,4% 715,46 796,48 11,3% 664,06 803,90 21,1%
652,44 803,67 23,2% 699,09 809,24 15,8% 648,86 801,88 23,6%
5
638,08 699,95 9,7% 648,62 702,72 8,3% 633,68 698,40 10,2% 608,18 686,07 12,8% 618,22 688,79 11,4% 603,98 684,72 13,4%
606,71 681,55 12,3% 616,73 672,71 9,1% 602,52 688,03 14,2%
Remark: ∆ is the percentage of increase/decrease occurred from Before to After. Notice that the values in
After are referred to the same time reference than the ones in Before using an annual discount rate of 2,5%. The values are presented in euros.
Regarding the value of pensions, we can conclude that recent changes done by DL no. 167-E/2013 resulted in higher pensions. Moreover, this increase is higher to people at younger ages (Table X). This behavior can be partially explained by the evolution of the NRA for each of these scenarios. Evaluating Table XI, we can conclude that younger beneficiaries will have to work more years in order to achieve the NRA. This will result in higher wages at the last years since we assume their salary will increase 2% every year.
21
All results will be computed with the same assumptions used in the previous chapter, namely:
Discount rate of 2,5%;
Mortality Table TV88/90;
T H E I M P A C T O F T H E R E F O R M S
23
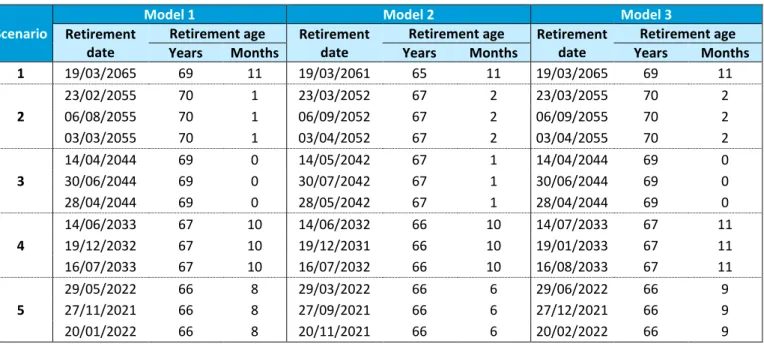
Table XI: Retirement age according to DL no. 167-E/2013 for a standard population
Scenario
Model 1 Model 2 Model 3
Retirement date
Retirement age Retirement date
Retirement age Retirement date
Retirement age Years Months Years Months Years Months 1 19/03/2065 69 11 19/03/2061 65 11 19/03/2065 69 11
2
23/02/2055 70 1 23/03/2052 67 2 23/03/2055 70 2 06/08/2055 70 1 06/09/2052 67 2 06/09/2055 70 2 03/03/2055 70 1 03/04/2052 67 2 03/04/2055 70 2
3
14/04/2044 69 0 14/05/2042 67 1 14/04/2044 69 0 30/06/2044 69 0 30/07/2042 67 1 30/06/2044 69 0 28/04/2044 69 0 28/05/2042 67 1 28/04/2044 69 0
4
14/06/2033 67 10 14/06/2032 66 10 14/07/2033 67 11 19/12/2032 67 10 19/12/2031 66 10 19/01/2033 67 11 16/07/2033 67 10 16/07/2032 66 10 16/08/2033 67 11
5
29/05/2022 66 8 29/03/2022 66 6 29/06/2022 66 9 27/11/2021 66 8 27/09/2021 66 6 27/12/2021 66 9 20/01/2022 66 8 20/11/2021 66 6 20/02/2022 66 9
In addition to this fact we also have to consider the impact of the SF on pensions computed by the DL no. 187/2007 (present in column Before). Through Table XI, it is possible to conclude that younger beneficiaries will have a lower SF when they retire at 65, which means receiving a lower pension when compared with the one received by older beneficiaries (e.g., in model 3 an individual who is now 20 years old will only receive 66,62% of his pension while a beneficiary who is 50 years old will receive 82,03%).
Table XII: Sustainability Factor for each scenario
Scenario Model 1 Model 2 Model 3
1 66,84% 86,54% 66,62%
2 71,36% 86,96% 71,08%
3 76,54% 87,64% 76,18%
4 82,52% 88,90% 82,03%
5 89,52% 91,39% 88,90%
To sum up, with this new DL younger people will have higher increases on their
pensions’ value due to two situations:
1. They will retire later and therefore will have higher wages to be considered in the computation of their pension;
T H E I M P A C T O F T H E R E F O R M S
24
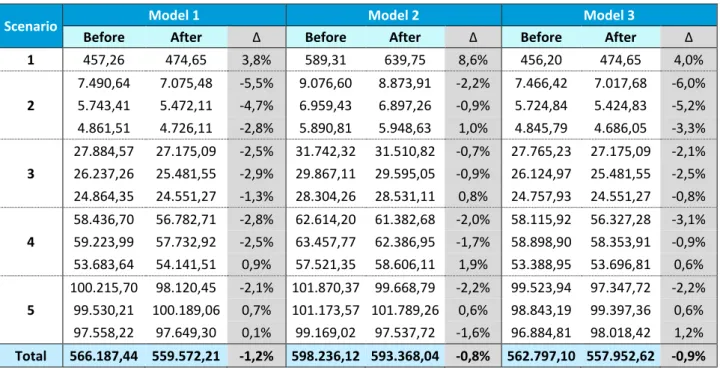
Table XIII: Impact of the reform in the PBO for a standard population
Scenario Model 1 Model 2 Model 3
Before After ∆ Before After ∆ Before After ∆ 1 457,26 474,65 3,8% 589,31 639,75 8,6% 456,20 474,65 4,0%
2
7.490,64 7.075,48 -5,5% 9.076,60 8.873,91 -2,2% 7.466,42 7.017,68 -6,0% 5.743,41 5.472,11 -4,7% 6.959,43 6.897,26 -0,9% 5.724,84 5.424,83 -5,2%
4.861,51 4.726,11 -2,8% 5.890,81 5.948,63 1,0% 4.845,79 4.686,05 -3,3%
3
27.884,57 27.175,09 -2,5% 31.742,32 31.510,82 -0,7% 27.765,23 27.175,09 -2,1%
26.237,26 25.481,55 -2,9% 29.867,11 29.595,05 -0,9% 26.124,97 25.481,55 -2,5% 24.864,35 24.551,27 -1,3% 28.304,26 28.531,11 0,8% 24.757,93 24.551,27 -0,8%
4
58.436,70 56.782,71 -2,8% 62.614,20 61.382,68 -2,0% 58.115,92 56.327,28 -3,1%
59.223,99 57.732,92 -2,5% 63.457,77 62.386,95 -1,7% 58.898,90 58.353,91 -0,9% 53.683,64 54.141,51 0,9% 57.521,35 58.606,11 1,9% 53.388,95 53.696,81 0,6%
5
100.215,70 98.120,45 -2,1% 101.870,37 99.668,79 -2,2% 99.523,94 97.347,72 -2,2% 99.530,21 100.189,06 0,7% 101.173,57 101.789,26 0,6% 98.843,19 99.397,36 0,6%
97.558,22 97.649,30 0,1% 99.169,02 97.537,72 -1,6% 96.884,81 98.018,42 1,2%
Total 566.187,44 559.572,21 -1,2% 598.236,12 593.368,04 -0,8% 562.797,10 557.952,62 -0,9%
Remark: ∆ is the percentage of increase/decrease occurred from Before to After. Notice that the values in
After are referred to the same time reference than the ones in Before using an annual discount rate of 2,5%. The values are presented in euros.
Regarding the impact on the present value of responsibilities, in Scenario 1 we can see the case of a beneficiary who is part of the small group of people who start working at an early age and who benefit from the bonus factor. This results in an increase of PBO for any of the three models. However this result does not extend to all scenarios. For people who start working after 24, in general the PBO has decreased, with the younger age groups being the ones to suffer a higher reduction.
T H E I M P A C T O F T H E R E F O R M S
25
5.3.
Banking sector
5.3.1.
Complementary pension plan
In general, banks are ruled by a unique and common ACT. The ACT is an agreement between one or more companies and the respective union that establishes the working conditions that will be applied to the workers. We will focus in the retirement pensions defined in this ACT as they are complementary pensions.
The most recent change in the banking sector ACT was done in 2012. At the moment, the updated ACT is the one published in the Boletim do Trabalho e Emprego no. 8 at February 29, 201222.
With the recent changes done to the ACT banks have currently two types of plans:
For the employees admitted before January 1, 2008: a defined benefit plan;
For employees admitted after January 1, 2008: a defined contribution plan.
Since the purpose of this work is to explore the complementary pension plans we will only focus on the defined benefit plan offered to employees admitted before January 1, 2008 and who are covered by the SS23. The retirement pension benefit is computed as:
𝐵 = (𝑥% × 𝐵𝑤𝑎𝑔𝑒+ 𝐵𝑠𝑒𝑛𝑖𝑜𝑟) − 𝐵𝑆𝑆 (𝟔)
𝐵 monthly benefit paid by the bank.
𝑥%percentage in function of the total service time in the banking sector. It’s given in the
Annex V of the ACT;
𝐵𝑤𝑎𝑔𝑒 monthly benefit obtained in function of the level of salary of the employee. Its value is fixed in the Annex VI of the ACT;
22
Boletim do Trabalho e Emprego is a document published weekly that contains information about
the working regulations, statutes and other relevant information for the working environment.
23
T H E I M P A C T O F T H E R E F O R M S
26
𝐵𝑠𝑒𝑛𝑖𝑜𝑟 monthly benefit obtained in function of the tenure bonus (diuturnidade) given to the
employee at the year before retirement. It’s computed as explained in the clause no. 105 of the ACT;
𝐵𝑆𝑆 monthly benefit paid by the SS.
The NRA to acquire this pension is 65 years, which means banks have to support the cost of this pension all by themselves until the NRA defined for the SS.
Pursuant to the classification presented in Chapter 2, this is a pension plan fully integrated with the SS.
5.3.2.
Impact of the reform on complementary pensions - example
The impacts observed in the previous subchapter show that in general this new reform increased the value of pensions and decreased the PBO. In addition, since the SS pension is only received later, this implies banks will have to pay 100% of their employees’ pensions from 65 until the correspondent NRA. We will now analyze what is the impact of these measures on the banking sector responsibility for an hypothetical population of 5 individuals24.
Table XIV: Impact of the reform in the PBO of banks
No. Model 1 Model 2 Model 3
Before After ∆ Before After ∆ Before After ∆
1 4.323,15 3.328,13 -23% 2.301,39 1.833,46 -20% 4.352,06 3.328,13 -24% 2 10.173,25 6.707,97 -34% 6.508,27 4.620,59 -29% 10.222,36 6.808,65 -33% 3 94.609,65 85.038,77 -10% 85.045,40 80.787,74 -5% 95.537,68 85.796,10 -10% 4 71.010,75 63.200,77 -11% 65.106,36 60.435,18 -7% 71.417,75 63.606,70 -11% 5 117.437,52 103.604,41 -12% 113.224,72 102.558,44 -9% 118.164,64 104.111,14 -12%
Remark: ∆ is the percentage of increase/decrease occurred from Before to After. Notice that the values in
After are referred to the same time reference than the ones in Before using an annual discount rate of 2,5%. The values are presented in euros.
Looking at the table above we can see that the change that occurred in the SS pension
resulted on a decrease in banks’ responsibilities regarding this population. This is due to
the high increase in the value of the SS pensions offered by the State. However, the increase of the NRA causes a big pressure for banks on the first years of retirement. In order to see
24
T H E I M P A C T O F T H E R E F O R M S
27
this effect let’s consider 𝐵(2007)𝑡 and 𝐵(2013)𝑡 the annual pension on year t which is
responsibility of the bank according to DL no. 187/2007 and DL no. 167-E/2013, respectively. If we consider as negative cash flows 𝑡𝑝𝑥× 𝐵(2007)𝑡 and as positive cash flows the ones given by 𝑡𝑝𝑥× 𝐵(2013)𝑡, where 𝑡𝑝𝑥 represents the probability of a person 𝑥 years old surviving until age 𝑥 + 𝑡, then we can compute the discounted payback period as being the minimum 𝑡 for which:
∑ 𝑡𝑝𝑥× (1,25)−𝑡× (𝐵(2013)𝑡− 𝐵(2007)𝑡) 𝑡≥0
> 0 (𝟕)
The discounted payback period will provide us information on how many years does it take until the responsibilities of the bank with the new legislation decrease when compared with the previous one.
Table XV: Discounted payback period for each model
No. Model 1 Model 2 Model 3
1 20,00 18,00 20,00 2 12,00 6,00 12,00 3 20,00 26,00 20,00 4 18,00 19,00 19,00 5 9,00 7,00 9,00
28
6.
Conclusions
In this report, we analyzed the impacts of the change on the legislation regarding the SS old age pension to workers who retire at the NRA. Our study focused on two main impacts: the effect on pensions given by SS and the effect on complementary pensions offered by banks, according to the ACT.
The results were obtained through the use of Excel and Visual Basic for Applications which are useful tools, easy to work on. Nevertheless, our data set was relatively small and a larger data set could have demanded the use of statistical software.
First, we analyzed the effect of each of the changes done in DL no. 167-E/2013 individually. Then, we studied the effect of the reform as a whole on the pensions value and on PBO. Results showed us that for a regular Portuguese worker, who starts to work at age 25 or later, the pensions increased in value but Government’s responsibilities with retirement pensions decreased.
In general, this reform allowed a reduction on the Government’s responsibilities due to the effect of increasing the NRA. However, this rise of the NRA has negative effects which are not taken into account in the computations. Looking at Table B.I in Appendix B, according to Model 1, the NRA in Portugal at 2040 will be 68 years and 10 months, opposing to the 65 years at 2013. This evolution on the NRA is caused by higher average life expectancies. A higher average life expectancy means people will live longer, but living
longer isn’t equivalent to being able to work longer. If a person lives in average until 100
years old it is highly unlikely that the individual is healthy enough – both physically and mentally – to work until 70 or 80 years.
I agree with the argument that SS systems in general, Portugal in particular, need to be restructured, but increasing the NRA isn’t the “magic solution” and governments have had a big disregard for workers by assuming they can work at such late ages.
29
which means banks have to support the cost of this pension all by themselves until the NRA defined for the SS.
All computations were performed with data sets of small dimension and therefore are not a representative sample, larger data sets would have been preferable to take conclusions. Additionally, it was not possible to get real data to compute the banking pension, hence the conclusions taken do not apply to the banking sector in general.
30
7.
References
Bodie, Z. (1990), Pensions as Retirement Income Insurance, Journal of Economic Literature, Vol. XXVIII (March), pp. 28-49.
Boletim do Trabalho e Emprego, N.º 3 (2011), de 22 de janeiro, Acordo Colectivo de Trabalho entre várias instituições de crédito e a FEBASE. Available from:
http://bte.gep.msess.gov.pt/completos/2011/bte3_2011.pdf [Accessed 27 September 2015].
Boletim do Trabalho e Emprego, N.º 8 (2012), de 29 de fevereiro, Acordo Colectivo de Trabalho entre várias instituições de crédito e a FEBASE. Available from:
http://bte.gep.msess.gov.pt/completos/2012/bte8_2012.pdf [Accessed 27 September 2015].
Diário da República, 1.ª série — N.º 11 (2007), Law no. 4/2007, at January 16. Available from: [Accessed 27 September 2015].
Diário da República, 1.ª série — N.º 90 (2007), Decree-Law no. 187/2007, at May 10. Available from: https://dre.pt/application/file/520704 [Accessed 27 September 2015].
Diário da República, 1.ª série — N.º 253 (2013), Decree-Law no. 167-E/2013, at December 31. Available from: https://dre.pt/application/file/164489 [Accessed 27 September 2015].
Diário da República, 1.ª série — N.º 243 (2014), Ordinance no.266/2014, at December 17. Available from: https://dre.pt/application/file/65891202 [Accessed 27 September 2015].
Diário da República, 1.ª série — N.º 252 (2014), Ordinance no. 286-A/2014, at December 31. Available from: https://dre.pt/application/file/66014835 [Accessed 27 September 2015].
European Parliament (2014). Pension Schemes, Study for the EMPL Committee.
Instituto de Gestão de FunFrom (2014), Regulamento de Gestão do Fundo de Estabilização Financeira da Segurança Social 2014
31
MacNicol, R. (2004). Pension: Finance, Risk and Accounting. In Encyclopedia of Actuarial Science. John Willey & Sons, Ltd.
McGill, D. M., Brown, K. N., Haley, J. J., Schieber, S., & Warshawsky, M. J. (2005). Fundamentals of private pensions (2005). New York, US: Oxford University Press, Inc.
OECD (2011). Pensions at a Glance 2011: Retirement-income Systems in OECD and G20 Countries, OECD Publishing. http://dx.doi.org/10.1787/pension_glance-2011-en
OECD. (2015). Pensions at a Glance 2015: OECD and G20 indicators. OECD Publishing. http://dx.doi.org/10.1787/pension_glance-2015-en
Plamondon, P., Drouin, A., Binet, G., Cichon, M., McGillivray, W. R., Bédard, M., & Perez-Montas, H. (2002). Actuarial Practice in Social Security. Geneva: International Labour Office.
Population Reference Bureau (2009). Social Security Systems Around the World, Today's Research on Aging, (15) [Online] Available from: Population Reference Bureau.
http://www.prb.org/pdf09/TodaysResearchAging15.pdf [Accessed 1 August 2015]
32
Appendix A: Social Security old age pension variables
𝑵: Total number of years with contributions relevant, maximum of 40.
𝑹: Total of the 10 best wages in the last 15years with contributions (or if there is less than 10, the total wages registered in the last 15 years).
𝑵𝟏𝟓: Total number of years with contributions in the last 15 years, with the maximum of 10.
𝒏: Total number of years with contributions.
𝑹𝑬: Reference earnings; where:
𝑅𝐸 =14 × 𝑁𝑇𝐸
𝑻𝑬: Total earnings (wages) of all the years with contributions, with the maximum of 40 years – if the beneficiary has more than 40 consider the best 40 wages. Notice that these wages should be revalued. The wages referring to periods previous to January 1, 2002 should be revalued using the IPC excluding housing (available in the Annex I of the Ordinance no.266/2014). The wages referring to posterior years should be revalued as the ones referred before unless the following formula allows the beneficiary to have a higher benefit:
75% × 𝐼𝑃𝐶𝑒𝑥𝑐𝑙𝑢𝑑𝑖𝑛𝑔 ℎ𝑜𝑢𝑠𝑖𝑛𝑔+ 25% ×average evolution of the contributions to the SS
(Available in the Annex II of the Ordinance no.266/2014).
Where this formula is limited to a maximum equal to 𝐼𝑃𝐶𝑒𝑥𝑐𝑙𝑢𝑑𝑖𝑛𝑔 ℎ𝑜𝑢𝑠𝑖𝑛𝑔+ 0,5%. 𝑪𝟏: Number of years with contributions of relevant wages until December 31, 2006.
𝑪𝟐: Number of years with contributions with relevant wages after January 1, 2007.
𝑪𝟑: Number of years with contributions with relevant wages until December 31, 2001.
𝑪𝟒: Number of years with contributions with relevant wages after January 1, 2002.
Remark: Note that the number of years is computed in accordance with the definition
33
Appendix B: ALE and NRA projections
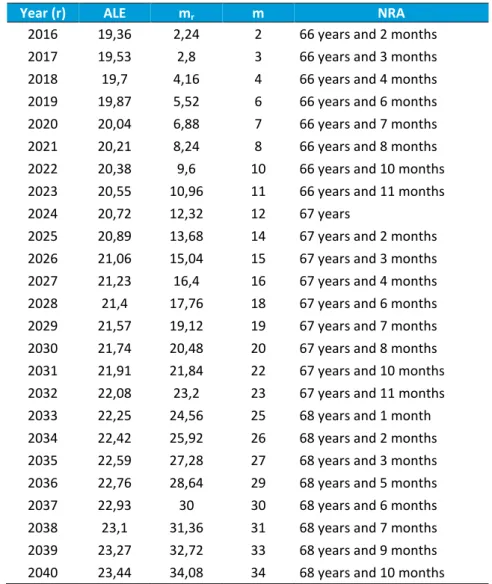
Model 1:
𝑨𝑳𝑬
̂
𝒕= 𝑨𝑳𝑬
̂
𝒕−𝟏+ 𝟎, 𝟏𝟕𝟎𝟔𝟔𝟕
Remark: the annual growth considered was computed as the average annual growth of the ALE from the year 2000 until the year 2015. For this computation INE tables were used to obtain the ALE.
Table B. I: Projection of ALE and the retirement age for 2016-2040 (Model 1)
Year (r) ALE mr m NRA
2016 19,36 2,24 2 66 years and 2 months 2017 19,53 2,8 3 66 years and 3 months
2018 19,7 4,16 4 66 years and 4 months 2019 19,87 5,52 6 66 years and 6 months
2020 20,04 6,88 7 66 years and 7 months 2021 20,21 8,24 8 66 years and 8 months
2022 20,38 9,6 10 66 years and 10 months 2023 20,55 10,96 11 66 years and 11 months
2024 20,72 12,32 12 67 years
2025 20,89 13,68 14 67 years and 2 months
2026 21,06 15,04 15 67 years and 3 months 2027 21,23 16,4 16 67 years and 4 months
2028 21,4 17,76 18 67 years and 6 months 2029 21,57 19,12 19 67 years and 7 months
2030 21,74 20,48 20 67 years and 8 months 2031 21,91 21,84 22 67 years and 10 months
2032 22,08 23,2 23 67 years and 11 months 2033 22,25 24,56 25 68 years and 1 month
2034 22,42 25,92 26 68 years and 2 months
2035 22,59 27,28 27 68 years and 3 months 2036 22,76 28,64 29 68 years and 5 months
2037 22,93 30 30 68 years and 6 months 2038 23,1 31,36 31 68 years and 7 months
2039 23,27 32,72 33 68 years and 9 months 2040 23,44 34,08 34 68 years and 10 months Assumptions
34
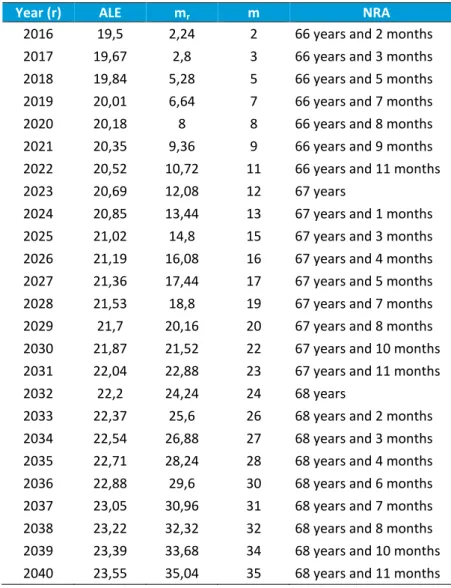
Model 2:
𝑨𝑳𝑬
̂
𝒕= 𝟏, 𝟐𝟓𝟕𝟏 + 𝟎, 𝟗𝟑𝟗𝟔 𝑨𝑳𝑬
̂
𝒕−𝟏Assumptions
ALE depends linearly of the ALE in the previous year
Remarks: the ALE was estimated using the ordinary least squares method
Model 2 - Statistical Input
Regression Statistics
Multiple R 0,9923
R Square 0,9847 Adjusted R Square 0,9835
Standard Error 0,0946
Observations 15
ANOVA
df SS MS F Significance F
Regression 1 7,4647 7,4647 834,5815 0,0000 Residual 13 0,1163 0,0089
Total 14 7,5810
Coefficients Standard Error t Stat P-value
Intercept 1,2571 0,5858 2,1460 0,0513