FIRE RESISTANCE OF PROTECTED AND
UNPROTECTED CELLULAR BEAMS
Lamri Brahim
Final thesis presented to
SCHOOL OF TECHNOLOGY AND MANAGEMENT
POLYTECHNIC INSTITUTE OF BRAGANÇA
For the fulfilment of the Master Degree in
CONSTRUCTION ENGINEERING
FIRE RESISTANCE OF PROTECTED AND
UNPROTECTED CELLULAR BEAMS
Lamri Brahim
Final thesis submitted to the
School of Technology and Management
Polytechnic Institute of Bragança
For the fulfilment of the Master Degree in
CONSTRUCTION ENGINEERING
Supervisor at IPB:
Prof Dr. Luis Mesquita
Supervisor at UHBC:
Prof Dr. Abdelhak Kada
ACKNOWLEDGMENTS:
I would like to thank my supervisor Dr. Luis Mesquita and Dr.Kada Abdelhak for giving
me the opportunity to carry out research work related to the field of structural engineering
and fire protection. I am highly indebted to his valuable thoughts and contributions towards
the development of my thesis and also for providing me with an sample amount of
knowledge about the field of fire protection engineering.
I would also like to thank the entire laboratory assistants for their guidelines and support as
a senior to help me carry out appropriate research strategies for facilitating this thesis
project.
My special thanks to all the other staff members at the Civil Engineering of Polytechnic
Institute of Bragança whose contributions and supports have been invaluable.
I would like to deliver my thankfulness to acknowledge the help given by teachers, and
friends who involved directly or indirectly to the success of this thesis.
Finally, thanks to my familly for encouragement, love, guidance and support needed
Resumo
As vigas alveolares são vigas de aço estruturais que são mais profundas do que as
secções laminadas convencionais com furos localizados na alma. Como o modo de colapso
por encurvadura local da alma pode ocorrer antes da secção atingir a temperatura limite,
normalmente é necessário um aumento do material de proteção dos elementos com
aberturas na alma em comparação com as secções sólidas equivalentes. Verificando-se que
a temperatura do aço da alma entre as furações é superior à temperatura das vigas sólidas
motivou a realização de ensaios experimentais ao fogo. Estes ensaios foram
maioritariamente realizados pelos fabricantes de tintas intumescentes devido à necessidade
de fornecerem as suas próprias tabelas de espessuras, e os resultados mantidos
confidenciais.
A espessura de tinta intumescente requerida para fornecer a capacidade de resistência
ao fogo definida regulamentarmente de uma viga alveolar depende da espessura da alma,
das dimensões e forma das furações, da largura da alma entre furações (web post), do grau
de utilização da seção e da eficiência de proteção da tinta intumescente. A avaliação de
desempenho das tintas intumescentes aplicadas a vigas alveolares requer uma análise
elementar da temperatura, da alma e dos banzos, considerando os resultados dos testes em
vigas sólidas segundo a EN 13381-8. Estes resultados definem uma linha base que é
complementada com os resultados de testes de resistência ao fogo de vigas alveolares,
segundo a EN 13381-9, que permitem a avaliação de desempenho em função da largura da
alma entre furações (web posts) e o fator de massividade da secção.
Este trabalho apresenta uma investigação relativa ao comportamento de vigas alveolares
em condições de incêndio com e sem materiais de proteção ao fogo. São analisadas vigas
com diferentes geométricas ao nível do diâmetro da furação espassamento da furação e da
espessura do material de proteção ao fogo. Estes ensaios de resistência ao fogo são ainda
comparados ao nível da evolução da temperaura do aço com os resultados provenientes de
vigas sólidas de perfis laminados com e sem proteção ao fogo. Os resultados experimentais
da evolução da temperatura permite a análise da eficiência da tinta intumescente na
proteção ao fogo de vigas alveolares em comparação com as vigas alveolares sem proteção
e com as vigas sólidas.
Palavas-chave: Tinta intumescente; Resistência ao fogo; Proteção ao fogo; Vigas
Abstract
Cellular beams are structural steel beams that are deeper than normal rolled sections
and have holes cut into their webs. As the web post failure may occur before the section
reaches the limiting temperature usually an increase in the fire protection may be required
for members with web openings in comparison to its equivalent solid section.
The questions raised about the temperature of the web post being higher than a
similar solid beam motivated the need of further experimental fire tests. These were mainly
conducted by the coatings manufactures due to their needs to supply their own loading
tables, and its results were kept confidential.
It is recognised that the intumescent fire protection thickness required to provide a
given fire resistance to a cellular beam depends on its web thickness, the hole shape and
dimensions, the width of the web post, the degree of the beam asymmetry and the
structural utilisation factor, as well as the protection efficiency of the intumescent
coating.The assessment method of cellular beams protected with intumescent coatings
needs a multi-temperature analysis (MTA) of the coating assessment on solid beams, for
each fire protection period, performed accordingly to EN 13381-8. The solid beam
assessment provides a DFT baseline against which a suitable enhancement for cellular
beams is added. Each fire test is carried out using five cellular beam sections, which
enables a range of web post widths and section factors to be evaluated, instrumented with
thermocouples around the holes, web post and bottom flange, as standardized in EN
13381-9.
The present study aims to investigate the behaviour of cellular beams under fire
conditions when considering unprotected and intumescent protected cellular steel beam.
Experimental tests are conducted in IPB furnace in both cases with and without protection
where about temperature profiles are produced and analysed. The behaviour of the
furnace tests and conclusions are made. The experimental temperature results show
intumescent coating efficiency when applied to solid beams and also for cellular beams,
resulting from its application an increase fire the resistance time in both cases.
Keywords: Intumescent coatings; Fire resistance; Fire protection; Cellular Beams,
Index
ACKNOWLEDGMENTS: ... I
RESUMO ... III
ABSTRACT ... V
INDEX ... VII
LISTE OF FIGURES ... IX
LIST OF TABLES ... XII
SIMBOLOGY ... XIII
CHAPTER 1. INTRODUCTION ... 1
1.1 CONTEXT AND MOTIVATION ... 1
1.2 STATE OF THE ART ... 1
CHAPTER 2: STANDARD FIRE RESISTANCE DESIGN OF CELULAR BEAMS ... 11
2.1 INTRODUCTION ... 11
2.2 SAFETY VERIFICATION FOR LOAD, TIME OR TEMPERATURE DOMAINS ... 11
2.2.1 Safety verification in time domain ... 14
2.2.2 Safety verification in load domain ... 14
2.2.3 Safety verification in temperature domaine ... 14
2.3 STEEL TEMPERATURE DEVELOPMENT OF UNPROTECTED INTERNAL STEELWORK ... 15
2.4 INTERNAL STEELWORK INSULATED BY FIRE PROTECTION MATERIAL ... 16
2.5 NOMINAL FIRE CURVES-MODELS EUROCODE ... 16
2.5.1 Standard fire curve ISO 834 ... 17
2.5.2 Curve of hydrocarbons ... 18
2.5.3 External fire curve ... 18
2.6 STEEL TEMPERATURE EVOLUTION FROM SIMPLIFIED METHOD ... 18
2.6.1 Influence of section factor ... 27
2.6.2 Influence of shadow effect ... 27
2.7 FIRE RESISTANCE TESTS OF CELLULAR BEAMS ACCORDINGLY TO EN13381-9... 32
2.7.1 Elemental multi-temperature analysis ... 33
2.7.2 Procedure and steps of tests according to European standart EN13381-9 ... 33
2.8 TEMPERATURE VERIFICATION FOR THE WEB AND FLANGE: ... 34
CHAPTER 3: FIRE RESISTANCE TESTS OF SOLID AND CELLULAR BEAMS ... 36
3.1 INTRODUCTION ... 36
3.1 INTUMESCENT COATINGS ... 36
3.2 EXPERIMENTAL SETUP AND ELEMENTS INSTRUMENTATION ... 38
3.4 TEMPERATURE EVOLUTION FOR CELLULAR AND SOLID BEAMS WITH AND WITHOUT
PROTECTION: 44
3.5 AVRAGE TEMPERATURE OF WEB AND FLANGE FOR ALL TESTS ... 49
CHAPTER 4: CONCLUSIONS AND FUTURE WORK ... 54
4.1 MAIN CONCLUSIONS ... 54
4.2 FUTURE LINES OF INVESTIGATION ... 55
REFERENCES ... 56
ANNEX ... 58
A1. PUBLICATIONS ... 58
A2. MATLABPROGRAMFORUNPROTECTEDSOLIDANDCELLULARBEAMS ... 59
Liste of Figures
Figure 1 Comparison between recorded average temperatures on the bottom flange of the cellular beam with average temperatures on the bottom flange of the solid
beam, [1]. ... 2
Figure 2 Comparison of temperatures at centre of web post for protected beams, [1] ... 3
Figure 3 Temperature elevation of fully protected web-posts with different fire protection thickness., [3]. ... 4
Figure 4 Deflections and temperatures distribution on protected and unprotected cellular beams, [5]. ... 6
Figure 5: Lateral torsional buckling failure of a cellular member loaded by a bending, [9]. ... 9
Figure 6: Load, time or temperature domain for a nominal fire, [11]. ... 12
Figure 7: Load, time or temperature domain for a natural fire, [11]. ... 13
Figure 8: Standard fire curve ISO834. ... 17
Figure 9: Temperature evolution for unprotected cellular and solid beam IPE100. ... 20
Figure 10: Temperature evolution for unprotected cellular and solid beam IPE160. ... 21
Figure 11: Temperature evolution for unprotected cellular and solid beam IPE200. ... 21
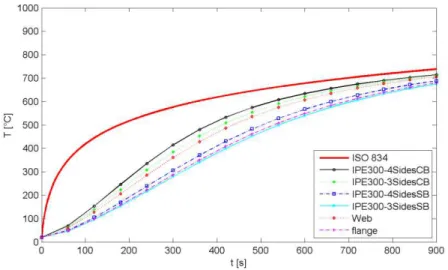
Figure 12: Temperature evolution for unprotected cellular and solid beam IPE300. ... 22
Figure 13: Temperature evolution for unprotected cellular and solid beam HEB100. ... 22
Figure 14: Temperature evolution for unprotected cellular and solid beam HEB160. ... 22
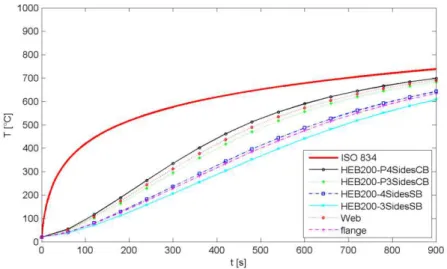
Figure 15: Temperature evolution for unprotected cellular and solid beam HEB200. ... 23
Figure 16: Temperature evolution for unprotected cellular and solid beam HEB300. ... 23
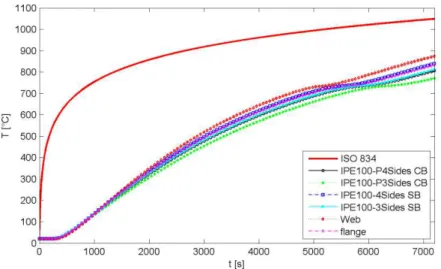
Figure 17: Temperature evolution for protected cellular and solid beam IPE100. ... 25
Figure 18: Temperature evolution for protected cellular and solid beam IPE200. ... 25
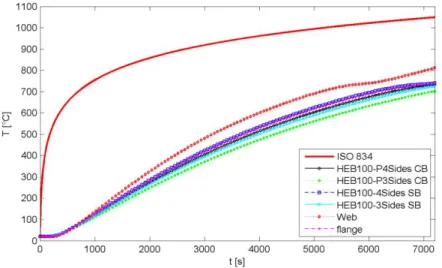
Figure 19: Temperature evolution for protected cellular and solid beam HEB100. ... 26
Figure 20: Temperature evolution for protected cellular and solid beam HEB200. ... 26
Figure 21: Influence of shadow factor for IPE160 with shadow effect different than1. ... 29
Figure 22: Influence of shadow factor for IPE160 with shadow effect equal to 1. ... 29
Figure 24: Temperature evolution for cellular and solid beam for IPE300 with Ksh=1 .... 31
Figure 25: Temperature evolution for cellular and solid beam for IPE100 with Ksh≠1. ... 31
Figure 26: Temperature evolution for cellular and solid beam for IPE300 with Ksh≠1 .... 32
Figure 27: Position of the thermoucouple according to EN13381-9. ... 35
Figure 28:Intumescent coating (a) before fire test and (b) after fire testing, [19]. ... 37
Figure 29: Dimensions of the tested solid and cellular beams. ... 39
Figure 30: Position and numbering of the thermocouples. ... 40
Figure 31: The thermoucouple used in the experimental tests. ... 40
Figure 32: Fire furnace with interior dimensions of 1x1x1 [m3]. ... 41
Figure 33: Test setup, position and numbering of the thermocouples. ... 41
Figure 34: Specimens setup inside the furnace before the test. ... 42
Figure 35: Specimen P17 inside the furnace after the test. ... 42
Figure 36 - Tests P12 and P15 before and after the test. ... 43
Figure 37 Tests P4 and P3 before and after the test. ... 43
Figure 38: Temperature evolution results of unprotected solid beam P2. ... 44
Figure 39: Temperature evolution results of unprotected cellular beam P6. ... 44
Figure 40: Average temperature on the flange of test P2 and P6. ... 45
Figure 41: Average temperature on the web of test P2 and P6. ... 45
Figure 42: Temperature evolution for test P7. ... 46
Figure 43: Temperature evolution for test P8. ... 46
Figure 44: Temperature evolution for test P10. ... 47
Figure 45: Temperature evolution for test P11. ... 47
Figure 46: Temperature evolution for test P14. ... 48
Figure 47: Temperature evolution for test P17. ... 48
Figure 48: Average temperature of the web post for all beams protected and unprotected. ... 49
Figure 49: Average temperature of the flange for all beams protected and unprotected. ... 49
Figure 51: Measured expansion of intumescent char for test P14 ... 52
Figure 52: Measured expansion of intumescent char for test P8 ... 52
Figure 53: Measured expansion of intumescent char for test P10 ... 53
List of Tables
Table 1: Section factor for unprotected cellular and solid beams. ... 20
Table 2: Section factors for protected cellular and solid beams. ... 24
Table 3: Exposure time to reach a reference temperature of 500 [°C] and 600 [°C] for a
shadow effect Ksh≠1 and Ksh =1 ... 28 Table 4: Steel temperature values for a fire exposure time equal to 30 [min] and 60
[min] for a shadow effect Ksh≠1 and Ksh =1. ... 30 Table 5: Geometries and properties of the tested beams. ... 38
Simbology
θa steel temperature increase from time t to time t+ t ksh correction factor for the shadow effect, see below
Am surface area of the member per unit length
V volume of the member per unit length
ca specific heat of steel
ρa unit mass of steel
.
hnet design value of the net heat flux per unit area
t time interval
λp thermal conductivity of the fire protection material
Ap/V section factor for steel members insulated by fire protection material
Ap area of fire protection material per unit length of the member
V volume of the member per unit length
θg,t ambient gas temperature at time t
θa,t steel temperature at time t
dp thickness of the fire protection material
ca temperature dependant specific heat of steel
ρa unit mass of steel
t time interval
θg,t increase of ambient gas temperature during the time interval _t
cp temperature independent specific heat of the fire protection material
ρp unit mass of the fire protection material
h Heigh of section.
b Width of section.
tf Thickness of flange.
r Radius.
A Area of section.
nh Number of holes.
D Diameter of hole.
rh Radius of hole.
Ah Area of a hole.
Chapter 1.
Introduction
1.1 Context and motivation
During the last decades, remarkable progress has been made in understanding not
only the parameters which influence the development of building fires, but also the
behaviour of fire exposed structural materials and structures. In particular, for steel
structures, this progress has resulted in the production of very detailed rules for the design
and calculation of structural behaviour and load bearing capacity in fire.
This research is to perform a comparison of the temperature evolution of cellular
beams with and without a fire protection material based on the results of experimental fire
tests. The analysis should show whether the temperature increase in the web post is at a
faster rate than expected on solid web sections. This analysis is to be used for the definition
of the cellular beams collapse mode, either from the buckling of the web post, the
Vierendeel bending or the flange compression. The use of cellular beams allows a new
architectural expression. Structures are lightened and spans increased, pulling spaces
together.
1.2 State of the art
The cellular beam has generally followed a simple design rule based on calculating
the Section Factor from which the cellular section was manufactured and then increasing
the required thickness by 20% from parent beams. The difference between temperatures in
the bottom flange and web-post of the protected cellular beam with intumescent coating,
the behaviour of char ‘pull-back’ seems to be dependent on the thickness and type of intumescent coating used, [1].
Colin Bailey found that for the unprotected cellular beam there was no increase in
higher compared to the web temperatures of a solid beam. A test of a symmetrical cellular
beam and identical solid beam within the same furnace and comparing between the two
beams for temperature evolution , [1].
The published work of Bailey, [1] investigate the rate of temperature increase in the
web post and -compare it with solid beams, a series of tests were conducted on unloaded,
protected and unprotected cellular and solid beams. The furnace test that in the beams with
no fire protection, the flange and web post temperatures of the cellular beams was slightly
lower than the corresponding temperatures of the solid beams. It was also observed that the
ratio of the web to flange temperature did not increase at a faster rate in the cellular beam
compared to the solid beam, [1].
The tests consisted of an unprotected set of beams followed by 3 protected sets of
beams, comprising one with 0.8 [mm] thick water-based intumescent, also two with 0,8
and 2,1 [mm] thick solvent-based intumescent.
Figure 1 shows the comparaison of average temperatures on the bottom flange of the
cellular beam with average temperatures on the bottom flange of the solid beam. The solid
beam is hotter than the cellular beam, [1].
Figure 1 Comparison between recorded average temperatures on the bottom flange of the
Figure 2 Comparison of temperatures at centre of web post for protected beams, [1]
Figure 2 shows that The beam protected with the 0.8mm water-based intumescent
experienced higher web temperatures compared with 2.1mm solvent based and 0.8 solvent
based, [1].
The test results of unprotected beams show that temperature of the web-post of a
cellular beam was higher than the temperatures of an identical solid beam. However, the
three tests on protected beams show that the temperatures measured within the web-post of
a cellular beam were higher than the temperatures of the web for identical solid beam, [1].
The paper of Bihina and Bouchaïr [2] presented and used full-scale fire tests for
analyse the behaviour of composite steel and concrete cellular beams with evenly spaced
circular web holes and the test is to applied two-point mechanical load. The beams were
not fire protected and they were tested with an ISO834 fire or a bilinear thermal curve
representing the behaviour of a protected beam. Also the use of cellular beams, endowed
with aesthetical and mechanical advantages requires a good understanding of their
behaviour, at both ambient and elevated temperatures and the results that beams with
slender web-posts and an asymmetrical steel cross-section were prone to fail by web-post
buckling. On the other hand, beams with ‘‘reinforced’’ web-posts or large web-posts failed by flexural bending, like solid beams. At failure, the critical temperature could reach up to
500 [ºC] at slab mid-depth, and exceed 700 [ºC] in the steel web, [2].
The Web post buckling is the most relevant stability problem for the cellular beam.
Wang study behaviour for protected cellular steel beams at elevated temperatures in a fire.
Also they investigated and verify its behaviour by a finite element model. The partially
protected steel beam represents a cellular steel beam (CSB) with the hole edge left
unprotected and fully protected CSB. The fire resistance time of cellular beam increased
linearly with the increase of coating thickness. For the partially protected cellular steel
beam, the temperature gradient in the web-post becomes higher with the increase in the fire
protection thickness. With the increase in the fire protection thickness, the increment in the
fire resistance time decreased. Additional thermal stress occurred due to the non-uniform
thermal strain in the web-post. For the fully protected CSBs, the fire-resistance time
increased linearly with increase in thecoating thickness. However, for the partially
protected CSBs,with the increase in the fire protection thickness,the increment in the fire
resistance time decreased., [3].
Figure 3 presents the temperature elevation point 1 and point 2 of the two kinds of
protected CSBs. The temperature difference at point 1 and point 2 of the Cxx-1 was nearly
the same which was about 60 °C.For the Cxx-2, the temperature difference at point1 and
point 2 in web-posts increased with the increase in coating thickness,which were 136 °C,
183 °C, 221 °C and 240 °C, respectively. The difference in the fire resistance time was
determined by the difference in temperature elevation of the CSBs with different fire
coating thickness., [3].
Figure 3 Temperature elevation of fully protected web-posts with different fire
The temperature increment of unprotected and fully protected CSB in the web-post
was non-uniform. For the CSB with load ratio of 0.5, the temperature difference in the
web-post was about 60 °C at buckling. The temperature difference was much higher in the
web-post of a partially protected CSB. In addition, the non-uniformity of temperature
becomes greater with the increase in the fire protection thickness. The temperature
distribution was non-uniform along both the section height and the longitudinal
direction.For the fully protected CSBs, the fire-resistance time increased linearly with
increase in the coating thickness. However, for the partially protected CSBs, with the
increase in the fire protection thickness, the increment in the fire resistance time decreased.,
[3].
Guo-Qiang Li presents a study to investigate the feasibility of using a constant
thermal conductivity for intumescent coating when calculating protected steel temperature
in fire, based on analysing a series of fire tests on intumescent coating protected steel
sections with a range of section factors and intumescent coating thicknesses. Having a
constant thermal conductivity enables simplified analytical equations to be developed for
design purpose, [4]. Their tests allow concluding that the effective constant thermal
conductivity is a very simple concept and makes derivation of simple design equations
possible. The research has demonstrated that it is feasible to use an effective constant
thermal conductivity value to represent the temperature dependent thermal conductivity of
intumescent coating, based on comparison of steel temperatures calculated using the
effective constant thermal conductivity with the fire test results. The effective constant
thermal conductivity tends to increase with decreasing rate of heating of steel (increasing
DFT, decreasing section factor).The effective constant thermal conductivity changes with
coating thickness and steel section factor. Therefore, it is necessary to obtainad at a base of
effective constant thermal conductivity values for realistic applications with different DFTs
and steel section factors. This research has indicated that it is possible to obtain this data
base by conducting fire tests on steel plates, [4].
Nadjai et al conducted an experimental study at elevated temperatures on the behaviour of
full-scale composite floor unprotected and protected cellular steel beams with intumescent
coating having different size and openings shape. All beams were designed for full shear
connections between the steel beam and the concrete flange using headed shear studs in
order to fail in by web-post buckling. In fire, the temperature distribution across a
cross-sections and a large exposed perimeter than the top flange. The deterioration of the
material properties of the web will therefore become an important effect on the overall
performance of the member in the event of fire. Fire resistance and protection of cellular
beams has been very controversial concerning their behaviour in elevated temperatures, the
fire protection material and the required thickness, [5]. The tests were carried out on six
full-scale composite unprotected and protected cellular beams, of 5 m span length. The
cellular beams were fabricated from standard hot rolled steel sections, subjected to one or
two point loads, using three different geometries and for fire protection of the cellular
beams was used the intumescent coating material Nullfire S707-60, [5].
From the experimental tests of composite floor with protected and unprotected
cellular steel beams in fire conditions conducted at the FireSERT, the authors concluded
that the recorded temperatures on the protected steel sections are smaller than the
unprotected. Also, the deformation of the protected composite cellular beams is less crucial
than the unprotected. The failure mechanism in the three protected composite cellular
beams is the same as the unprotected but with a longer duration time.
Figure 4 Deflections and temperatures distribution on protected and unprotected
cellular beams, [5].
The composite cellular beams with protection failed in longer time than the
unprotected and the recorded deflection at failure time was smaller than the unprotected.
of applying fire protection on cellular beams. The results in protected beams showed in
Figure 4 an increase of fire resistance of all protected beam up to 50% compared with
unprotected beams when the temperature is 750 [ºC] for time limit of 60 [min] as provided
by the manufacturer, [5].This research and the test results show that the intumescent
coatings are the most effective fire protection material for steel cellular beams. The
numerical model is capable of simulate the mechanical behaviour of composite cellular
beam sections protected at elevated temperature conditions with a relatively high accuracy.
The Eurocode provided equation used in DIANA can provide quite good agreement with
the experimental results when it is calibrated with the correct material specification of the
intumescent coating used. The simplicity and versatility of the Eurocode with more
additional data can be an attractive for application in fire resistance assessment in design,
[5].
The use of adequate edge concordance radius in beams with rectangular and square
openings is very efficient for better distributing steel beam web stresses since it reduces the
stress concentration at these points. Using an edge concordance radius equal to five times
the web thickness in a six meter span beam (IPE750x137) with a rectangular opening
height equal to 0.5 H increased in 9% its ultimate load, [6].
The beams with rectangular openings presented the smaller ultimate loads, about
30% less than their equivalent beams with square or circular openings. In these specimens
the Vierendeel collapse mechanism was observed in all beams with rectangular openings
and was independent of the beam opening position on the span. Beams with square
openings presented a collapse mode combining the Vierendeel collapse mechanism with a
load application point bending collapse, [7].
Research on the performance of beams with multiple web openings was seriously
followed in 1964 when Kolosowski tested one castellated beam to study its deflection and
failure mode. The overall height of this beam was 150% of its parent section, the span to
depth ratio was 10 and the web post had the angle of 56.3° (this angle is 60° in UK
sections). Kolosowski was expecting a behaviour similar to a Vierendeel truss, however,
the beam eventually failed due to overall lateral torsional buckling as there were no lateral
restraints provided within the supports. In 1973, Husain and Speirs conducted twelve tests
to investigate the effect of the opening geometry on the mode of failure of these beams. In
their tests they observed three different failure types, flexural failure, Vierendeel failure
The web post buckling was only known as a major failure of such beams since 1996
when Zaarour and Redwood tested 12 short span (3000 mm) castellated beams with thin
webs with minimum web post width to opening depth ratio ranging from 0.18 to 0.26.
Most of these beams failed due to web post buckling and the rest failed due to
lateral-torsional buckling. Redwood and Demirdjian also focused more on the web post buckling
and tested four short span castellated beams with the UK cutting details. In his tests, he
observed a double deviation web post bukling of 12 tests but for the longest beam he view
a single deviation in the web post. The test results showed that web post buckling loads
were not sensitive to the moment/shear ratio, [7].
The rate of increase in temperature of a steel cross-section is determined by the ratio
of the heated surface area (A) to the volume (V). This ratio, A/V, has units of [m-1] and is
known as the “Section Factor”. Members with low Section Factors will heat up more
slowly.
In earlier editions of this publication the Section Factor was written as Hp/A. In the
new European testing and design standards (ENV13381-4, ENV1993-1-2 and
ENV1994-1-2) the Section Factor is presented as A/V, which has the same numerical value as Hp/A. It
is likely that the designation Hp/A will gradually fall into disuse, [8].
A steel section with a large surface area (A) will receive more heat than one with a
smaller surface area. Also, the greater the volume (V) of the section, the greater is the heat
sink. It follows therefore, that a small thick section will increase its temperature slower
than a large thin one. The Section Factor (A/V) is thus a measure of the rate at which a
section will heat up in a fire and the higher its value the greater will be the protection
thickness required, [8].
The lateral torsional buckling behaviour of cellular beams was investigated using a
numerical model that was validated based on experimental results. The effect of the
modified residual stress pattern was appropriately taken into account. Using the results of
the parametric study, a preliminary design approach was proposed. This approach is based
on the currently existing European guidelines for the calculation of the lateral torsional
buckling resistance of I-section beams, but with a modified calculation of the
cross-sectional properties and a modified buckling curve selection, [9].
The lateral torsional buckling behaviour of cellular members subjected to a constant
stress pattern caused by the production procedure. A numerical model, validated by
comparing it with experimental results, was used to study the lateral torsional buckling
behaviour of a large variety of cellular beam geometries. Both the elastic critical buckling
moment Mcr and the LTB resistance MRd were determined, and a preliminary design rule
was proposed for both moment values, [9].
Figure 5: Lateral torsional buckling failure of a cellular member loaded by a bending,
[9].
The tests done with Delphine Snoke were failed by lateral torsional buckling, without
any perceivable local buckling effects. For most of the longer geometries, the
load-deflection diagram kept increasing past the critical LTB moment, due to the stabilising
effect of the considerable pre-buckling deformations. Since no value of numerical
resistance moment by programme of abaqus MRd,abq could be determined for these cases,
the corresponding results were not taken into account, [9].
The evenly spaced circular web openings in I-section cellular beams have an
advantageous effect on the material used if these beams are loaded in strong-axis bending.
However, not all aspects of the behaviour of such beams have been studied adequately,
such as the lateral torsional buckling failure, [9]. Furthermore, the detrimental effect of the
modification of the residual stresses by the production process, demonstrated by the
authors, was never taken into account.
An experimental study of unloaded solid and cellular beams with circular holes in
fire conditions with and without intumescent fire protection was done by Mesquita et al,
[10]. These preliminary tests are the basis for generating an elemental multi-temperature
analysis (EMTA) needed to assess cellular beams with intumescent protection as
prescribed by the EN13381- 9. The tests were done on protected and unprotected solid and
cellular beams subjected to a fire exposure on three sides and compared the performance of
an intumescent coating as a fire protection material using beams with and without
Also the experimental tests were carried out with reference to the standards EN
13381-8 for solid beams protected with intumescent paint and EN13381-9 for the analysis
of cellular beams protected with intumescent paint. The results of the tests show the
intumescent coating efficiency when applied to solid beams and also for cellular beams,
resulting from its application an increase in the fire resistance time in both cases. From the
results of these tests the study is being extended to a wider parametric analysis considering
different cellular beams geometries and intumescent coatings thicknesses to allow for a
Chapter 2:
Standard fire resistance design of
celular beams
2.1 Introduction
Cellular beams give architectural flexibility having open large spaces forming
compartments, as it is possible to achieve long spans. This structural element is currently
being widely commercial used, in multi-storey buildings and industrial buildings,
warehouses and portal frames. The investigation of the behaviour of cellular beams at hight
temperature is being done from the theoretical, experimental and numerical perspetives.
There are a lot of different failure modes that has been observed. In fire, the
degradation of strength and stiffness of unprotected steel sections exposed to elevated
temperatures can result to early structural colapse. The fire resistance of cellular beams has
been very controversial in the recent years, considering the fire protection material and the
required thickness in a number of guidelines documents published by the Steel
Construction Institute, [5]. The most common fire protection material used for cellular
beams is the intumescent coating, giving the advantage of allowing the passage of
technical services as it can be applied without blocking the holes in the web. Intumescent
coating is applied on steel structural elements at specific thickness, necessary to protect the
structural element, minimising the wastage and hence cost. They can be applied in the
fabricator’s shop or on the completed structure on the construction site. The use of intumescent coating extends the loadbearing capacity of the steel structure. The stability of
a building, having intumescent coating protected for structures or buildings in case of fire
depends on the thickness of the coating, the depth and insulation properties.
2.2 Safety verification for load, time or temperature domains
The stability analysis can be performed through different approaches mentioned in
temperature domain. These possibilities are illustrated on Figure 6 and Figure 7 for a
simple case in which the applied load, the effect of action Efi,d, is constant during the fire
and the element is characterised by a single temperature, θstructure. The figures refer to the case of a nominal fire in which the fire temperature, θfire, is continuously increasing. The temperatures in the structure, θstructure, will therefore also be a continuously increasing as a function of time and, although this will not be demonstrated theoretically, it will be
assumed that this induces a continuously decreasing load bearing capacity, Rfi,d,t , [11].
Figure 7: Load, time or temperature domain for a natural fire, [11].
For steel structures, the load bearing capacity of the structure that could be calculated
at different moments in time produces a pattern as shown on Figure 7with a first phase
where the load bearing capacity decreases as a function of time, and a second phase when
the structure recovers its load bearing capacity, mainly because steel recovers its strength,
either totally or partially, when cooling down to ambient temperature.
In each case, treq noted on the Figure 7 is the required fire resistance time of the
structure.
The situation at the beginning of the fire is represented by point A on both Figures
and, if the analysis is performed by the advanced calculation model, the method, i.e. the
software, normally will track the evolution of the situation of the structure until point B
when failure occurs (most computer software indeed perform a transient step by step
analysis). This means that the curve showing the evolution of the load bearing capacity is
2.2.1 Safety verification in time domain
It has to be verified that the time of failure tfailure is higher than the required fire
resistance time treq. This is expressed by Equation (1) and corresponds to the verification
1, satisfied on Figure 6 but not satisfied on Figure 7.
tfailure ≥ treq (1)
2.2.2 Safety verification in load domain
At the required time in the fire treq, it is verified that the resistance of the structure
Rfi,d,t is still higher than the effect of action Efi,d. This is expressed by equation (2) and
corresponds to the verification 2 on Figure 6 and Figure 7.
Rfi,d,t ≥ Efi,dat t = treq (2)
This verification is proposed as the standard method in Eurocode 3. It can be shown
that, in the case of a fire with no decreasing phase, the fact that Equation (2) is satisfied
guarantees that Equation (1) is also satisfied, see Figure 6. On the other hand, in the case of
a fire with a cooling down phase, it can happen at some stage that Equation (1) is satisfied
whereas Equation (2) is not satisfied, as show in Figure 7.
2.2.3 Safety verification in temperature domaine
At the required fire resistance time treq, it has to be verified that the temperature of
the structure structure is still lower than the critical temperature cr, the temperature that
leads to failure. This is expressed by equation (3) and corresponds to the verification on
Figure 6 and Figure 7.
ϑ ≤ ϑcrat t = treq (3)
This verification is a particular case of the verification in the load domain, only
possible when the stability of the structure is depending on a single temperature, which is
the case in steel elements under uniform temperature distribution. It can also happen for
The verification in the load domain has indeed several advantages wich is: 1- It is
easy to use; because the verification is at a given time; the steel temperature and hence the
material properties are known and can be used for the evaluation of the load bearing
capacity. 2- It is applicable for any type of effect of actions whereas, as will be explained
in Section verification in the temperature domain is possible only in a limited number of
cases. 3- It produces a safety factor that is similar to the one that engineers and designers
have been using for years at room temperature, namely the ratio between the applied load
and the failure load. On the other hand, verification in the temperature domain yields a
safety factor in degrees centigrade that does not provide much in term of practical
consequences. A verification in the time domain may even be more confusing because,
with the tendency of standard fire curves to level off at nearly constant temperatures after a
certain period of time, they can yield the false impression of a very high level of safety
because the calculated time of failure is significantly longer than the required fire
resistance time, simply because the temperature of the structure changes very slowly,
whereas a small variation in the applied load or in the heating regime would decrease the
fire resistance time very dramatically close to the required resistance time, [11].
2.3 Steel temperature development of unprotected internal steelwork
If the temperature distribution in the cross section is supposed to be uniform, the
temperature increase during a time increment is given by this Equation (4).
t h C V A k net a a m sh t a . , (4)
For I-sections under nominal fire actions, the correction factor for the shadow effect may
be determined from:
ksh = 0.9 [Am/V]b/[Am/V] (5)
Where: [Am/V]b is box value of the section factor
In all other cases, the value of ksh should be taken as: ksh = [Am/V]b/[Am/V].
The previous equation 4 is better understood if transformed into the form of Equation
(6) which shows that it is just the expression of the conservation of energy between the
quantity that penetrates in the section and the quantity used to modify the temperature and
V a ca t
A
h sh m s;t
.
k (6)
In this equation, the ratio between the surface area of the member and the volume of
the member, Am/V, is the parameter characterising the cross section of the member that
governs its heating.
The term of “section factor’’ is not meaningful because it contains no information about the physical characteristic that this factor represents. This parameter is sometimes
referred to as “the massivity factor’’ which indicates at least what this factor is about, but the problem nevertheless remains that this quantity is the highest for the most slender and
less massive sections.
2.4 Internal steelwork insulated by fire protection material
If the temperature distribution in the cross section is supposed to be uniform, the
temperature increase during a time increment is given by Equation (7).
V A d c c with e t c d V A p p a a p a t g t a t g a a p p p t a / ) 1 ( ) 3 1 ( ) ( , 10 / , , , (7)
The above equation is derived from the formulation where the governing partial
differential equation of the heat transfer inside the insulation layer was solved. Some
simplifications of the solution of this 1D equation lead to the exponential correction factor.
Strictly speaking, the approximation of the exact solution is valid for small values of the
factor .this factor should normally not be higher than 1.5 but this limitation has not been
specified in the Eurocode.
2.5 Nominal fire curves- Models Eurocode
Nominal fire curves are the simplest and most used as a means of representation of a
real fires and are the most frequently used. They are represented by conventional models of
curves given by the Eurocode 1 part 1-2 and adopted for classification or verification of the
fire resistance. The best known are the standardized fire curve ISO 834, presented in Erro! A origem da referência não foi encontrada., the external fire curve, the hydrocarbon curve,[12].
2.5.1 Standard fire curve ISO 834
For the modeling of a fire in a building, the ISO 834 curve is a conventional
reference. The temperature evolution over time showed in Figure 8 and given by the
following equation:
= 20 + 345log10(8 + 1) (8)
Where θ represents the gas temperature in the compartment, in [°C], and t represents the time, in minutes.
Conventional fire curve must be applied to the entire enclosure which size needing
and not dependent fire development conditions, or possibility of previous fires its
generalization. Finally it is important to note that his appearance and ascending in heating
only.
Figure 8 showed a nominal fire curve this curve are used to test the fire resistance of
materials this standard is the least’intensive’ of the fire curves.
2.5.2 Curve of hydrocarbons
Developed in the 70s by the oil company Mobil, it has an up speed temperature with
a temperature of 900 [°C] within the first five minutes. This research was initiated to
develop a test procedure for assess the protection materials against fire for offshore drilling
platforms and oil facilities.
The curve of temperature is given by:
θ = 20 + 1080 (1 - 0.325 -0.167 - 0.675 -2.5) (9)
2.5.3 External fire curve
If the structure whose fire resistance is desired to know is considered a field structure
or a compartment lying below or next to outer wall, one may use an external fire curve,
given according to the equation (10).
θ = 20 + 660 (1 - 0.687 -0.32 - 0.313 -3.8). (10)
2.6 Steel temperature evolution from simplified method
To determine the temperature evolution of differente beams a set of two scripts were
developed in Matlab. One to study the behaviour of beams with fire protection material,
gypsum, and the second for solid and cellular beams without fire protection. This
calculations were done taking into consideration the hole diameter calculated from the
beam hight and equal to D=0.714xh, and a distance between center of holes given by
S=1.5D. These routines are presented in the Anexes.
A parametric analysis was done, considering differente sections exposed to 3 sides
and 4 sides, for cellular and solid beam without protection. Table 1 compare the section
factores of both solid and cellular beams exposed to 3 and 4 sides.
length unit per member the of volume length unit per area surface box b m V A
For section factor of unprotected solid beams exposed to fire in 4 sides was calculated:
A r) * * 2 + r) * 4 -tw -(h * 2 + b * (4 V Am
For section factor of unprotected solid beams exposed to fire in 3 sides was calculated:
A r) * * 2 + r) * 4 -tw -(h * 2 + b * (3 V Am
For section factor of unprotected cellular beams exposed to fire in 4 sides was calculated:
tw Ah nh -L A tw Hp nh 2 Ah nh -r) 2 + r) 4 -tw -(h 2 + b (4 V Am
Where: nh= ((L+0.714*h)/(1.5*0.714*h))-1
Section factor for the web
tw tf) 2 -(h tf)) (4 -h) ((2 V Am
Section factor for the flange
tf b tw -tf) 2 + b (2 V Am
The section factor for the cellular beam is smaller than the one from solid beams for
Table 1: Section factor for unprotected cellular and solid beams.
CASE SEC S-SF[m
-1
] h
[mm]
D=
0.714*h S=
1.5*D
C-SF[m-1]
4side 3side 4sides 3sides
1 IPE100 388.13 334.74 100 71.4 107.1 380.82 318.48
2 IPE160 309.72 268.92 160 114.24 171.36 299.74 251.58
3 IPE200 269.54 234.45 200 142.8 214.2 260.96 220.82
4 IPE300 215.62 187.74 300 214.2 321.3 207.73 175.21
5 HEB100 218.23 179.64 100 71.4 107.1 212.87 170.92
6 HEB160 169.10 139.64 160 114.24 171.36 164.53 132.13
7 HEB200 147.38 121.77 200 142.8 214.2 143.65 116.006
8 HEB300 116.13 96.01 300 214.2 321.3 112.06 90.20
The temperature evolution in function of time for diferente unprotected sections,
solid and cellular beams made from IPE100, is shown in Figure 9. A similar result is
presented from Figure 10 to Figure 16, for the other sections of Table 1.
Figure 10: Temperature evolution for unprotected cellular and solid beam IPE160.
Figure 12: Temperature evolution for unprotected cellular and solid beam IPE300.
Figure 13: Temperature evolution for unprotected cellular and solid beam HEB100.
Figure 15: Temperature evolution for unprotected cellular and solid beam HEB200.
Figure 16: Temperature evolution for unprotected cellular and solid beam HEB300.
From the simplified method the section factor Am/V of unprotected solid beams in 3
sides are reduced compared to that heated on 4 sides in all section. Also the same case for
unprotected cellular beams.
To study the behaviour of solid and cellular beams with fire protection, a similar
study was done considering both types of sections protected with Gypsum boards. This
material was chosen due to its well known thermal properties in function of temperature.
dp = 23 mm Thickness of gypsum
rhop = 800 kg/m3 Density of gypsum
Cp = 1700 J/kg°K Specific Heatof gypsum
kp = 0.2 W/m°K Thermal Conductivity of gypsum
mc = 20% Moisture content
The sections studied are presented in Table 2 for fire exposures from 3 and 4 sides.
Table 2: Section factors for protected cellular and solid beams.
CASE SEC
S-SF [m-1] h
[mm]
D=
0.714*h S=
1.5*D
C-SF [m-1]
4sides 3sides 4sides 3sides
1 IPE100 388.13 334.74 100 71.4 107.1 326.20 272.80
2 IPE160 309.72 268.92 160 114.24 171.36 253.88 213.09
3 IPE200 269.54 234.45 200 142.8 214.2 228.11 193.02
4 IPE300 215.62 187.74 300 214.2 321.3 178.09 150.21
5 HEB100 218.23 179.64 100 71.4 107.1 195.16 156.70
6 HEB160 169.10 139.64 160 114.24 171.36 149.62 120.16
7 HEB200 147.38 121.77 200 142.8 214.2 133.05 107.44
8 HEB300 116.13 96.01 300 214.2 321.3 103.12 83.00
The temperature evolution in function of time for diferente protected sections, solid
and cellular beams made from IPE100, is shown in Figure 17. A similar result is presented
Figure 17: Temperature evolution for protected cellular and solid beam IPE100.
Figure 19: Temperature evolution for protected cellular and solid beam HEB100.
Figure 20: Temperature evolution for protected cellular and solid beam HEB200.
The simulation of solid and cellular beams protected with gypsum showed that the
section factor for 3 sides and 4 sides are higher than cellular beams in the both sides for all
section.The section factor for sections insulated by a hollow encasement are based on the
dimensions of the section, h and b, even if the encasement does not touch the section and,
in that case, the surface that radiates energy to the steel section is the inside surface of the
2.6.1 Influence of section factor
The degree of fire protection depends on the A/V section factor for the steel section.
The A/V factor is a function of the area of the steel exposed to the fire and the volume of
the steel section. The higher the A/V, the faster the steel section heats up, and so the
greater the thickness of fire protection material required. The section factor and limiting
temperature are used to determine the thickness of protection required.
The section factor is a way of describing the heating rate of a member, which is a key
factor in determining fire resistance for that section. The shape of the member governs the
time taken for it to reach its failure or limiting temperature and varies according to the
relative dimensions of the section. A heavy, massive section will heat up more slowly than
a light, slender section. This effect is quantified in the section factor.
The section factor is also dependent on whether a boxed out fire protection system or
a coating-based section profile system is adopted and on whether or not the section is
carrying a floor slab. Where a section is partially protected, for example when a column is
built into a perimeter wall, the section factor should be calculated as standard tables do not
represent this arrangement.
The results showed that the section factor is a very important concept when using
protection for the beams. Also the unprotected beams take longer to heat to a set critical
temperature than a relatively slender section of high section factor.
Section factor it is a measure of how quickly the steel section will heat in a fire, and
therefore how much fire protection is required.
2.6.2 Influence of shadow effect
The effect of the shadow factor, or correction factor, is to change the section factor
As/V to that of the box enclosing the steel section. Nominally, the box represents the
effective boundary of the steel section to the radiant heat flux and is introduced to allow for
the assumption that radiant heat transfer to the concave surfaces is blocked by the shadow
of the cross section. However, examination of the background documents [13, 14]
indicates that the principal reason for introducing this so-called shadow effect is due to the
different values of resultant emissivity recommended in the two different versions of
for the overestimation of steel temperature in EN 1993-1-2 caused by using a higher value
of resultant emissivity.
To study the influence of this factor the sections studied in the previous sections
were analysed considering unit shadow factor and the value calculated as prescribed by the
Eurocode 3 part 1.2, [15].
The Table 3 and Figure 20, Figure 22 show the results from the temperature
evolution of an IPE160 section considering diferent values of the shadow effect, Ksh≠1 and Ksh =1, for a fire exposure from 4 sides. For a cellular beam made from an IPE300 reach a
temperature of 500 [ºC] it must be exposed for 611,25 and [s] 507,8 [s], considering
respectively Ksh≠1 and Ksh =1, when exposed in 4 sides. When it is exposed to fire from 3 sides it reaches 500 [ºC] afeter 677.91 [s] and 553.63 [s], respectively.
Table 3: Exposure time to reach a reference temperature of 500 [°C] and 600 [°C] for a shadow effect Ksh≠1 and Ksh =1
Section Temp.
ksh≠1 ksh =1
SB and CB SB CB
web Flange 4 side 3 side 4side 3 side 4side 3 side
IPE 100
500 444.24 492.65 370.34 398.54 373.8 408.69 332.19 377.05 600 595.4 650.55 514.13 544.57 517.82 555.72 474.76 521.3
IPE 160
500 500.06 553.34 414.54 445.91 420.18 458.63 364.95 431.54 600 659.08 720.86 562.19 597.28 568.45 611.6 508.43 581.33
IPE 200
500 537.95 595.14 445.38 479.4 452.99 495.03 385.84 464.61 600 702.94 769.76 596.69 635.36 605.29 653.3 530.75 618.49
IPE 300
500 611.25 677.91 501.42 540.67 507.8 553.63 435.28 528.33 600 788.67 867.31 660.66 706.10 668.00 721.2 585.32 691.77
HEB 100
500 640.87 756.16 498.19 553.74 504.91 569.42 399.38 503.47 600 823.55 960.1 656.93 721.32 664.68 739.63 545.49 663.02
HEB 160
500 746.86 884.53 572.59 637.79 579.99 654.33 463.34 585.65 600 949.06 1113 743.59 819.93 751.99 839.45 617.04 758.63
HEB 200
500 810.72 961.89 618.62 689.60 627.64 709.15 493.35 636 600 1025 1205.4 797.34 881.14 807.96 904.30 651.37 817.82
HEB 300
Figure 21: Influence of shadow factor for IPE160 with shadow effect different than1.
Table 4: Steel temperature values for a fire exposure time equal to 30 [min] and 60 [min] for a shadow effect Ksh≠1 and Ksh =1.
The Table 4 show the results from the temperature evolution of many section
considering diferent values of the shadow effect, Ksh≠1 and Ksh =1, for a fire exposure from 4 sides and 3 sides. For the Figure 23, Figure 24 and Figure 25, Figure 26 presented
the results from the temperature evolution of an secion IPE100 and IPE 300 for cellular
and solid beam with Ksh =1 and ksh≠1 respectivly . For the case of Ksh =1 we have different temperature evolution for 30 min and 60 min for the both sides and when ksh≠1 the results the same for cellular and solid beams and in the both side.
Section Time (min)
ksh≠1 ksh =1
SB ans CB SB CB
Web Flange 4side 3 side 4side 3 side 4side 3 side
IPE 100
30 703.53 691.43 715.78 711.83 715.34 710.21 720.16 714.91 60 833.75 830.85 836.63 835.66 836.52 835.28 837.79 836.41
IPE 160
30 689.25 670.91 709.22 703.17 708.23 700.32 716.46 706.11 60 830.28 824.75 835.06 833.67 834.83 833.01 836.8 834.34
IPE 200
30 676.67 563.59 703.29 695.11 701.61 690.74 713.71 698.89 60 826.64 818.14 833.7 831.77 833.31 830.67 836.11 832.68
IPE 300
30 646.35 614.04 688.84 675.68 686.87 670.8 705.37 680.08 60 814.97 798.05 830.17 826.32 829.64 824.71 834.17 827.69
HEB 100
30 632.38 573.77 689.81 670.76 687.77 664.53 711.7 688.21 60 808.17 772.99 830.42 824.7 829.88 822.47 835.63 830
HEB 160
30 578.62 507.68 663.13 633.86 660.13 625.8 699.2 657.72 60 776.04 740.8 821.95 808.93 820.8 804.69 832.75 819.84
HEB 200
30 545.33 470.28 642.94 608.12 638.71 598.14 691.23 634.72 60 756.31 733.62 813.39 794.53 811.36 788.39 830.79 809.37
HEB 300
Figure 23: Temperature evolution for cellular and solid beam for IPE100 with Ksh=1
Figure 24: Temperature evolution for cellular and solid beam for IPE300 with Ksh=1
Figure 26: Temperature evolution for cellular and solid beam for IPE300 with Ksh≠1 2.7 Fire resistance tests of cellular beams accordingly to EN13381-9
The fire resistance standard EN13381-9 adopts the principle of establishing ratios of
temperatures between and around openings in the web of a beam with the temperatures of
a solid portion of that beam. The aim is that this data can be utilized within a structural
model to derive the value and location of the associated limiting temperature of the beam
at the fire limit state. This can then be used in conjunction with data for the fire protection
material,[16].
Also applies to fire protection materials that have already been tested and assessed in
accordance with EN 13381-4 or EN13381-8. This Standard cannot be used in isolation.
The use of this Standard requires the multi-temperature analysis (MTA) derived from EN
13381-4 or EN 13381-8 as the basis for determining thickness for beams with web
openings, [17].
The assessment procedure is used to establish: a) On the basis of the temperature
data derived from testing unloaded steel/sections, the thermal response of the fire
protection system on cellular beams, (the thermal performance). b) The temperature ratio
between the web post and the web reference temperature, which will vary depending on
the web post width. c). The temperature ratio between points around the web openings and
the web reference area. d) The elemental multi temperature analysis from either EN
13381-4 or EN 13381-8 shall be reassessed and reported against elemental A/V for each fire
resistance period. e) A structural model shall be used to derive limiting temperatures for
2.7.1 Elemental multi-temperature analysis
The fire protection thickness applied to any cellular beam must be sufficient to keep
the beam below its limiting temperature. The thickness required for each fire resistance
period is determined from the EMTA generated by the assessment from EN 13381-4 or EN
13381-8.
The structural model will indicate whether failure is governed by the web or the
bottom flange limiting temperatures so that the most appropriate elemental analysis can be
used to determine the fire protection thickness.
The fire protection thickness applied to any cellular beam must be sufficient to keep
the beam below the temperatures derived from a structural analysis at elevated
temperatures.
The web or bottom flange temperature for a given thickness of fire protection shall
be obtained by carrying out an assessment to EN 13381-4 or EN 13381-8 for the web or
bottom flange temperatures only. The web or bottom flange temperatures are analyzed in
the same way that average beam temperatures are analyzed with the exception that the
stick ability correction factors used are those for already used for the average beam
temperature Where the assessment is based on short column testing only, the assessment
shall be carried out using the mean of both flanges, [17].
Conservatively, the web and bottom flange temperatures may be assumed to be equal
and the section factors of the individual web and flange.
The fire protection thickness shall be that derived from an assessment in accordance
with 13381-4 or EN 13381-8 , [17].
2.7.2 Procedure and steps of tests according to European standart EN13381-9
The test method for determining the contribution to the fire resistance of structural
members made from fire protection materials to the fire resistance to steel beams with web
opening follow the standard EN13381-9. The thermocouple consistency and the data points
During the test furnace temperature must be measured and recorded in the region of
the test specimens using the plate thermometers defined in EN 1363-1 and the furnace
pressure in accordance with EN 1363-1. Also the steel temperature must be measured and
recorded using the thermocouples attached to the steelwork as specified at intervals not
exceeding 1 minute.
Some monitoring must be done regarding the general behaviour of each of the
specimens throughout the test and record the occurrence of cracking, fissuring,
delamination or detachment of the fire protection material and similar phenomena as
described in EN 1363-1,[18].
The test must continue until the required fire performance period is reached. If the
mean bottom flange temperature recorded on all the steel sections has not reached 575 [ºC]
then the test shall be continued until this occurs and this must be within 15% of the
required fire resistance period. If the maximum temperature in the scope of the
multi-temperature analysis generated from EN 13381-4 or EN 13381-8 is less than 575 [ºC] then
this shall be used instead of 575 [ºC] for termination of the test,
2.8 Temperature verification for the web and flange:
The web post is divided into 3 zones: 2 edge zones of width E and a central zone of
width D. The web post average temperature is always given by:[ (temp at A) x E + (temp
at C) x E + (temp at B) x D ] / web post width P.
For different web post widths, the dimension ‘a’ must be determined. The influence of the higher edge temperatures is not considered to be at more than twice the
thermocouple position from the edge of the opening. Therefore ‘a’ is limited to 25 mm. This limit applies for post widths greater or equal to 150 mm (at 150mm, ‘a’ equals 25
mm).
Posts >= 150 mm
Thus for a post width greater or equal to 150 mm the web post average temperature
is given by: [ (temp at A) x 50 + (temp at C) x 50 + (temp at B) x (P – 100) ] / web post width, P.
For post widths less than 150 mm dimension E is given by: E = 25 + a, with D given
by 2a. from this results: P = 2 (25 + a) +2a and a = (P – 50)/4.
This gives the result that for a post of 50mm, ‘a’ is zero and this method of averaging
therefore cannot be used for narrower posts.
The general formula for the average web post temperature for posts between 150 and
50mm is given by: [ (temp at A) x (25 + a) + (temp at C) x (25 + a) + (temp at B) x 2a ] /
P
For a 100mm web post this equqtion is more conservative:
(temp at A) x 37.5 + (temp at C) x 37.5) + (temp at B) x 25 ] / P.
Figure 27: Position of the thermoucouple according to EN13381-9.
P 25
a
E D E
![Figure 2 Comparison of temperatures at centre of web post for protected beams, [1]](https://thumb-eu.123doks.com/thumbv2/123dok_br/16815270.751110/23.892.226.694.117.384/figure-comparison-temperatures-centre-web-post-protected-beams.webp)
![Figure 4 Deflections and temperatures distribution on protected and unprotected cellular beams, [5]](https://thumb-eu.123doks.com/thumbv2/123dok_br/16815270.751110/26.892.148.730.590.974/figure-deflections-temperatures-distribution-protected-unprotected-cellular-beams.webp)
![Figure 7: Load, time or temperature domain for a natural fire, [11].](https://thumb-eu.123doks.com/thumbv2/123dok_br/16815270.751110/33.892.293.699.123.501/figure-load-time-temperature-domain-for-natural-fire.webp)
![Table 1: Section factor for unprotected cellular and solid beams. CASE SEC S-SF[m -1 ] h [mm] D= 0.714*h S= 1.5*D C-SF[m -1 ]](https://thumb-eu.123doks.com/thumbv2/123dok_br/16815270.751110/40.892.137.736.133.484/table-section-factor-unprotected-cellular-solid-beams-case.webp)

![Table 3: Exposure time to reach a reference temperature of 500 [°C] and 600 [°C] for a shadow effect Ksh≠1 and Ksh =1](https://thumb-eu.123doks.com/thumbv2/123dok_br/16815270.751110/48.892.103.777.558.1058/table-exposure-time-reach-reference-temperature-shadow-effect.webp)