Marjorie Zúñiga Farias
Definition of reference buildings to
determine the effect of energy
renovation measures at a
neighbourhood scale. Application to a
study case in Braga
D ef in it io n o f r ef er en ce b u ild in gs to d et er m in e th e ef fe ct of e n er gy r en ov at io n m ea su re s at a n ei gh b ou rh oo d sc al e. A p p li ca ti on t o a st u d y ca se in B ra ga M ar jo rie Z úñ ig a F ar ias in ho | 20 20
Marjorie Zúñiga Farias
Definition of reference buildings to
determine the effect of energy
renovation measures at a
neighbourhood scale. Application to a
study case in Braga
Master’s Dissertation
International Master in Sustainable Built
Environment
Work supervised by
Professor Maria
Manuela de Oliveira Guedes deAlmeida
Co-supervised by
DIREITOS DE AUTOR E CONDIÇÕES DE UTILIZAÇÃO DO
TRABALHO POR TERCEIROS
Este é um trabalho académico que pode ser utilizado por terceiros desde que respeitadas as regras e boas práticas internacionalmente aceites, no que concerne aos direitos de autor e direitos conexos.
Assim, o presente trabalho pode ser utilizado nos termos previstos na licença abaixo indicada.
Caso o utilizador necessite de permissão para poder fazer um uso do trabalho em condições não previstas no licenciamento indicado, deverá contactar o autor, através do RepositóriUM da Universidade do Minho.
Licença concedida aos utilizadores deste trabalho
Atribuição CC BY
STATEMENT OF INTEGRITY
I hereby declare having conducted this academic work with integrity. I confirm that I have not used plagiarism or any form of undue use of information or falsification of results along the process leading to its elaboration.
I further declare that I have fully acknowledged the Code of Ethical Conduct of the University of Minho.
RESUMO
O setor dos edifícios é um dos principais responsáveis pelo consumo de energia e emissão de gases com efeito estufa nas cidades e, ao mesmo tempo, possui uma das maiores poupanças rentáveis de energia e maior potencial na redução das emissões. Nesse sentido, os projetos de renovação à escala do bairro, em vez de à escala do edifício, apresentam vários benefícios que permitem obter soluções mais rentáveis e eficientes. Neste contexto, o trabalho de dissertação procurou desenvolver uma metodologia para definir edifícios de referência que permitam avaliar soluções de reabilitação energética à escala do grupo de edifícios para um bairro de habitação social em Portugal. A precisão do método foi avaliada comparando o desempenho energético do bairro, usando em um caso apenas os edifícios de referência, enquanto no outro os edifícios existentes.
Para a definição dos edifícios de referência, foi utilizada uma análise de cluster - que é uma técnica de análise estatística multivariada que agrupa casos com características muito semelhantes num cluster. Para a análise do desempenho energético, foram utilizadas simulações numéricas de energia. Foi realizada uma análise paramétrica considerando treze medidas de reabilitação energética na envolvente do edifício. A metodologia foi aplicada a um caso de estudo num bairro localizado em Braga, designado como "Bairro das Andorinhas".
Os resultados mostram pequenas diferenças de variação na análise comparativa à escala do bairro para as necessidades de aquecimento e arrefecimento, atingindo variações máximas de 4,9% e 3,4%, respetivamente. A análise de cada cluster demonstrou que as necessidades de aquecimento apresentaram, em geral, diferenças maiores que as necessidades de arrefecimento, em termos de variação entre os cálculos com os edifícios existentes e os edifícios de referência. Além disso, a variação máxima para o cluster orientado em direção este-oeste foi encontrada nas medidas de reabilitação da parede, enquanto nos clusters orientados em direção Norte-Sul foram encontradas no telhado e nas janelas.
Finalmente, o uso de edifícios de referência parece ser uma abordagem viável para avaliar medidas de reabilitação energética à escala do bairro, devido ao nível de precisão da metodologia. Além disso, a aplicação da análise de cluster na obtenção de edifícios de referência parece ser uma técnica adequada para definir esses tipos de edifícios.
ABSTRACT
The building sector is one of the major contributors to energy demand and greenhouse gases emissions within cities and, at the same time, it has one of the largest cost-effective energy saving and emissions reduction potential. In this regard, renovation projects at a neighbourhood scale instead of building level are believed to present several benefits that allow getting more profitable and efficient solutions.
In this context, the dissertation work sought to develop a methodology to define reference buildings that allows evaluating energy saving measures at a neighbourhood scale for a social housing context in Portugal. The accuracy of the method was assessed by comparing the energy performance of the neighbourhood, using in one case just the reference buildings while in the other the existing buildings.
For the definition of the reference buildings, a cluster analysis - which is a multivariate statistical analysis technique that groups cases with very similar characteristics into a cluster – was used. For the energy performance analysis, numerical energy simulations were used. A parametric analysis considering thirteen different energy renovation measures on the building envelope was carried out. The methodology was applied to a case study on a neighbourhood located in Braga, generally designated as “Bairro das Andorinhas”.
The results showed small variation differences in the comparison analysis at a neighbourhood level for both heating and cooling energy demand, reaching maximum variations of 4.9% and 3.4% respectively. The examination of each cluster demonstrated that the heating demand had, in general, a much larger gap than the cooling demand in terms of variation between detailed calculations of the existing buildings and the reference buildings. In addition, the maximum variation for the cluster oriented East-West was found on the wall intervention measures while in the clusters oriented North-South was on the roof and windows.
Finally, the use of reference buildings seems to be a viable approach to evaluate energy saving measures at a neighbourhood scale due to the level of accuracy level of the method. Moreover, the application of cluster analysis on getting reference buildings appears to be a suitable technique to define these types of buildings.
Keywords: Cluster Analysis, Dynamic Simulation, Neighbourhood Energy Performance, Neighbourhood Scale, Reference Building.
TABLE OF CONTENTS
Chapter 1. INTRODUCTION ... 1
INTRODUCTION ... 1
OBJECTIVES... 5
DISSERTATION STRUCTURE ... 5
Chapter 2. STATE OF THE ART ... 7
ADDRESSING ENERGY EFFICIENCY IN BUILDINGS ... 7
2.1.1 Methodology for a Cost-Optimal combination of energy efficiency and renewable energy measures ... 8
2.1.2 The need for Reference Buildings ... 9
THE IMPORTANCE OF DISTRICT AND NEIGHBOURHOOD LEVEL... 9
2.2.1 Advantages and challenges of addressing renovations at neighbourhood scale ... 11
FACTORS INFLUENCING NEIGHBOURHOOD ENERGY PERFORMANCE... 12
2.3.1 Energy Consumption ... 14
2.3.2 Energy Production ... 20
2.3.3 Consumption Patterns ... 25
METHODS AND TOOLS USED AT DISTRICT AND NEIGHBOURHOOD SCALE ... 27
2.4.1 Representativeness of Buildings ... 28
2.4.2 Energy Performance assessment ... 33
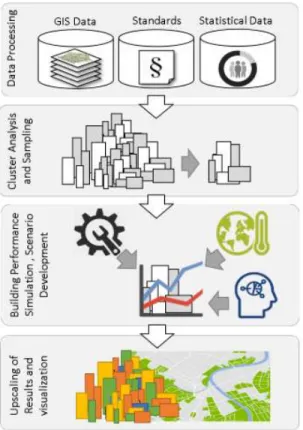
Chapter 3. METHODOLOGY ... 39
STEP 1: STATISTICAL ANALYSIS ... 39
3.1.1 PHASE 1.1: DATA COLLECTION AND PREPARATION ... 40
3.1.2 PHASE 1.2: CLUSTERING ... 41
3.1.3 PHASE 1.3: IDENTIFICATION OF THE REFERENCE BUILDING ... 42
STEP 2: ENERGY PERFORMANCE ASSESSMENT ... 42
3.2.1 EnergyPlus ... 43
Chapter 4. CASE STUDY CHARACTERISATION ... 48
ANDORINHAS NEIGHBOURHOOD ... 48
Chapter 5. RESULTS AND DISCUSSION ... 54
STEP 1: STATISTICAL ANALYSIS ... 54
STEP 2: ENERGY PERFORMANCE ASSESSMENT ... 58
Chapter 6. CONCLUSION ... 66
LIST OF FIGURES
Figure 1: Cost-optimal level scheme. ... 8
Figure 2: nZED energy performance factors. ... 13
Figure 3: Main energy determinants in each scale... 13
Figure 4: Portugal Climatic Zone. ... 17
Figure 5: Effects of Occupants´ activities types on building energy performance ... 26
Figure 6: Factors influencing energy behaviour of occupants performance ... 26
Figure 7: Methodology to define Archetypes for Urban Building Energy Modelling. ... 30
Figure 8: Methodology to define Archetypes for Urban Energy Modelling ... 31
Figure 9: Dendrogram construction process ... 32
Figure 10: Software tools and packages capabilities matrix ... 37
Figure 11: Methodology Scheme. ... 39
Figure 12: Satellite photo of Andorinhas Neighbourhood ... 48
Figure 13: Andorinhas Neighbourhood Layout. ... 49
Figure 14: Dwelling typologies T2, T3 & T4 - Architecture plants. ... 50
Figure 15: Dendrogram using Average linkage (between groups). ... 55
Figure 16: Grouping buildings into Clusters and Reference Buildings Identification in the neighbourhood. ... 56
Figure 17: Isometric view – Reference Building 1 - Combination T3-T4. ... 57
Figure 18: Isometric view – Reference Buildings 2 and 3 - Combination T2-T3. ... 57
Figure 19: Heating Energy Demand Comparison for Cluster 1. ... 61
Figure 20: Cooling Energy Demand Comparison for Cluster 1. ... 61
Figure 21: Heating Energy Demand Comparison for Cluster 2. ... 62
Figure 22: Cooling Energy Demand Comparison for Cluster 2. ... 62
Figure 23: Heating Energy Demand Comparison for Cluster 3. ... 63
Figure 24: Cooling Energy Demand Comparison for Cluster 3. ... 64
Figure 25: Heating Energy Demand Comparison at a neighbourhood scale. ... 65
LIST OF TABLES
Table 1: Energy performance indicators and corresponding requirements ... 14
Table 2: Reference and maximum U-Value by climate zone in Portugal. ... 16
Table 3: Maximum window solar gain factor by climate zone in Portugal. ... 16
Table 4: Minimum requirements for technical system ... 18
Table 5: Production and energy sources for district energy. ... 24
Table 6: Influential Building Variables on thermal performance. ... 40
Table 7: Inputs and considerations for dynamic simulation in EnergyPlus. ... 47
Table 8: Total Area dwellings. ... 49
Table 9: Floor number-Orientation Cross tabulation. ... 51
Table 10: Dwelling typology – Orientation Cross tabulation ... 51
Table 11: Characterization of building elements. ... 52
Table 12: Renovation measures details. ... 53
Table 13: Average values of physical parameters for buildings oriented S-N and E-W. .. 54
Table 14: Thermal performance comparative analysis – REH vs Dynamic simulation. ... 58
Table 15: Heating and cooling energy demand variation using reference and existing buildings for initial state and renovation measures. ... 60
GLOSSARY OF ACRONYMS
ADENE – Portuguese Energy Agency CHP – Combined Heat and Power COP – Coefficient of Performance DHW – Domestic Hot WaterGIS – Geographic Information System EER – Energy Efficiency Ratio
EPBD – Energy Performance of Buildings Directive EPS – Expanded Polystyrene Insulation
HVAC – Heating, Ventilation and Air Conditioning
IEA-EBC – International Energy Agency - Energy in Buildings and Communities Programme
nZEB – nearly Zero Energy Building nZED – nearly Zero Energy District nZEC – nearly Zero Energy City PV – Photovoltaic
REH – Portuguese Regulation of Energy Performance of Residential Buildings RES – Renewable Energy Sources
UHI – Urban Heat Island WWR – Wall Window Ratio ZEC – Zero Energy Community
CHAPTER 1. INTRODUCTION
The aim of this chapter is to contextualise and present a background of the dissertation topic, identifying the main problems that have carried out the necessity to develop this study. Furthermore, the objectives to achieve at the end of this work, as well as the dissertation structure are set out in in this chapter.
INTRODUCTION
Studies indicate that the urban and built environment in contemporary cities contribute substantially to climate change (Koutra, Becue, Gallas, & Ioakimidis, 2018).
Currently, cities are home to more than half of the world population and by 2050 the projections indicate the world population will be 30% larger, and that 68% of it will be urban (Villa-Arrieta & Sumper, 2019). As a result, urban areas have become the largest consumers of energy and associated greenhouse gas emissions. One of the major contributors to energy demand and CO2 emissions within cities is the building sector
which accounts for approximately 40% of the energy consumption and 36% of CO2
emissions (Villa-Arrieta & Sumper, 2019; García-Fuentes, Vasallo, García-Pajares, Pujols, & Meiss, 2014; Marique & Reiter, 2014; Aghamolaei, Shamsi, Tahsildoost, & O’Donnell, 2018).
To avoid a further increase of these values, the European Union decided to issue several Directives in order to encourage the reduction of energy consumption and to promote the use of renewable energy sources (Becchio, Bottero, Corgnati, & Dell’Anna, 2017). Specifically, the recast of the European Energy Performance of Buildings (Directive 2010/31/EU) promotes the improvement of buildings energy performance within the European Union, and introduces a new standard, the nearly Zero Energy Building (nZEB). This type of building has a very high energy performance and the nearly zero or very low amount of energy required should be covered to a very significant extent by renewable sources produced on-site or nearby (EPBD, 2010).
The role of cities is widely recognised as key in reducing emissions and energy consumption. The building sector has a great potential to achieve significant reductions in emissions (Allegrini et al., 2015), and also has one of the largest cost-effective energy saving potentials (Becchio et al., 2017). In this path, buildings nZEB have been widely
building scale does not take into account parameters that affect their performance at an urban scale nor develop or take advantages of specific opportunities of district-level or neighbourhood-level solutions.
There is, therefore, an increasing interest in assessing the contribution of larger territorial areas, as districts or neighbourhoods, in their roles in achieving the principles of sustainability (Koutra et al., 2018). Nonetheless, the transformation of existing buildings into low-emission and low-energy buildings is particularly challenging in cities, where many buildings continue to rely too much on heat supply by fossil fuels (IEA-EBC, 2019). Hence, there is a necessity of developing new methodologies to address projects for accelerating the urban renovation towards nearly Zero Energy Districts nZED (García-Fuentes et al., 2014).
In this context, the International Energy Agency through the Energy in Buildings and Communities Programme (IEA-EBC) carried out a project – Annex 75 - that aims to investigate cost-effective strategies for reducing greenhouse gas emissions and energy use in buildings in cities at district level, combining both energy efficiency measures and renewable energy measures (IEA-EBC, 2019). The work proposed in this document is framed in the development of the Annex 75 research project and it aims to develop a method that allows using reference buildings to determine the energy performance of buildings at a neighbourhood level and consequently evaluate the impact of different renovation measures.
Problem Identification
Urban environments have grown at a remarkable rate and the world has experienced a major population shift from rural to urban areas (Aghamolaei et al., 2018). Currently, almost three-quarters of the EU population live in urban areas and the share of the urban population in Europe is projected to rise to just over 80% by 2050. Furthermore, the United Nations estimates that by 2030, city-dwellers worldwide will increase at a rate of 2 million per week. This unprecedented growth will have consequences for the environment and the quality of life of billions of persons (Allegrini et al., 2015).
This high rate of urbanization has increased the floor space for both residential and commercial purposes, which has imposed enormous pressure on the existing sources of energy. Cities account for approximately 75% and 80% of world's energy consumption and greenhouse gas emissions respectively, even though they occupy only 2% of the total
world’s surface (Aghamolaei et al., 2018), and are considered as crucial for effectively abating energy consumptions (Ferrari, Zagarella, Caputo, & D’Amico, 2019).
In particular, the building sector accounts for approximately 40% of the energy consumption and 36% of CO2 emissions (García-Fuentes et al., 2014). The top four end
uses are space heating, space cooling, water heating, and lighting accounting for close to 70% of site energy consumption (Harish & Kumar, 2016).
To reduce this trend, the European Union (EU) has defined energy policy targets establishing ambitious commitments to reduce greenhouse gas emissions further by at least 40 % by 2030 and 80-95% by 2050 when compared to 1990 levels, to increase the share of renewable energy consumed, to ensure a highly energy efficient and decarbonised national building stock and to facilitate the cost-effective transformation of existing buildings into nearly Zero Energy Buildings (EPBD, 2018).
In order to achieve the long-term carbon emissions targets, acting only on new buildings is not enough. In general, the European existing building stock is replaced very slowly and presents very low energy performance levels (Almeida & Ferreira, 2017). A very small part of the existing building stock is renovated every year due to technical and societal barriers, in addition to the economic barriers including fuel poverty (Eleftheriou et al., 2017). In particular, for the period 2012-2016 the annual weighted energy renovation rate was estimated close to 1% within the European Union while other estimations of the European Commission shows a rate between 0.4-1.2% depending on the Member States (Esser, Dunne, Meeusen, Quaschning, & Denis, 2019). Therefore, the challenge of achieving energy efficiency targets in Europe remains for existing buildings, which is an urgent problem to tackle.
Regarding the energy efficiency in the built environment, although there are broad concerns a limited number of nZEB are actually being properly constructed and/or retrofitted. In particular, there are distinctive challenges that have to be addressed in southern European countries. In Eleftheriou et al. (2017) is stated that there are significant differences in the progress and implementation of nZEB across the 28 European Member State. In the northern Europe, in general, they managed to develop effective technologies of nZEB corresponding to their heating dominated climates. However, southern European countries are still trying to find the most adequate solutions
prepared for nZEB implementation and especially to the challenge/opportunity of retrofitting existing buildings. In addition, there are strong barriers for nZEB in the residential sector that play a significant role in the housing sector (Eleftheriou et al., 2017). Some of those barriers are the underdeveloped market of nZEB, the lack of understanding of nZEB design due to the insufficient funding of human infrastructure and the scarcity of local governance and a national strategy to create an infrastructure for nZEB implementation. Addressing the nZEB concept at a larger scale - district or neighbourhood - can help unlock those obstacles by attracting more investments due to the size of the interventions which, in turn, may have a positive impact over all stakeholders involved.
In Portugal, buildings represent the third major energy consumption sector with a share of 29% in 2016. The building segment is in the third place of final consumption sector surpassed by transport and industry sector (ADENE, 2018). Furthermore, over the last 10 years (2006-2016), there was a 70% decrease in terms of renovation interventions in residential buildings, while completed dwellings in new housing constructions fell by 89% (ADENE, 2018). Thus, there is still a wide margin to improve energy efficiency in buildings. This is particularly important since studies using simulations on typical building envelope solutions and construction materials in Portugal showed long periods of thermal discomfort for the heating season as well as long periods of overheating during summer (Eleftheriou et al., 2017).
Investments in renovation interventions, and in particular in the residential segment, are also an effective means to alleviate energy poverty, which is a key issue in Portugal (European Commission, 2019). According to the European Union Statistics on Income and Living Conditions energy poverty indicator “inability to keep the home adequately warm”, 20.4% of the population in Portugal was energy poor (European Commission, 2019). According to Simoes, et al. (2016), on average, 22% of the inhabitants in Portugal are potentially fuel poor regarding their dwellings' space heating and 29% regarding space cooling with a large variation across the country. Portugal is consistently identified as the country with the highest number of excess winter mortality in Europe (Eleftheriou et al., 2017).
On the other hand, as a consequence of the first two energy crises in 1973 and 1978, Europe intensified the effort to become gradually independent of fossil fuels (Koutra et al., 2018). However, Portugal is a country with scarce fossil energy resources and largely
dependent on foreign countries for energy production, reaching a value of 79.9%, in 20171. Therefore, this high dependency along to the substantial economic and
environmental weight could be reduced significantly by the transition of the Portugal construction sector to energy efficient and nearly Zero Energy Buildings.
The context delineated in this section reinforces the need to encourage the building energy renovation, particularly in the residential sector, by developing strategies and methods that address the energy-related issues from a neighbourhood scale, allowing for integration of both energy efficiency and renewable energy on-site measures and taking into account potential economic and technical advantages.
OBJECTIVES
General objectives
The main objective of this research is to elaborate a methodology for the definition of reference buildings that accurately characterise neighbourhoods, as a mechanism to evaluate the effect of energy saving renovation measures to achieve the nZEB level. Specific objectives
In order to reach the main goal of this work the specific objectives are the following:
To find reference buildings at a neighbourhood scale, using a social housing project located in Braga as a case study, by applying a cluster analysis technique.
To assess the accuracy of using of reference buildings for the evaluation of the energy performance of neighbourhoods by comparing numerical calculation results of both reference buildings and all buildings in the neighbourhood.
To evaluate variation levels of different energy saving measures on three buildings elements applying the above procedure.
DISSERTATION STRUCTURE
This document is structured in six sections. In the first chapter the identification of the problem along with the objectives and the dissertation structure is set out. In Chapter 2, the conceptual framework and the state of the art found in the literature regarding the topic studied are elaborated. The literature review performed includes not only general
aspects regarding energy performance but also the importance of addressing this at a neighbourhood level as well as the application of methods and tools at this scale. In the Chapters 3 and 4, the methodology used and the characterisation of the case study are explained. The methodology combines different techniques for each step: a statistical technique to define reference buildings and numeric energy simulations to obtain the buildings energy demand. In Section 5 the results are presented. Conclusions of this study are elaborated in chapter 6.
CHAPTER 2. STATE OF THE ART
In this chapter, a literature review concerning subjects related to the topic of the work is reported. The subjects include related concepts, approaches and tools associated to the energy performance at both building and district/neighbourhood level.
ADDRESSING ENERGY EFFICIENCY IN BUILDINGS
New policies and measures have been introduced to promote energy savings and CO2
emission reductions over the last decade. In this context, the European effort is observed in the European Energy Performance of Buildings Directive recast (EPBD, 2010) which introduced the concept of nearly Zero Energy Building (nZEB). The nZEB is defined as “a building that has a very high energy performance (… ) the nearly zero or very low amount of energy required should be covered to a very significant extent by energy from renewable sources, including energy from renewable sources produced on-site or nearby”. The nearly zero energy concept is related to the reduction of the energy demand to almost zero, coupled to the energy supply from renewable sources (EPBD, 2010). The necessary measures to ensure the minimum energy performance requirements are set with a view to achieving cost-optimal levels, which should be calculated in accordance with the comparative methodology in European Commission (2012).
According to (Amaral et al., 2018) the elements that comprise the design of a nZEB are related to the integration of passive design and active systems:
a) Passive measures, such as building orientation or an efficient envelope including glazing areas;
b) Efficient lighting systems used complementary to daylight; c) Efficient heating and cooling equipment;
d) Efficient ventilation; e) Renewable technologies;
f) Building energy management systems, within a context of efficient technologies and rational use of energy.
The Portuguese regulation related to the Buildings Energy Performance has been adapted under the EPBD (2010) recast and modified over time to update its content including the definition of nZEB. According to the last version of this concept, an nZEB is defined as: a
amount of energy required should be covered to a very significant extent from renewable energy produced on-site (whenever possible) and/or adjacent to the building. The nZEBs have components compatible with the upper levels (most efficient) of the cost-optimal evaluations (Lei n°52/2018).
2.1.1 Methodology for a Cost-Optimal combination of energy efficiency and renewable energy measures
The cost-optimal methodology was introduced in the European Directive 2010/31/EU and it allows to assess combinations of energy efficiency measures and renewable energy sources. In the context of energy renovation, it is possible to compare different renovation scenarios under various macroeconomic situations with regard to cost-effective strategies and energy and environmental savings in relation to ´reference buildings´. The method involves 5 main steps: the calculation of the energy performance of the building in the reference case, which is established according to local regulations; the definition of a set of energy efficiency renovation measures in relation to the building needs; the simulation of the energy performance of each renovation and the estimation of the global costs for each renovation scenario, which include investment costs, maintenance, energy costs, replacement and residual value.
A graphic representation of the application of the methodology is shown in Figure 1 in which the cost-optimal level can be found in the lower part of the curve that reports global costs (€/m2) and primary energy consumption (kWh/m2.y). The limit of
cost-effectiveness is derived from a technical and economic perspective in relation to the reference case.
2.1.2 The need for Reference Buildings
According to the commission delegated regulation No 244/2012 member states are required to define “reference buildings” for calculating cost-optimal levels that represent typical and average building stock in each member state in order to obtain general results consistent with the characteristics of the analysed building stock.
Currently, there is no standard for defining a reference building. In the annexe III of (EPBD, 2010) a Reference Building (RB) is defined as ‘‘buildings that are characterized by and representative of their functionality and geographic location, including indoor and outdoor climate conditions’’. In addition, it is a useful tool for understanding the thermal energy performance of an entire built stock and evaluating energy saving measures of an entire building stock. Thus, reference buildings have become a crucial topic for studies involving thermal and energy performance of buildings stock and quantifying the potential of effective refurbishment measures at a national or regional level (Schaefer & Ghisi, 2016). Moreover, for reducing the computational effort of physic models, the clustering of a building stock in a series of reference buildings is a well-established approach that allows maintaining an acceptable approximation of the energy evaluations (Ferrari et al., 2019).
THE IMPORTANCE OF DISTRICT AND NEIGHBOURHOOD LEVEL
There is no agreement regarding an exact definition for concepts such as district or neighbourhood. The form as both concepts are used in literature appears to be related with culture and urban morphology aspects. In Choguill (2008) are some definitions such as ‘a geographically localised community located within a larger city or suburb’ or ‘a separately identifiable area within a community retaining some quality or character which distinguishes it from other areas’ or ‘an area where the residents are drawn and held together by common and beneficial interests’. Hallman defines a neighbourhood as combinations of geographical boundaries, ethnic or cultural characteristics of the inhabitants, psychological unity among people who feel that they belong together, or concentrated use of an area’s facilities for shopping, leisure and learning (in Aghamolaei et al., 2018).
(Amaral et al., 2018). Some definitions found in the literature related to this concept are described in the following paragraph.
The National Renewable Energy Laboratory of the U.S. Department of Energy (NREL) defined zero net energy community (ZEC) as “one that has greatly reduced energy demand through efficiency gain such that the balance of energy for vehicles, thermal, and electrical energy within the community is met by renewable energy” (Marique & Reiter, 2014). They highlight that “community scenarios could link transportation, home and the electric grid as well as enable large quantities of renewable power onto the grid” (Marique & Reiter, 2014). In Villa-Arrieta & Sumper (2019) is defined nearly Zero Energy Cities (nZEC) as “cities made up of nearly Zero Energy Buildings (nZEB) and other installations of distributed generation to cover their energy demand by use of local renewable resources to the detriment of external resources”. In Koutra et al. (2018) is defined ZEC (Zero Energy Community) as ‘the community with reduced energy requirements (covered by renewable resources) by increasing energy efficiency’ and as the ‘community with greatly reduced energy requirements’ and includes energy not only for residential buildings but also for other infrastructure.
Although building assessment is considered as an essential stage in assessing the energy performance of built environment, focusing solely on such assessments may lead to unreliable results since the influence of urban surroundings on buildings´ energy performance, as well as the interdependency amongst them are not taking into account (Aghamolaei et al., 2018; Amaral et al., 2018). It is no longer sufficient to simulate building energy use assuming isolation from the microclimate and energy system in which they operate, or to model an urban energy system without consideration of the buildings that it serves (Allegrini et al., 2015).
The review of past literature demonstrates that although a limited number of studies exist at neighbourhood or district scale, the growing interest in this domain has been significant (Aghamolaei et al., 2018). Actually, district scale approaches are already emphasized in policy actions stated in the last Energy Performance of Buildings Directive (EPBD, 2018): “The Commission shall examine in what manner Member States could apply integrated district or neighbourhood approaches in building and energy efficiency policy, while ensuring that each building meets the minimum energy performance requirements, for example by means of overall renovation schemes applying to a number of buildings in a spatial context instead of a single building”.
According to Amaral et al.(2018), moving from building to city scale increases the complexity by involving more stakeholders and interdependencies, which act as barriers to the implementation and dissemination of nearly zero energy principles. So an intermediate scale, such as district, appears to respond to this complexity. In accordance to Fonseca and Shlueter (2015), it is an adequate scale to go beyond the limits of the single building without losing its control and capable to address tangible solutions (in Amaral et al., 2018). Therefore, neighbourhood/district level is an appropriate scale since it incorporates all the needed components such as transportation system, form and geometry metrics of buildings and district patterns, and provide means for the verification of results (Aghamolaei et al., 2018).
For Koutra et al. (2018), zero energy projects are more worthwhile and efficient on a district scale to provide energy techniques for renewable systems that are not available in individual buildings. Moreover, the existing mismatch between demand and generation can be better managed. In fact, the operation of different local energy resources allow more flexibility to adjust demand and supply through the help of energy storage, for example. Also, the energy production and distribution can be conceived together, reducing losses and contributing to cost-effective interventions (Amaral et al., 2018). 2.2.1 Advantages and challenges of addressing renovations at neighbourhood
scale
Working at district level has various benefits that include economic, social and environmental aspects of sustainability concept (Haapio, 2012; Hachem, 2016; Koch et al., 2012; cited in Aghamolaei et al., 2018). Some of them are detailed in the next paragraphs. From a social viewpoint, the district scale enhances community participation in neighbourhood planning (Komeily, Srinivasan, & Rinker, 2015; Lippard, 1997; Rey et al., 2013; Sharifi & Murayama, 2013; cited in Aghamolaei et al., 2018). Likewise, an intermediate scale provides opportunity for energy planning, since it facilitates the integration of engineering and social science domains (Aghamolaei et al., 2018). For instance, the energy performance analysis and planning can be modified through social principles such as human behaviour, policy decision making and financial incentives which are often not available in planning for individual buildings (Aghamolaei et al., 2018).
From a technical point of view, it is possible to improve efficiencies through the implementation of centralized heating or cooling systems, the exploitation of different slopes and tiles for solar technologies or the utilization of common and public spaces for the installation of Renewable Energy Sources (RES) technologies to cover the demand (Miguel, Mendes, & Madeira, 2018). Regarding Energy Flexibility (which is the ability of a building to manage its energy demand and generation according to local climate conditions, user needs, and energy network requirements), the strategies for a successful implementation depends on the amount of energy that can be shifted (Jensen et al., 2017). This quantity from a single building is often very small, thus, a larger scale is needed to aggregate many buildings that pool the energy flexibility.
In the economic sphere, the refurbishment at a larger scale such as a district scale or neighbourhood scale, can contain several benefits compared to mere building renovations, such as reduced costs due to smaller unit costs (Paiho, Ketomäki, Kannari, Häkkinen, & Shemeikka, 2019). In addition, interventions at this scale contribute to an improvement of new shared-risk models through the combination of financial entities, construction companies or other possible public or private investors being in charge of the initial investment needed, and establishing medium or long-term contracts with the owners (García-Fuentes et al., 2014). In particular, it provides municipalities better opportunities to implement energy and sustainability strategies (Paiho et al., 2019). On the other hand, working at district scale may be more complex to work with, since it involves some difficulties due to the existence of various sub-systems and their interdependencies that affects the overall energy performance. Financial context, technological aspects, society, policy, legal frameworks and on-site conditions, such as existing buildings, infrastructure and landscape, can create constraints as well as opportunities for planning. The most important constraints include financial limitations, implementation of theories and plans, different user patterns, and finally, multiple goals and priorities, which may result in conflicting interests (Aghamolaei et al., 2018).
FACTORS
INFLUENCING
NEIGHBOURHOOD
ENERGY
PERFORMANCE
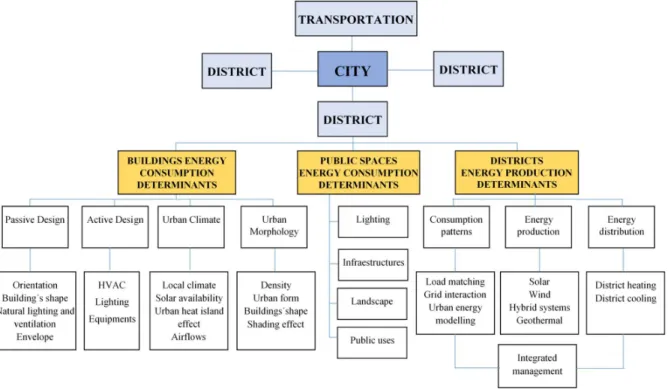
According to Amaral et al. (2018), the key factors that influence nZED energy behaviour are: for energy consumption - passive design, active systems, urban climate and urban morphology; for energy production - urban climate and morphology as well as energy
distribution and production; and the consumption patterns, as Figure 2 shows. Likewise, this work defines the main determinants at each scale (Figure 3). For building alone, there are: for energy consumption - passive design, active system, urban climate and urban morphology; for public space energy consumption - lighting, infrastructure, landscape and public uses; and for district energy production - consumption patterns, energy production and energy distribution.
Figure 2: nZED energy performance factors (source: Amaral et al. (2018)).
2.3.1 Energy Consumption
Buildings play an important role in urban energy systems regarding both the demand and supply of energy (Allegrini et al., 2015). An nZED is not a sum of nZEB’s of a district; it is considered as a group of buildings with different consumptions and their respective public surroundings, whose overall balance must reach almost zero (Amaral et al., 2018). Nevertheless, buildings remain the largest consumers of the total amount of energy demand, thus the main effort still resides in decreasing individual buildings’ loads, and for that, the same energy efficiency strategies proposed for nZEB should be met at the district scale as well (Amaral et al., 2018).
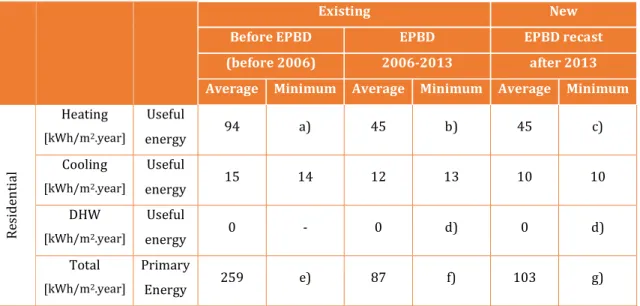
According to Table 1 in ADENE (2018), over the years, the energy performance requirements on buildings in Portugal have improved following the main legislative EU instruments that promote the energy performance of buildings and renovation.
Table 1: Energy performance indicators and corresponding requirements (source: (ADENE, 2018))
Existing New
Before EPBD EPBD EPBD recast
(before 2006) 2006-2013 after 2013
Average Minimum Average Minimum Average Minimum
R es id en ti al Heating [kWh/m2.year] Useful energy 94 a) 45 b) 45 c) Cooling [kWh/m2.year] Useful energy 15 14 12 13 10 10 DHW [kWh/m2.year] Useful energy 0 - 0 d) 0 d) Total [kWh/m2.year] Primary Energy 259 e) 87 f) 103 g)
a) Varies between 33 - 56 kWh/m2.year (1st and 3rd quartile)
b) Varies between 38 - 66 kWh/m2.year (1st and 3rd quartile)
c) Varies between 46 - 75 kWh/m2.year (1st and 3rd quartile)
d) Minimum solar energy contribution for DHW
e) Varies between 105 - 182 kWh/m2.year (1st and 3rd quartile)
f) Varies between 88 - 177 kWh/m2.year (1st and 3rd quartile)
g) Varies between 113 - 220 kWh/m2.year (1st and 3rd quartile)
2.3.1.1 Passive Design
Passive Design is the design that takes advantages of the climate to maintain a comfortable temperature range in the dwellings. Passive design uses layout, fabric and form to reduce or remove mechanical cooling, heating, ventilation and lighting demand. Some examples of passive measures include optimising spatial planning and orientation
to control solar gains and maximise daylighting, manipulating the building form and fabric to facilitate natural ventilation strategies and making effective use of thermal mass to help reduce peak internal temperatures.
The proper design and selection of a building envelope and its components are an efficient means to reduce both the space heating and cooling loads. Although the passive measures are applied at building level, a district intervention affords cost reduction in both project and execution phases through economies of scale (García-Fuentes et al., 2014).
In Aguacil et al. (2017) is stated that the International Energy Agency estimates the potential energy savings for 2050 in about 1509 million tonnes of oil equivalent of which 50–75% may be reached by considering only the improvement of the building envelope. It, therefore, seems clear that the residential building stock offers high potential for energy efficiency gains.
Aiming at ‘nearly zero energy heating’ targets to achieve the optimum savings is technically feasible in South Europe with higher summer temperatures and solar radiation by reducing the envelope conductivity and infiltration and selecting optimal glazing and window openings which may decrease significantly heating energy demand (Eleftheriou et al., 2017). The same author states that in the case of existing buildings the transition to nZEB introduces additional constraints for the control of overheating risks, thus nZEB need to be address properly for both heating and cooling seasons.
Thermal insulation is known to play a critical role in saving energy by reducing the rate of heat transfer. Determining the amount of insulation material required in walls is a key factor. Thermal insulation is one of the most valuable tools in achieving energy conservation in buildings. A proper amount of thermal insulation in the building envelope helps to reduce the cooling and heating energy demands of a building and its associated CO2 and SO2 emissions into the atmosphere (Kaynakli, 2012).
In Omranya et al (2016) presented a comprehensive review of passive wall systems for improving the energy efficiency in buildings. They were divided in two categories: 1) Passive wall system; Trombe walls, Autoclaved Aerated Concrete (AAC) walls, Double skin façades (DSF), Application of Phase Change Materials (PCM), Green walls/systems and Innovative wall system solutions; and 2) Future trends of building façade, such as Intelligent façades, Kinetic façades, Biophilic design and Climate adaptive building shells.
domed roofs, Solar-reflective/cool roofs, Green roofs, Photovoltaic roofs and the Thermal roof insulation systems.
A deep review on fenestrations was carried out in Petter et al. (2012) where different types of glazing are described; Multilayer glazing, suspended films, vacuum glazing, low-emissivity coatings, smart windows, solar cell glazing, self-cleaning glazing, aerogels, glazing cavity gas fills; spacers, made of foam, thermoplastic and metal-based; and frames, made from wood, aluminium, polyvinylchloride (PVC).
Over the years, the minimum requirements evolution for building envelope and ventilation in Portugal have improved significantly due to the growing need for energy reduction. Regarding the building envelope, Table 2 and Table 3 show the current reference maximum values of envelope U-value and window solar gain factor by climate zone in Portugal (Figure 4). In relation to the ventilation, the current standard should not be less than 0.4 air changes per hour.
Table 2: Reference and maximum U-Value by climate zone in Portugal.
Envelope
U-value [W/(m2.°C)] I1 I2 I3
Envelope elements and elements separating useful and non-useful areas (elevator shaft, common circulation areas) with btr <0.7 (thermal conditions similar to outdoors)
Opaque vertical elements 0.50 0.40 0.35 Opaque horizontal elements 0.40 0.35 0.30
Construction elements between buildings and non-useful areas (elevator shafts, common circulation areas) with btr ≤0.70 (thermal conditions similar to indoors)
Opaque vertical elements 0.80 0.70 0.60 Opaque horizontal elements 0.60 0.60 0.50
Windows (Uw) (doors and windows) 2.80 2.40 2.20
Elements in contact with the ground 0.50
Table 3: Maximum window solar gain factor by climate zone in Portugal.
gTmáx Climatic Zone
Thermal inertia V1 V2 V3
Low 0.15 0.10 0.10
Medium 0.56 0.56 0.50
Figure 4: Portugal Climatic Zone. 2.3.1.2 Active Design
An active design refers to the use of the technical systems for heating, cooling, domestic hot water, ventilation and energy generation.
In general, to maintain thermal comfort, a certain amount of energy demand to be added or removed (heating/cooling) to or from the building indoor space. The amount of energy is mainly dependent on outdoor weather conditions such as outside air temperature, relative humidity, wind characteristics and on indoor conditions of occupancy, heat and moisture flow through the walls and interiors, etc. Such energy acts as load on the heating, ventilation and air-conditioning (HVAC) system (for heat and moisture) installed to condition the building space. That energy load is the rate (heat gain rate) at which energy is being added (heating) or removed (cooling) to or from the building space in order to maintain the space temperature at the desired levels (Harish & Kumar, 2016).
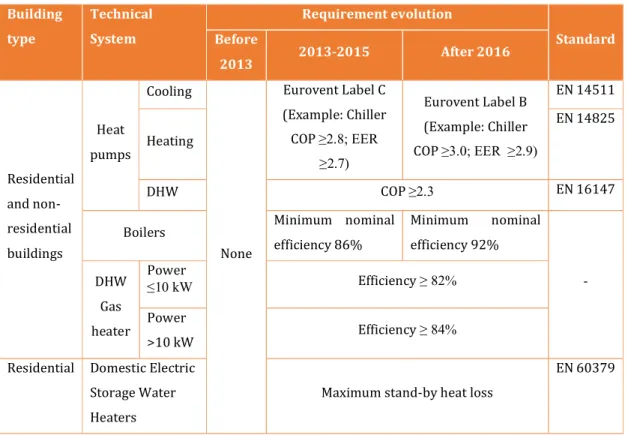
For García-Fuentes et al. (2014), an active system can be implemented from a district perspective achieving higher energy efficiency in order to meet the nZED objectives. According to ADENE (2018), in Portugal, there are requirements to be fulfilled regarding technical systems, which have been increasingly more demanding as new regulations came into force
.
Table 4 presents a brief resume of the evolution in requirements for technical systems.Table 4: Minimum requirements for technical system (source: ADENE (2018)) Building type Technical System Requirement evolution Standard Before 2013 2013-2015 After 2016 Residential and non-residential buildings Heat pumps Cooling None Eurovent Label C (Example: Chiller COP ≥2.8; EER ≥2.7) Eurovent Label B (Example: Chiller COP ≥3.0; EER ≥2.9) EN 14511 Heating EN 14825 DHW COP ≥2.3 EN 16147
Boilers Minimum nominal
efficiency 86% Minimum nominal efficiency 92% - DHW Gas heater Power ≤10 kW Efficiency ≥ 82% Power >10 kW Efficiency ≥ 84%
Residential Domestic Electric Storage Water Heaters
Maximum stand-by heat loss
EN 60379
2.3.1.3 Urban climate
The energy demand for heating, cooling and lighting of buildings is strongly dependent on the local microclimate at the specific building location (Allegrini et al., 2015). Furthermore, the growth of urban areas and the complexity of urban morphology have provided the development of urban microclimate with special attention to airflows and wind speed, outdoor temperature and solar radiation; these all together contributes to the Urban Heat Island (UHI) effect (Amaral et al., 2018). The local microclimate in urban areas differs from rural areas. For example, the air temperatures are higher due to the urban heat island effect, local wind speeds are lower due to wind sheltering by buildings and the solar and longwave radiation is influenced by shadowing effects and reflections from neighbouring buildings (Allegrini et al., 2015).
This strong interaction between the local microclimate and the effect of neighbouring buildings should be taken into account when conducting energy simulations, modelling both in a coupled way rather than the microclimate being a predetermined boundary condition, as is mostly the case (Allegrini et al., 2015). In Palme et al. (2017) was found that incorporating the UHI effect in the buildings´ performance simulation can result in
an increase of energy demand for cooling from 15% to 200% in south American coastal cities, hence temperature has an influence over on energy consumption associated with buildings´ cooling (Amaral et al., 2018).
A microclimate model typically consists of three sub-models: radiation models for solar and longwave radiation, flow models to determine wind speed, convective heat transfer at building facades and air temperatures, and building or city energy models to determine surface temperatures and energy demands. Researchers have recently been exploring methods of how to model local microclimatic phenomena within cities such as the urban heat island effect, local wind patterns and linking climate change predictions to current day to study the implications over urban building energy modelling (Reinhart & Cerezo, 2016).
2.3.1.4 Urban morphology
Urban morphology refers to the form of human settlement special structure and street pattern, building typology and the relation between them. Urban configurations will affect energy consumption, in buildings and public spaces, and they will influence the energy generation at urban level, especially solar due to different buildings´ forms height and densities and the consequent shading patterns (Amaral et al., 2018).
The building form is the most passive design aspect at a district scale which will influence the effect over surrounding buildings, for instance the shading effects. In this regard, high surface- volume ratio can increase heat gains in warmer climates and in colder regions larger surfaces are more exposed to thermal losses and therefore heating consumption, so the optimal form should be the minimal external surfaces (Amaral et al., 2018). Urban morphology and building typology are considered as crucial parameters to evaluate the energy performance of the built environment (Miguel et al., 2018).
The density is important in nZED analysis due to the influence of shading effect, which affects energy consumption or even natural lighting (Amaral et al., 2018). Studies show that density is the most influential parameter regarding solar potential/availability in building stocks (Amaral et al., 2018). Some studies state that high densities decrease energy consumption associated to mobility and others say denser urban block have lesser solar potential (Amaral et al., 2018). In warm climates, this effect may decrease the cooling needs but can block sunlight in colder climates.
District configurations can compensate the increased energy consumption by more generation and improve the demand pattern in peak times. In addition, compactness of building and density have a positive impact on the energy performance of districts but urban sprawl and suburban districts can lead to significant energy consumption in both buildings and transportation sector (Aghamolaei et al., 2018).
2.3.2 Energy Production
2.3.2.1 Energy production (on-site)
The integration of micro grids and local energy resources is considered to be a required step to enhance the energy performance of districts. The electric grid can provide energy to the district when on-site renewable generation is lower than the demand side and if greater, the on-site production can be sent to the grid or stored (Aghamolaei et al., 2018). 2.3.2.1.1 Renewable Energy
The production of energy using renewable sources reduces the need to import fossil fuels, such as coal and natural gas, making the country less dependent on foreign energy and reducing greenhouse gas emissions. Electricity is becoming a cleaner form of energy, since a massive increase of renewable energies, namely wind and solar, has been observed in EU in the last decade, leading to a progressively lower carbon content electricity.
Districts as integrated systems link transportation, home and the electric grid as well as enable large quantities of renewable power onto the grid (Aghamolaei et al., 2018). The advantages of local renewable energy generation include integration with existing building structures and reduction of grid transmission losses and grid congestion issues (Allegrini et al., 2015).
According to Allegrini et al. (2015) the solar, wind and bioenergy have the scale that allow successful integration with buildings, and hydropower, marine and high-temperature geothermal renewables are usually constructed at large scale (they are usually considered in the context of national or regional energy system). Determining the potential and calculating the performance of renewables in an urban environment is important for the design of future urban areas and the renovation of existing districts and neighbourhoods.
2.3.2.1.2 Solar
Solar technologies offer great potential for urban energy generation due to the availability of surfaces on buildings as well as the maturity of the technologies (Allegrini et al., 2015). In this regard, Portugal has the best yearly solar irradiance in Europe after Cyprus, particularly in the Alentejo region, in the southern part of the territory, and it is expected that solar energy will play an important role in decentralised power production (Miguel et al., 2018).
To calculate the energy that can be generated by solar technologies in the urban environment, two main elements must be considered: the urban solar availability, i.e. the total incident irradiation on building roofs and facades, and the utilisation factor that assesses the area suitable for installation as well as technical characteristics. On the other hand, urban morphologies impose difficulties on modelling of solar radiation compared to open areas due to complex shading patterns caused by different building heights, built densities and varying roof slopes (Allegrini et al., 2015).
According to the Portuguese legislation related to thermal solar panels, there is a minimum solar energy contribution for domestic hot water with a reference value equal to 0.65 m2/occupant that should be applied under certain conditions defined in energy
regulations in both new constructions and major renovations (REH, 2013). 2.3.2.1.3 Photovoltaic
In Villa-Arrieta & Sumper (2019) was presented a model of energy-economic evaluation of the cities sufficiency with the aim to analyse the investment in photovoltaic self-consumption of buildings to promote the creation of prosumers2 communities within the
cities. The model was applied in Barcelona city using PV generation capacity of around 35% of the Barcelona´s rooftop, energy efficiency measures and photovoltaic self-consumption in 17% of the residential buildings with the capacity of export to the grid. The results indicated that photovoltaic self-consumption and thus the existence of communities of nearly zero energy buildings sharing energy as Prosumers helps reduce primary energy consumption and CO2 emissions. The investment required to generate
Photovoltaic sector in Portugal is mainly driven by small installations, since 2014 significant cuts were made in the feed-in tariff (FIT) previously implemented, aiming to bring micro and mini generation FIT prices down to the market. The main incentive is now given to the self-consumption regime by the elimination of almost any bureaucracy to allow its installation (Eleftheriou et al., 2017). The Portuguese government aims to improve the guidelines issued in 2014 through the new legislation, the Decreto-Lei 162/2019, that came into force in 2020 by providing a clearer and more favourable framework for renewable energy self-consumption, energy storage and energy communities.
2.3.2.1.4 Wind
Even though wind energy is seen mainly as a national-scale energy resource, building-mounted wind turbines are also considered for micro-generation applications (Allegrini et al., 2015). However, there are some arguments regarding the modelling of urban wind speed as well as urban power production for urban environments, where accurate wind flows, including turbulent fluctuation, are extremely difficult to predict (Allegrini et al., 2015).
The most established renewable energy sources (RES) for electricity production in Portugal are hydro and wind, both account for over 90% of the installed capacity. Besides, Portugal has been a pioneering country regarding the adoption and massive diffusion of wind power parks across its territory (Miguel et al., 2018).
2.3.2.1.5 Biomass
The biomass exploitation takes advantage of the agricultural, forest, and manure residues and in extent, urban and industrial wastes, which under controlled burning conditions, can generate heat and electricity, with limited environmental impacts. Therefore, Biomass can significantly contribute in the energy supply system. According to Sartor, Quoilin, & Dewallef (2014), Biomass combined heat and power (CHP) plants connected to district heating (DH) networks are recognized as a very good opportunity to increase the share of renewable sources into energy systems.
The most common biomass resources available in Portugal are wood residues, animal waste, and municipal solid waste (Miguel et al., 2018).
2.3.2.2 Energy distribution
To facilitate heating and cooling throughout a building, the energy required for these functions is distributed from one or more central points. In a district/neighbourhood level, heating and cooling district play a distinct role by interconnecting the energy production to many customers, in a centralised way, through means of hot/cool water or steam networks to serve room space heating and cooling.
According to Lake, Rezaie, & Beyerlein (2017) district energy systems have higher efficiency when compared with individual heating and cooling systems. District heating and cooling energy systems are often more environmentally beneficial and financially reasonable when limited retrofit is required and are cost effective for more populated areas rather than rural areas. Several district networks are already in operation in different cities in Europe, however in Portugal there is only one network currently in operation in Lisbon (Popovski, Fleiter, Santos, Leal, & Fernandes, 2018) and it has not been replicated so far.
In Lake et al., (2017) also are described some advantages of district heating and cooling energy systems:
a) Linked to a decrease in CO2 emissions resulting from implementation of
polygeneration energy conversion technologies.
b) Combined heating and cooling is depicted to be more efficient user of energy resources.
c) Results of the effects of district heating on breathing rates indicate improvements in the health of the nearby population.
d) Potential to store heat in buildings for short-term thermal energy storage. e) District heating is competitive in high heat density city districts.
The Table 5 shows the different generation for district energy along time related to the type of heat production and energy source.
Table 5: Production and energy sources for district energy (source: Lake et al. (2017)). 1st Generation 2nd Generation 3rd Generation 4th Generation Peak Technology Period 1880-1930 1930-1980 1980-2020 2020-2050
Heat Production Steam Boilers CHP and heat-only boilers
Large-scale
CHP Heat Recycling
Energy Source Coal Coal and Oil Biomass, waste and
fossil fuels
Renewable sources
a) First generation
The primary transport fluid for heat for district heating systems until the 1930s was steam; this system uses pipes in concrete ducts with steam traps and compensators, but steam at high temperatures generates large amounts of heat losses and poses a risk from steam explosions. These first systems were often used in apartment buildings to reduce the risk of boiler explosions.
b) Second Generation
District energy transport systems used pressurized hot water using water pipes in concrete, shell-and-tube heat exchangers and large valves. These systems showed inability to provide control for the heat demand but showed improvement in fuel savings.
c) Third generation
District energy transport systems was developed; using pressurized water but at lower temperatures than the previous generation and often referred to as the “Scandinavian district heating technology” these systems featured prefabricated buried pipes, and compact substations and is the current system in use throughout the developed world. 2.3.2.2.1 District Heating
The fundamental idea of district heating is to use local fuel or heat resources that would otherwise be wasted, in order to satisfy local customer demands for heating, by using a heat distribution network of pipes as a local market place (Sven Werner, 2017)
District heating is the interconnection of various heat sources to customers by means of hot water or steam networks to serve room space heating and usually domestic hot water as well. District heating enables the use of a variety of heat sources that are often wasted, as well as renewable heat. The future standard of district heating is referred to as fourth-generation system, which operates at lower temperature, resulting in reduced heat loss
compared to previous generations, and they make feasible to connect to areas with low energy density. The systems can use diverse sources of heat, including low-grade waste heat, and can allow consumers to supply heat as well. Through heat storage, smart systems and flexible supply, these systems are an inexpensive solution for creating the flexibility required to integrate high levels of variable renewable energy into the electricity grid (UNEP, 2015).
2.3.2.2.2 District cooling
District cooling systems supply cold water through pipes in combination with cold storage. Cold water can be produced from waste heat (ie. Power generation or industry) through the use of steam turbine-driven or absorption chillers; from free cooling sources such as lakes, rivers and seas; and via electric chillers. District cooling can be more than twice as efficient as traditional decentralized chillers such as air-conditioning units and can reduce electricity use significantly during peak demand period through reduced power consumption and the use of thermal storage (UNEP, 2015).
2.3.3 Consumption Patterns
Consumption patterns refer to occupants´ interaction with building systems in order to control the indoor environment for health, and to obtain thermal, visual and acoustic comfort inside buildings (Delzendeh, Wu, Lee, & Zhou, 2017).
There is an alarming gap between the predicted and actual energy consumption of buildings and the analysis of the impact of occupants’ behaviour is considered to be largely overlooked in energy studies. In energy simulation tools is normally only considered through means of fixed and scheduled patterns of behaviour. The vast majority of research on occupants’ energy behaviour focuses on single buildings and there are only a few studies that investigate the urban scale impacts (Delzendeh et al., 2017). The total energy consumption of buildings are not only influenced by the metabolic heat produced by occupants passively but also by their active energy use. Occupants interact with control systems and building elements to reach their own personal desired level of comfort in different ways: use of building openings, use of lighting and controlling solar shading, use of HVAC systems, use of hot water and electrical appliances as it shows the Figure 5.
Figure 5: Effects of Occupants´ activities types on building energy performance (source: Delzendeh, Wu, Lee, & Zhou (2017)).
Figure 6: Factors influencing energy behaviour of occupants performance (source: Delzendeh, Wu, Lee, & Zhou (2017)).
HVAC systems, electrical devices and lighting that enable users to manage their own thermal and visual comfort, are the key sources of energy consumption in buildings and changes in using these systems can cause significant variations in the total energy consumption in buildings (Delzendeh et al., 2017).
The Figure 6 indicates the factors that influence the energy behaviour of occupants (Delzendeh et al., 2017): Climatic parameters; that are important influencing occupants’ interactions with building systems to acquire thermal comfort. Building type, which helps to determine the type of activity, clothing type, production of metabolic heat, together with the occupants’ specific needs and expectations and their possible degree of interactions with building systems. Social and personal parameters, such as users’ awareness, education, gender, play a substantial role in occupants’ comfort and energy attitude. Energy regulations and economical parameters, such as energy price and employment. In this context, studies show that when occupants are directly responsible for pay energy bills they act more energy frugal, energy costs is the main reason for avoiding the use of mechanical fans and accepting some level of discomfort (Delzendeh et al., 2017). However, another study showed that in harsh climatic conditions, low-income occupants consumed more electricity for cooling in comparison to other households due to the inadequate thermal insulation of the buildings. A number of studies have revealed that occupants tended to adjust building systems and appliances more at arrival than at departure of a building. Architecture and interior design features can influence occupant behaviour in differing ways, including visual quality of building openings, the architecture circulation and colours, material and compositions of interior spaces which may change occupants’ thermal perception.
METHODS AND TOOLS USED AT DISTRICT AND NEIGHBOURHOOD
SCALE
Significant progress has recently been made towards the development of simulation workflows to estimate overall operational building energy use across neighbourhoods (Reinhart & Cerezo, 2016).
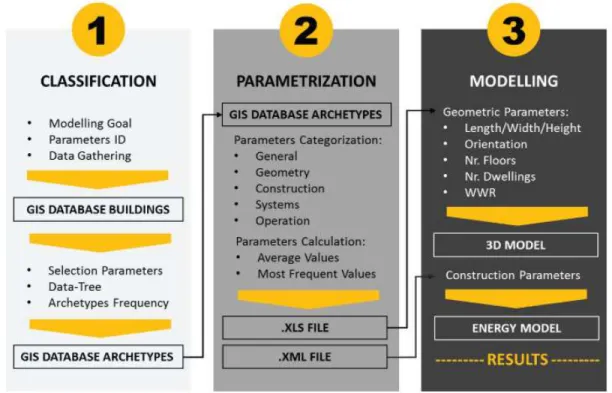
In Reinhart & Cerezo (2016) reviewed the data input at an urban building energy modelling. For geometry data consisted of building envelope shapes and windows open ratios as well as terrain data, the information can be extracted from datasets or generated
databases are increasingly accessible to the general public that can be used to generate extruded or 2.5D massing models of whole cities. For the non-geometry building properties; such as infiltration, equipment loads and occupant behaviour; construction assembly and HVAC systems at an urban scale the collection data at individual building level is impractical due to the enormous modelling effort. It is, therefore, necessary to abstract a building stock into “reference building”. The reference building approach has been extensively used in the context of national bottom-up building stock model to understand the aggregated impact of energy efficiency policies.
Regarding thermal modelling, Reinhart & Cerezo (2016) reviewed the workflows at urban level which differs in the type (steady-state or dynamic) and detail of thermal model used (single or multiple zone) as well as the effect of surrounding buildings (the shading between buildings, wind speed). The simplest case consists of single zone and steady-state heat balance models of each building archetype. Same as single zone models, multi-zone models can either be generated for archetypes buildings only or for each building individually so that solar shading can be considered as well. However, while building a multi-zone model for select archetypes is still feasible manually, this process has to be automated if applied to all buildings. In dense urban setting being able to model local wind speed and longwave radiation exchange between buildings in addition to direct shading can become relevant to quantify the impact of urban microclimate which has been applied using computer fluid dynamic (CFD) models (Reinhart & Cerezo, 2016).
2.4.1 Representativeness of Buildings
In the guidelines of the EPBD (2010), three methodologies are suggested for the determination of reference buildings from data collected:
d) Example Reference Building
Used when there is no available data so the information is gotten from literature such as manuals, standards, etc., or from the knowledge of experts in the field. Therefore, the RB is a non-real building that is supposed to have the most likely features of the building stock.
e) Real Reference Building
Based on on-site surveys and it results from a selection of existing buildings in the sample to represent its cluster. The building type shows characteristics similar to the mean geometrical and construction features of the statistical sample.