1
A simple water balance model adapted
for soil water repellency: application on
Portuguese burned and unburned
eucalypt stands
João Pedro Nunes1*, Maruxa Malvar1, Akli Ait Benali2, María Ermitas Rial Rivas1, Jan Jacob Keizer1
1- CESAM & Dept. Environment and Planning, University of Aveiro
2- Centro de Estudos Florestais, Instituto Superior Agronomia, Universidade de Lisboa
Keywords: soil water repellency; post-fire impacts; eucalypts; soil hydrology; hydrological
modeling.
Running head: Repellency-adapted soil water balance model for eucalypt stands
This is the peer reviewed version of the following article:
Nunes J.P., Malvar M., Benali A.A., Rial Rivas M.E., Keizer J.J. 2016. A simple water balance model adapted for soil water repellency: application on Portuguese burned and unburned eucalypt stands. Hydrological Processes 30 (3): 463-478 (DOI: 10.1002/hyp.10629).
which has been published in final form at http://dx.doi.org/10.1002/hyp.10629. This article may be used for non-commercial purposes in accordance with Wiley Terms and Conditions for Use of Self-Archived Versions.
2
A simple water balance model adapted
for soil water repellency: application on
Portuguese burned and unburned
eucalypt stands
João Pedro Nunes1*, Maruxa Malvar1, Akli Ait Benali2, María Ermitas Rial Rivas1, Jan Jacob Keizer1
1- CESAM & Dept. Environment and Planning, University of Aveiro
2- Centro de Estudos Florestais, Instituto Superior Agronomia, Universidade de Lisboa
Keywords: soil water repellency; post-fire impacts; eucalypts; soil hydrology; hydrological
modeling.
Running head: Repellency-adapted soil water balance model for eucalypt stands
Abstract
Soil water repellency can impact soil hydrology, overland flow generation and associated soil losses. However, current hydrological models do not take it into account, which creates a challenge in repellency-prone regions. This work focused on the adaptation for soil water repellency of a daily water balance model. Repellency is estimated from soil moisture content using site-specific empirical relations, and used to limit maximum soil moisture. This model was developed and tested using c. 2 years of data from one long-unburned and two recently burned eucalypt plantations in northern Portugal, all of which showed strong seasonal soil water repellency cycles. Results indicated important improvements for the burned plantations, with the Nash-Sutcliffe efficiency increasing from -0.55 and -0.49 to 0.55 and 0.65. For the unburned site, model performance was already good without the modification and efficiency only improved slightly from 0.71 to 0.74, mostly due to the better simulation of delayed soil wetting after dry periods. Results suggested that even a simple approach to simulate soil water repellency can markedly improve the performance of hydrological models in eucalypt forests, especially after fire.
Introduction
Soil Water Repellency (SWR) is an intrinsic and fundamental physical property which refers to the ability of a soil to repel water (Doerr et al., 2000; King, 1981). Repellent soils can resist wetting for time scales ranging from seconds to weeks (Doerr et al., 2000). Land use and the prevailing vegetation may dictate the presence and type of hydrophobic organic compounds that cause SWR (Doerr et al., 2000); the importance of land-use and land management for SWR has been highlighted by recent research (e.g. Cerdà and Doerr, 2007; González-Peñaloza et al.,
3
2012). Fire can also be a major factor for the occurrence of SWR (e.g. Bodí et al., 2013; Ferreira et al., 2004; Keizer et al., 2008; Pereira et al., 2013) but fire effects can be highly variable, depending mainly on the soil heating regime, the type of organic matter consumed and the amount of oxygen available during burning (Doerr et al., 2009), with ashes playing an important role (Bodí et al., 2014); in some cases fires could decrease SWR (e.g. Cerdà and Doerr, 2005). Research has suggested that SWR plays an important role in determining the impacts of fire on soil chemistry and biology (e.g. Hedo et al., 2015; Pereira et al., 2014), as well as soil hydrology and erosion (e.g. Keesstra et al., 2014; Malvar et al., 2013, 2011). Brevik et al. (2015) have noted that the study of SWR is an important but complex subject which requires an inter-disciplinary approach, especially as it involves links between soils and climate.
Eucalypt forest plantations have been associated with elevated levels of SWR in long unburned conditions (Keizer et al., 2005a, 2005b; Rodríguez-Alleres et al., 2007; Santos et al., 2013; Scott, 2000) as well as post-fire conditions (Ferreira et al., 2008; Keizer et al., 2008; Malvar et al., 2013; Prats et al., 2013, 2012). Portugal and the northwestern Iberian Peninsula experienced major afforestation with eucalypt (especially Eucalyptus globulus Labill.) during the second half of the 20th century (Moreira et al., 2001). As a result, about 35% of the Portuguese territory is presently
covered by forest, of which of 26% is eucalypt (ICNF, 2013). Such a large-scale afforestation with exotic tree species may have important consequences for ecosystem services, biodiversity conservation, water balance, and soil properties, including soil hydrology. It is therefore important to understand how SWR might affect hydrological processes in eucalypt forests, especially when considering that they are also common (and also have high background SWR) in other regions of the globe such as South Africa (Scott, 2000) and Australia (Doerr et al., 2006). SWR decreases the wetting of the soil matrix and, thereby, promotes spatial variability in infiltration or percolation, with the development of fingered or preferential flow paths (Diamantopoulos et al., 2013; Doerr et al., 2003, 2000; Granged et al., 2011), which in turn can decrease the availability of water storage in the root zone after rainfall (Blanco-Canqui and Lal, 2009). SWR can therefore also increase overland flow (DeBano, 2000; Doerr et al., 2000; Gabarrón-Galeote et al., 2013). These impacts have been demonstrated in both long-unburned (Keizer et al., 2005a) and recently burned eucalypt stands (Leighton-Boyce et al., 2007). In particular, the enhancement of SWR might be one of the most important ways in which fires in eucalypt stands cause hydrological impacts (Shakesby and Doerr, 2006), and fires might increase the persistence of SWR in eucalypt soils (Stoof et al., 2011).
SWR is a transient property that varies non-linearly with Soil Moisture Content (SMC), with a transition zone between wettable and repellent conditions rather than a distinct threshold (Dekker et al., 2001; Hewelke et al., 2014; Regalado and Ritter, 2005; Rueda et al., 2015). This has also been observed for eucalypt plantations (Keizer et al., 2008; Leighton-Boyce et al., 2005; Santos et al., 2013). In this transition zone, the soil can act as either repellent or wettable. Thus, SWR can be highly variable both in time and space (Doerr et al., 2003). Changes from wettable to extremely repellent conditions can occur over short time intervals, as short as 1 to 2 weeks (Keizer et al., 2008, 2005b; Leighton-Boyce et al., 2005). On the other hand, the centimeter-scale spatial variations in repellency have been shown to cause the formation of preferential flow pathways, which can cause the soil matrix itself to remain dry after a storm (Doerr et al., 2003).
4
SWR can be described in terms of the intensity of its effects, i.e. the strength with which soil repels water, but also of its persistence, i.e. how long the soil remains repellent in the presence of water (see e.g. Chau et al., 2014 or Doerr et al., 2000 for a more detailed description). Both parameters vary with SMC, but they are not necessarily related, i.e. strong repellency in a soil may show low persistence and vice-versa (Chau et al., 2014).
Including SWR may be a main factor for successful water balance modeling of both burned and unburned eucalypt forests, (Doerr et al., 2003; Esteves et al., 2012). However, the highly dynamic spatio-temporal patterns in SWR and SMC under field conditions make the development of appropriate equations a particularly challenging task. Recent research has developed several approaches to simulate the impact of SWR on soil wetting; they are typically based on the parameterization of retention curves (see e.g. Bachmann et al., 2007; Beatty and Smith, 2013; Ganz et al., 2014; Karunarathna et al., 2010; Kramers et al., 2005; Moody and Ebel, 2014; Moody et al., 2009; Nyman et al., 2014; Ritsema et al., 2005). However, these approaches have not commonly been integrated into hydrological models. Furthermore, there is a lack of simpler approaches that can be used to adapt for repellent soils less complex, but widely used conceptual soil water balance models (explicit soil moisture accounting models; Beven, 2012). Vieira et al. (2014) have shown that even a simple adaptation for repellency can improve the performance of hydrological models in burned eucalypt and pine forests. However, their approach involves a seasonal time scale and is difficult to introduce in models with a higher temporal resolutions. Instead, several empirical relationships have been established between SWR and SMC (Regalado and Ritter, 2009a, 2009b) which can be adapted for daily predictions. This work has as main goal to demonstrate how a relatively simple approach can be used to adapt water balance calculations for the occurrence of SWR. The main part of the work consisted in modifying a simple, daily water balance model (Thornthwaite and Mather, 1957) to take SWR into account. The model was formulated and evaluated using SWR and SMC data collected for three eucalypt plantations in central Portugal, and previously analyzed by Santos et al. (2013: unburned) and Keizer et al. (2008: burned). Satellite imagery was used to parameterize the impacts of vegetation cover on interception and potential evapotranspiration, especially to account for the pronounced cover changes during the first two years after fire.
Methods
This work was carried out at one eucalypt plantation in a long-unburned study site and two eucalypt plantations in a recently burned study site, both of which located in the humid coastal region of northwestern Portugal, a mountainous area that is mostly covered by planted forest (eucalypt and maritime pine). It was developed in three steps:
1. the Thornthwaite-Mather Water Balance Calculation Method (T-M method) was modified to include a limitation in soil wetting due to SWR, taking into account the empirical relations between SWR and SMC observed in the three plantations;
2. the original and modified T-M methods were applied to the three plantations using in-situ measurements of meteorology and soil properties, and using satellite products to parameterize vegetation cover;
5
3. time-series of SWR and SMC data from the three plantations were used to evaluate the performance of the T-M method, both with and without the SWR modification.
Study sites
The two study sites were located on the western slopes of the Caramulo mountain range, 20-30 km inland from the city of Aveiro. This region has a humid Mediterranean climate, characterized by high annual rainfall rates (750-2000 mm) but a distinct dry summer season. The soils at the study sites are representative of the larger regional scale; they are Leptosols or Cambisols (IUSS Working Group WRB, 2014) overlying schists, with a coarse texture, stony and shallow (20-60 cm; Malvar et al., 2011; Santos et al., 2013). SWR is commonly observed during the dry season in burned and unburned eucalypt and pine forests (Doerr et al., 1996; Keizer et al., 2008; Leighton-Boyce et al., 2005; Santos et al., 2013).
The Serra de Cima study site is a long-unburned (28 years) eucalypt forest plantation. It has been studied since the late 1980s, including by an intensive SWR and SMC monitoring campaign between mid-2011 and mid-2012, accompanied by continuous SMC recordings and collection of ancillary data (Santos et al., 2013). The Albergaria study site comprises two eucalypt plantations that were burned during the summer of 2005. The two plantations on adjacent hillslopes (sub-sites A1 and A2) were monitored during the first two years after the fire, including by SWR and SMC measurements (Keizer et al., 2008) and repeated rainfall simulation experiments (Malvar et al., 2011).
Water balance calculations
The T-M method (Thornthwaite and Mather, 1957) was selected for this study since it is a relatively simple and widely tested conceptual model that contains the main processes represented in many of the commonly-used daily-scale water balance models. The T-M method computes daily soil water balance using Equation 1; the shaded area in Figure 1 schematizes the original method. The parameters of the original T-M method are soil Available Water Capacity (AWC), fraction of rainfall transformed in direct outflow, and outflow decay rate (Table 1); the latter two parameters, however, were not used in this work as they are mainly important at the watershed scale.
Equation 1. ΔSMC = PP – ET – Qo;
where: SMC = Soil Moisture Content (mm); PP = daily rainfall (mm); ET = daily evapotranspiration (mm); Qo = daily outflow (mm).
6
Figure 1. Conceptual water balance model used in this work; the shaded area represents the original T-M method.
Table 1. Parameters of the T-M water balance method used in this study.
Parameter Name Units Notes
AWC Soil Available Water Capacity mm Original T-M method fQo Fraction of rainfall transformed in direct outflow - Original T-M method; not used
dQo Outflow decay rate - Original T-M method; not used
Kc Crop coefficient - Included in this work; time-variable
Sc Canopy storage capacity for interception Included in this work; time-variable
AWCmin Soil AWC adjusted for repellent conditions mm Included in this work
SMC_WRmin SMC threshold below which soil is always repellent mm Included in this work
SMC_WRmax SMC threshold above which soil is always wettable mm Included in this work
SMC_lAWCmin SMC threshold below which AWC = AWCmin mm Included in this work
SMC_lAWCmax SMC threshold above which AWC has no limitations mm Included in this work
The forcing functions are rainfall and Potential Evapotranspiration (PET). In this work, the method was applied using useful rainfall (i.e. gross rainfall minus interception; Figure 1). Interception was calculated using the revised Gash model (Gash et al., 1995), parameterized for
Rainfall
Soil Water
Repellency
Modified AWCInterception
Useful
rainfall
Evapotranspiration
Potential
Evapotranspiration
Soil Moisture Content
Crop coefficient Canopy storage capacity Soil AWCOutflow
Forcing function Model internal result Model output Model parameter Legend:7
Portuguese eucalypt plantations (de Coninck, 2003; Ferreira, 1996; Valente et al., 1997). This led to an additional parameter Sc for interception (Table 1); given the changes in vegetation cover
for the Albergaria site, it was made to vary in time at the daily time scale, using a similar formulation to that of van Dijk and Bruijnzeel (2001), to reflect post-fire vegetation recovery (see below).
PET was calculated from daily maximum and minimum temperature, solar radiation, relative humidity and wind speed using the Penman-Monteith equation (Allen et al., 1998). In this work, the method was applied using crop-adjusted PET (Figure 1), calculated from reference PET using the crop coefficient approach (Allen et al., 1998), which led to an additional parameter Kc for the
crop coefficient (Table 1). This parameter was also made to vary in time to reflect vegetation recovery (also following Allen et al., 1998).
The outputs include Soil Moisture Content (SMC), Effective Evapotranspiration (EET) and outflow, which in this work combines surface and subsurface runoff with percolation. In the T-M method, EET is computed as a function of PET and ST-MC; when soil water is insufficient to fulfill PET demands, EET is decreased according to the accumulated evapotranspiration deficit (Thornthwaite and Mather, 1957). Moreover, since the calculations of interception include canopy evaporation, EET corresponds mostly to transpiration, with perhaps a small component related with soil evaporation.
Finally, the T-M method was adapted to accommodate the impacts of SWR on soil wetting (the lower part of Figure 1) in terms of both intensity and persistence. Five new parameters were added for this adaptation and are listed in Table 1. The processes were simulated as follows:
• Intensity was simulated as a range between a low SMC threshold SMC_WRmin, under
which soils are repellent, and a high SMC threshold SMC_WRmax, above which soils are
wettable. For SMC values between both parameters, SWR varied linearly.
• Persistence was simulated as limit to soil wetting under repellent conditions, varying linearly between a lowest value AWCmin for SMC corresponding to repellency, and a
highest value (the full soil AWC) for wettable soils. Higher values facilitated soil wetting and were therefore related with lower SWR persistence.
• The SMC thresholds for persistence were different from those for intensity, to take into account differences between both processes. The low SMC threshold for persistence was SMC_lAWCmin and the high SMC threshold was SMC_lAWCmax,
This approach presupposes that SWR limits infiltration into the soil matrix, as described earlier, but not necessarily percolation and lateral flow. It also assumes that a single SWR value can represent conditions on a site, whereas SWR is highly variable in space as described earlier; this can be considered an “effective” model parameter (sensu Beven, 2012). SWR and maximum soil wetting are calculated at the start of each day; if rainfall occurs, infiltration is limited accordingly. At the end of each day, SWR and maximum soil wetting are then updated according to SMC, using the above-mentioned site-specific SWR-SMC relationships.
8
In situ measurements of SWR, SMC and soil properties
In-situ measurements in the study sites were used in this work for parameter estimation and model calibration. A summary is given underneath; further details can be found in Santos et al. (2013) for Serra de Cima and Keizer et al. (2008) for Albergaria.
Meteorology was measured by the Pousadas automatic meteorological station at 1 Km distance from the Serra de Cima site and 10 Km distance from the Albergaria site. In addition, rainfall was recorded by a tipping-bucket rain gauge at the Albergaria site as well as by one storage rainfall gauge at each site, mainly for validation of the automatic gauges. PET was calculated from these values using the Penman-Monteith equation (Allen et al., 1998).
Soil water retention was measured in the laboratory (pressure plate method and, for Serra de Cima, also evaporation method) for Field Capacity (FC; pF 2) and Wilting Point (WP; pF 4.2); soil AWC was determined as the difference between both (Allen et al., 1998). At Serra de Cima, a total of 5 pF rings were collected from one soil profile. At Albergaria, 2 pF rings were collected at 3 depths (0-50, 50-100 and 100-200 mm) from two soil profiles in each of the two plantations; profile-averaged values were calculated using a weighted average of measurements according to their representative depth. In addition to the pF rings, soil samples were collected to determine soil texture and organic matter content in the laboratory. Furthermore, soil depth was determined in the soil profile plus four auxiliary sampling points in Serra de Cima, and in each of the four soil profiles in Albergaria.
SWR and SMC were measured along transects at regular 1- to 2- weekly intervals. For each sampling date, a transect was laid out along the slope length at shifting positions. The transects were 80 m at Serra de Cima, 20-25 m at Albergaria A1 and 30-40 m at Albergaria A2. Along each transect, 3-5 sampling plots were selected at equal distances and, at each sampling plots, 3 measurement points were selected at fixed positions within an area of 50x60 cm. At each measurement point, both SWR and SMC were determined at two depths (0-50 and 50-100 mm) and, in the case of Albergaria, at a third depth of 100-200 mm. SWR was measured using the Molarity of Ethanol Droplet (MED) test (King, 1981), while SMC was recorded using a hand-held probe (Decagon at Serra de Cima and ThetaProbe at Albergaria). The SMC readings were then calibrated to fall between the SMCs at field capacity and at the wilting point, as obtained from the pF rings. The same depth-weighted average method was used to calculate profile-averaged values. At Serra de Cima, SMC was also recorded continuously (15-min intervals) between January 2010 and October 2012, using Decagon probes linked to a Decagon data logger. This was done at two points and at two depths (25 and 75 mm) per point. Recordings were, however, interrupted from March to June 2011 due to stolen sensors. These SMC values were also calibrated, but fall between the SMCs at saturation (calculated from measured bulk density) and at wilting point, using a depth-weighted average method to calculate profile-averaged values. The continuous SMC data were used to estimate daily transpiration at the study sites by means of Equation 1, assuming that: (i) soil evaporation was negligible; (ii) the maximum ET was 1.2×PET (see David et al., 1997); (iii) decreases in soil moisture were due to ET when SMC was below field capacity, i.e. in these days Qo was negligible; (iv) eucalypt had no access to possible
9
Remote sensing of vegetation cover parameters
Vegetation cover was characterized using Normalized Differential Vegetation Index (NDVI) data from the Moderate Resolution Imaging Spectroradiometer (MODIS) sensor onboard the Terra platform (Huete et al., 1999). NDVI is a vegetation index which yield a proxy for radiation absorption by chlorophyll and has commonly been used for the characterization of vegetation cover through remote sensing (Carlson and Ripley, 1997). The MOD13Q1 product has been selected for this study, since it provides an adequate spatial and temporal resolution of respectively 250 m and 16 days (Solano et al., 2010). It was used to characterize parameters Kc
and Sc for the model (Table 1).
The NDVI value for each composite and study site was generated as the average of a kernel of 3x3 250 m pixels centered in the study site, to minimize the impact of geolocation errors; the sites were judged to be sufficiently homogenous for representation at this scale (750x750 m). Pixels were filtered based on available information for reliability (see Solano et al., 2010); only pixels with a reliability index of 0 or 1 (indicating respectively good quality or marginal quality) were used in this calculation, while pixels with a reliability index of 2 or 3 (indicating respectively snow/ice or clouds) were rejected. The time series still showed noise (i.e. unexpected short-term variability), which can usually be attributed to atmospheric variability and other issues associated with the lower quality pixels such as cloud contamination (Gu et al., 2009). Therefore a smoothing algorithm was applied to the series based on the 3-P filter described by Gu et al. (2009), where the value for each 16-day composite was replaced by a weighted average of the current value (50% weight) and the values of the time composites immediately before and after (25% weight each). Finally, a daily time series of NDVI was created by linear interpolation between the 16-day composites.
Leaf Area Index (LAI) time-series were calculated from NDVI using a semi-empirical approach based on light extinction (Baret and Guyot, 1991). Equation 2 was adjusted for the Serra de Cima NDVI data using a light extinction coefficient of 0.42 and assuming local LAI stand values between 4 and 5.5 (Ferreira, 1996; Valente et al., 1997). Given the strong relationship between LAI and canopy storage parameter Sc (van Dijk and Bruijnzeel, 2001), published values were used
to calculate a value of Sc = 0.44 mm per unit LAI (de Coninck, 2003; Ferreira, 1996; Valente et al.,
1997). This relationship was used to calculate a LAI-derived time-series of Sc for each site, which
was then used in the calculation of interception for the T-M method (Figure 1). Equation 2. LAI = -K-1 ∙ ln[(NDVI - NDVI
max_LAI) ∙ (NDVImin_LAI - NDVImax_LAI))-1];
where: LAI = Leaf Area Index; K = Light extinction coefficient; NDVI = Normalized Differential Vegetation Index values, NDVImax_LAI = limiting NDVI for large LAI values;
NDVImin_LAI = NDVI for LAI=0,
NDVI was correlated with the crop coefficient parameter Kc following the approach developed
by Duchemin et al. (2006), which is summarized in Equation 3. This approach assumes that soil evaporation is negligible and that the crop coefficient is only determined by the basal crop coefficient (Allen et al., 1998). Equation 3 was adjusted to values of daily basal crop coefficient for Serra de Cima, calculated from PET and transpiration data, with the limitations proposed by Duchemin et al. (2006): (i) using only the wetter period, when transpiration was correlated with PET, to avoid the effect of soil water limitations; (ii) avoiding periods with large rainfall, where
10
evaporation from the canopy and soil is important and hence the assumptions of the method are not valid (a rainfall threshold was selected to provide the best correlation between NDVI and Kc).
Equation 3. Kc = a ∙ (NDVI - NDVImin_Kc);
where: Kc = crop coefficient; a = empirical scaling coefficient; NDVI = Normalized
Differential Vegetation Index values; NDVImin_Kc = NDVI for Kc=0.
Model assessment approach
Initially, the T-M model was applied without the SWR modification, to provide a baseline value for comparison. The model modified for SWR was then calibrated against the measured SMC values (daily values for Serra de Cima, and 1- to 2-weekly values for Albergaria) with the help of an automatic optimization method (Non-Linear Generalized Reduced Gradient approach; Lasdon et al., 1978). The AWC parameter was not modified from the measured value, so that optimization focused on the parameters AWCmin, SMC_WRmin, SMC_WRmax, SMC_lAWCmin and
SMC_lAWCmax from Table 1. It was not possible to estimate values for AWCmin from
measurements, so this parameter was allowed to range between 1 and 100% of AWC. The remaining parameters were optimized within a range taken from the observations described above. The relationship between SWR intensity and persistence was kept by limiting differences between thresholds, i.e. by not allowing SMC_WRmin and SMC_WRmax to vary more than 25%
from SMC_lAWCmin and SMC_lAWCmax, respectively. Optimization focused first and foremost on
optimizing the simulation of SMC, with the optimization of SWR as a secondary objective. The Nash-Sutcliffe Efficiency index (NSE; Nash and Sutcliffe, 1970) was used to assess model performance, with an NSE ≥ 0.5 indicating a satisfactory performance (Moriasi et al., 2007).
Results
In situ measurements of SWR, SMC and soil properties
Table 2 shows the measured soil properties at the three eucalypt plantations studied here. AWC (in mm) – used directly as a parameter in the T-M water balance calculation method – was higher at Serra de Cima than at the two Albergaria plantations. This was mostly due to a lower wilting point, although the deeper soils also contributed to the higher absolute AWC. The relationship between SMC and SWR was well-defined for all three plantations (Figure 2), with the threshold for wettable soils inside the range of 20 to 30% SMC, although measurements for Serra de Cima indicated that the threshold could be above 30%. Further analysis can be found in Santos et al. (2013) for Serra de Cima and in Keizer et al. (2008) for Albergaria. Based on this data, the optimization range for parameters SMC_WRmin and SMC_IAWCmin was set between 9 and 25%
for site Serra de Cima, and between 15 and 25% for sites Albergaria A1 and A2. The range for parameters SMC_WRmax and SMC_IAWCmax was set between 25 and 35% for all sites.
11
Figure 2. Relationship between Soil Water Content and Soil Water Repellency in the three eucalypt plantations. SWR is given in the MED classes proposed by Keizer et al. (2008): 0-2 = non-repellent; 3 = slightly repellent; 4 = moderately repellent; 5 = strongly repellent; 6-7 = very strongly repellent; 8 = extremely repellent.
Table 2. Soil properties at the long-unburned and the two recently burned eucalypt plantations.
Site Soil depth (mm) Field capacity SMC at pF 2 (% vol.) Wilting point SMC at pF 4.2 (% vol.) AWC SMC between pF2 and pF 4.2 (% vol.) Sand (% fines) Silt (% fines) Clay (% fines) Organic Matter content (% ) Serra de Cima 350 30.3% 9.4% 20.9% 23.2% 57.4% 19.4% 16.3% Albergaria A1 200 29.4% 16.7% 12.8% 35.7% 24.1% 33.7% 10.7% Albergaria A2 225 34.3% 18.1% 16.2% 39.9% 20.9% 28.9% 11.4%
Remote sensing of vegetation cover parameters
The adjustment of Equation 2 to estimate LAI led to values of K = 0.42, NDVImax_LAI = 0.9 and
NDVImin_LAI = 0.1. Canopy storage Sc, estimated from LAI, ranged between 1.1 and 2.5 mm in Serra
de Cima, and between 0.6 and 1.4 mm in Albergaria, the latter values being smaller due to the fire occurrence, and increasing with time due to post-fire vegetation recovery.
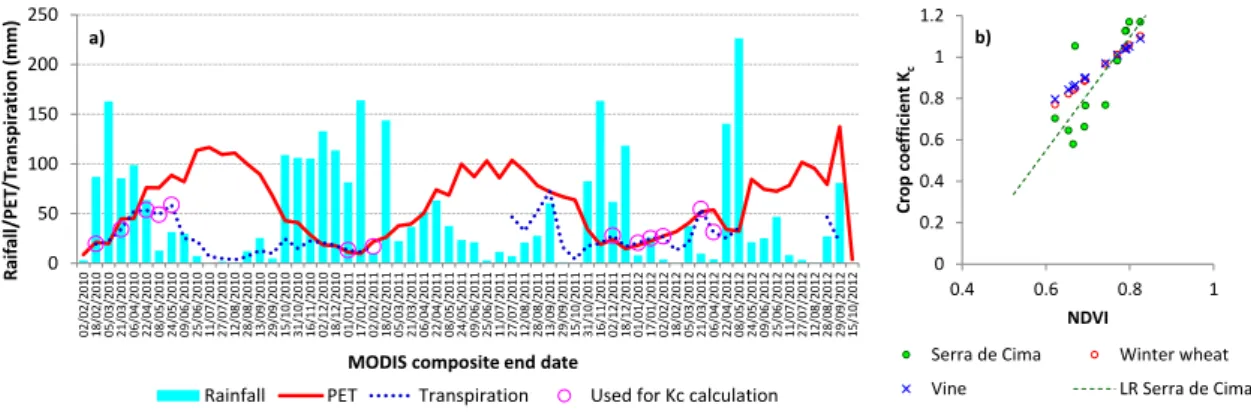
The adjustment of Equation 3 used NDVI and Kc values between the wet and dry periods, as
shown in Figure 3a; the wet period used composites where bi-weekly rainfall ≤ 90 mm, as this led to the best relationship between NDVI and Kc (r = 0.81, p < 0.01). This relation is shown in
Figure 3b, and led to an adjustment of Equation 3 with parameters a = 2.74 and NDVImin_Kc =
0.40. The coefficient of determination for Equation 3 was r2 = 0.66, but it should be noted that
the exclusion of one outlier could have led to a large improvement (r2 = 0.85).
0
1
2
3
4
5
6
7
8
0
10
20
30
40
SW
R
(M
ED
cl
ass)
SMC (% vol)
Serra de Cima
Albergaria A1
Albergaria A2
12
The adjusted parameters led to a steeper NDVI-Kc relation than would have been derived from
values in literature on Mediterranean crops (Figure 3b): wheat with a = 1.63 and NDVImin_Kc =
0.15 (Duchemin et al., 2006), and vineyards with a = 1.44 and NDVImin_Kc = 0.07 (Campos et al.,
2010). However, the three parameter sets led to a similar range of Kc estimates for eucalypts in
Serra de Cima. This similarity, together with the fact that the data covered the full range of estimated Kc values, indicates the validity of this relation for eucalypts at Serra de Cima.
However, the minimum observed NDVI was c. 0.6 which could limit the validity of Kc values
estimated for the first post-fire year in Albergaria, when NDVI ranged between 0.4 and 0.6; in the second year NDVI reached values between 0.55 and 0.7, in line with the ones in Serra de Cima. The final Kc values ranged between 0.61 and 1.17 at Serra de Cima and between 0.4 and
0.8 at Albergaria.
Figure 3. a: accumulated rainfall, PET and transpiration for the MODIS composites in Serra de Cima, and selected transpiration values to calculate the NDVI-Kc relation; b: relation between NDVI and crop coefficient Kc at Serra
de Cima, compared with Kc values estimated for wheat and vine using published parameters (respectively by
Duchemin et al., 2006, and Campos et al., 2010).
Figure 4 shows the original PET, crop-adjusted PET (for eucalypts) and NDVI in Serra de Cima and Albergaria. In Serra de Cima, crop-adjusted PET tends to follow PET in winter and be slightly lower in summer, which can be attributed to stomatal closure under dry conditions (see David et al., 1997). In Albergaria, crop-adjusted PET began much lower than PET but approached PET as vegetation recovered, although at the end of the second year the values were still not at the level observed in Serra de Cima. Annual crop-adjusted PET was estimated as being between 81 and 87% of PET in Serra de Cima, while in Albergaria it was estimated at 43% in the first year after the fire and 63% in the second year.
0 50 100 150 200 250 02/ 02/2 010 18/ 02/2 010 05/ 03/2 010 21/ 03/2 010 06/ 04/2 010 22/ 04/2 010 08/ 05/2 010 24/ 05/2 010 09/ 06/2 010 25/ 06/2 010 11/ 07/2 010 27/ 07/2 010 12/ 08/2 010 28/ 08/2 010 13/ 09/2 010 29/ 09/2 010 15/ 10/2 010 31/ 10/2 010 16/ 11/2 010 02/ 12/2 010 18/ 12/2 010 01/ 01/2 011 17/ 01/2 011 02/ 02/2 011 18/ 02/2 011 05/ 03/2 011 21/ 03/2 011 06/ 04/2 011 22/ 04/2 011 08/ 05/2 011 24/ 05/2 011 09/ 06/2 011 25/ 06/2 011 11/ 07/2 011 27/ 07/2 011 12/ 08/2 011 28/ 08/2 011 13/ 09/2 011 29/ 09/2 011 15/ 10/2 011 31/ 10/2 011 16/ 11/2 011 02/ 12/2 011 18/ 12/2 011 01/ 01/2 012 17/ 01/2 012 02/ 02/2 012 18/ 02/2 012 05/ 03/2 012 21/ 03/2 012 06/ 04/2 012 22/ 04/2 012 08/ 05/2 012 24/ 05/2 012 09/ 06/2 012 25/ 06/2 012 11/ 07/2 012 27/ 07/2 012 12/ 08/2 012 28/ 08/2 012 29/ 09/2 012 15/ 10/2 012 R ai fa ll/PET /T ra n sp ir ati on (m m )
MODIS composite end date
Rainfall PET Transpiration Used for Kc calculation
a) 0 0.2 0.4 0.6 0.8 1 1.2 0.4 0.6 0.8 1 Cr op coe ff ici en t Kc NDVI
Serra de Cima Winter wheat
Vine LR Serra de Cima
13
Figure 4. Daily crop-adjusted PET calculated using Kc (PET eucalypts), unadjusted PET, and NDVI for a) Serra de Cima and b) Albergaria.
Figure 5 shows rainfall, calculated interception and NDVI in both study sites. Annual rainfall ranged between 1000 and 1600 mm in both sites. Interception in Serra de Cima was calculated as being between 22 and 24%; in Albergaria, interception in the first year was calculated as 18%, and as 20% in the second year as vegetation recovered.
0.4 0.5 0.6 0.7 0.8 0.9 0 1 2 3 4 5 6 7 8 9 10 Fe b -10 Ap r-10 Ju n -1 0 Au g-10 Oc t-1 0 D ec -1 0 Fe b -11 Ap r-11 Ju n -1 1 Au g-11 Oc t-1 1 D ec -1 1 Fe b -12 Ap r-12 Ju n -1 2 Au g-12 ND VI PET (m m ) PET eucalypts PET NDVI a) 0.4 0.5 0.6 0.7 0.8 0.9 0 1 2 3 4 5 6 7 8 9 10 Au g-05 Oc t-0 5 D ec -0 5 Fe b -06 Ap r-06 Ju n -0 6 Au g-06 Oc t-0 6 D ec -0 6 Fe b -07 Ap r-07 Ju n -0 7 Au g-07 ND VI PET (m m ) PET eucalypts PET NDVI b)
14
Figure 5. Daily rainfall, interception calculated using the Gash model and Sc, and NDVI for a) Serra de Cima and b)
Albergaria.
Water balance calculations
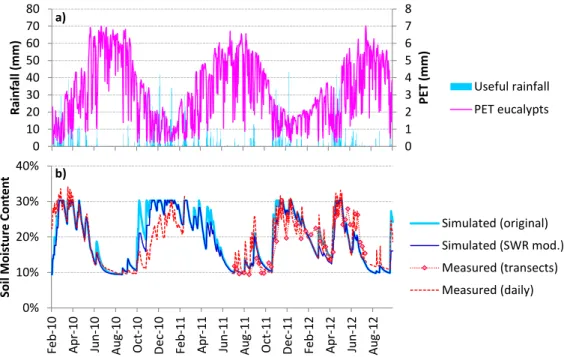
Figure 6 and Figure 7 show meteorological parameters and water balance calculations for respectively the Serra de Cima and Albergaria study sites, while Table 3 shows the model performance (NSE) for both the original and SWR-modified versions of the T-M method. In Serra de Cima, model performance was already acceptable for the original version; hence, the SWR-modified method led to only a small improvement, especially for daily simulations. Improvements were mostly for the start of the wet season at the end of 2010 (Figure 6), where the modified method was able to simulate the slower soil wetting; a larger improvement was not possible without decreasing model performance for the drier part of the dataset (autumn 2011). For the Albergaria sites, however, the SWR-modified method led to marked improvements, leading from clearly unacceptable (negative NSE values; see Nash and Sutcliffe, 1970) to acceptable model performance (NSE ≥ 0.5; Moriasi et al., 2007). This was mostly due to the slower soil wetting which occurred in both study sites (Figure 7), although model performance during the early dry season (spring) of 2006 and 2007 was worse.
0.40 0.50 0.60 0.70 0.80 0.90 0 10 20 30 40 50 60 70 80 90 100 Fe b -10 Ap r-10 Ju n -1 0 Au g-10 Oc t-1 0 D ec -1 0 Fe b -11 Ap r-11 Ju n -1 1 Au g-11 Oc t-1 1 D ec -1 1 Fe b -12 Ap r-12 Ju n -1 2 Au g-12 ND VI Ra in fall (m m) Total rainfall Interception NDVI a) 0.40 0.50 0.60 0.70 0.80 0.90 0 10 20 30 40 50 60 70 80 90 100 Au g-05 Oc t-05 D ec -05 Fe b -06 Ap r-06 Ju n -0 6 Au g-06 Oc t-06 D ec -06 Fe b -07 Ap r-07 Ju n -0 7 Au g-07 ND VI R ai n fa ll (m m ) Total rainfall Interception NDVI b)
15
Figure 6. For the Serra de Cima study site: a) useful rainfall and PET; b) simulated (original and SWR-modified) and measured (in transects and daily) SMC.
Figure 7. For the Albergaria study sites: a) useful rainfall and PET; b) and c) simulated (original and SWR-modified) and measured (in transects and daily) SMC for A1 and A2 sites respectively.
0 1 2 3 4 5 6 7 8 0 10 20 30 40 50 60 70 80 Fe b -10 Ap r-10 Ju n -1 0 A ug -1 0 Oc t-10 D ec -10 Fe b -11 Ap r-11 Ju n -1 1 A ug -1 1 Oc t-11 D ec -11 Fe b -12 Ap r-12 Ju n -1 2 A ug -1 2 PET (m m) R ai n fa ll (m m ) Useful rainfall PET eucalypts a) 0% 10% 20% 30% 40% Feb -10 Ap r-10 Ju n -1 0 Au g-10 Oc t-10 D ec -10 Fe b -11 Ap r-11 Ju n -1 1 Au g-11 Oc t-11 D ec -11 Fe b -12 Ap r-12 Ju n -1 2 Au g-12 Soi l M oi stu re Co n te n t Simulated (original) Simulated (SWR mod.) Measured (transects) Measured (daily) b) 0 1 2 3 4 5 6 7 8 0 10 20 30 40 50 60 70 80 A ug -0 5 Oc t-05 D ec -05 Feb -06 Ap r-06 Ju n -0 6 A ug -0 6 Oc t-06 D ec -06 Fe b -07 Ap r-07 Ju n -0 7 A ug -0 7 PE T (m m) R ai n fa ll (m m ) Useful rainfall PET eucalypts a) 0% 10% 20% 30% 40% Au g-05 Oc t-05 D ec -05 Fe b -06 Ap r-06 Ju n -0 6 Au g-06 Oc t-06 D ec -06 Fe b -07 Ap r-07 Ju n -0 7 Au g-07 Soi l W at er Co n te n t Simulated (original) Simulated (SWR mod.) Measured (transects) b) 0% 10% 20% 30% 40% Au g-05 Oc t-05 D ec -05 Fe b -06 Ap r-06 Ju n -0 6 Au g-06 Oc t-06 D ec -06 Fe b -07 Ap r-07 Ju n -0 7 Au g-07 Soi l M oi stu re Co n te n t Simulated (original) Simulated (SWR mod.) Measured (transects) c)
16
Table 3. Nash-Sutcliffe Efficiency for calculated SMC and SWR using the original and SWR-modified T-M method at all study sites.
Study site Parameter
NSE
Original SWR-modified
Serra de Cima Transect SMC 0.57 0.66 Daily SMC 0.71 0.74 SWR - 0.10 Albergaria A1 Transect SMC -0.55 0.55 SWR - 0.41 Albergaria A2 Transect SMC -0.49 0.65 SWR - 0.46
In contrast, the simulated SWR values were worse, especially for Serra de Cima, but also below the threshold for acceptable performance in Albergaria (Table 3). However, measured SWR values showed a high degree of spatial variability between transect points, especially during transition periods between repellent and non-repellent conditions (see discussion in Keizer et al., 2008, and Santos et al., 2013), as seen in Figure 8. Therefore, SWR patterns might not be fully represented by median SWR, which complicated the evaluation of simulated SWR.
Figure 8. Simulated and measured (median) SWR; shaded bars represent the range between the first and third quartile of measured values.
0 1 2 3 4 5 6 7 8 Fe b -10 Ap r-10 Ju n -1 0 Au g-10 Oc t-10 D ec -10 Fe b -11 Ap r-11 Ju n -1 1 Au g-11 Oc t-11 D ec -11 Fe b -12 Ap r-12 Ju n -1 2 Au g-12 SW R (M ED cl ass) Simulated (SWR mod.) Measured (transects) a) 0 1 2 3 4 5 6 7 8 Au g-05 Oc t-05 D ec -05 Feb -06 Ap r-06 Ju n -0 6 Au g-06 Oc t-06 D ec -06 Fe b -07 Ap r-07 Ju n -0 7 Au g-07 SW R (M ED cl ass) Simulated (SWR mod.) Measured (transects) b) 0 1 2 3 4 5 6 7 8 A u g-05 Oc t-05 D ec -05 Fe b -06 A pr-0 6 Ju n -0 6 A u g-06 Oc t-06 D ec -06 Fe b -07 A pr-0 7 Ju n -0 7 A u g-07 SW R (M ED cl ass) Simulated (SWR mod.) Measured (transects) c)
17
Figure 8 also shows that simulated SWR in Serra de Cima tended not to go under MED class 1 (still considered non-repellent), while in Albergaria it tended not to go above MED class 7 (still considered strongly repellent). However, in Serra de Cima, different parameterizations led to nearly identical SMC simulations (and respective NSE values) with lower SWR values (ranging between MED classes 0 and 6-7) and similar NSE for SWR simulation, but were rejected since the values for SWR_SMmin were below the optimization range defined from observations. If,
however, a wider parameter range is considered, this might represent an instance of equifinality (Beven, 2012).
Calibrated model parameters (Table 4) showed a remarkable consistency when analyzed as a fraction of field capacity and wilting point (according to the soil characteristics shown in Table 2). Parameter AWCmin (soil AWC adjusted for repellent conditions) appeared to be a consistent
fraction of field capacity, between 0.4 and 0.6. The lower SMC thresholds for both SWR and AWC (parameters SMC_WRmin and SMC_lAWCmin) appeared to have a consistent relation with wilting
point, between 0.7 and 0.9 for SWR and between 0.8 and 1 for AWC. The upper SMC threshold for SWR (parameter SMC_WRmax) also appeared as a fraction of field capacity, between 0.7 and
0.9. However, the upper SMC threshold for AWC (parameter SMC_lAWCmax) was less consistent:
it was a smaller fraction of field capacity for Serra de Cima (0.62) than for Albergaria (0.96-0.98). In absolute terms, the values for AWCmin were similar for all three plantations, and the SMC thresholds from repellent to wettable soils concurred with the 20% to 30% interval shown in Figure 2.
Table 4. Calibrated T-M parameters for Serra de Cima (SdC) and Albergaria A1 and A2, expressed in volume and in fractions of Wilting Point and Field Capacity; parameter definitions are in Table 1.
Parameter
SMC (% vol.) SMC (fraction of WP) SMC (fraction of FC)
SdC A1 A2 SdC A1 A2 SdC A1 A2 AWCmin 19.0% 16.8% 18.2% 1.48 1.01 1.01 0.42 0.57 0.53 Repellency thresholds SMC_WRmin 9.6% 15.1% 16.4% 0.75 0.91 0.91 0.21 0.51 0.48 SMC_lAWCmin 10.5% 16.7% 18.2% 0.82 1.00 1.01 0.23 0.57 0.53 Wettable thresholds SMC_WRmax 34.1% 24.5% 28.1% 2.67 1.47 1.56 0.75 0.83 0.82 SMC_lAWCmax 28.2% 28.8% 33.0% 2.21 1.73 1.83 0.62 0.98 0.96
Finally, the SWR modification to the T-M method had impacts in other model results, namely ET and Qo in Equation 1. The limitations on soil wetting led to a decrease of ET, by -12% in Serra de
Cima, and by -54 to -56% in Albergaria. Concurrently, this led to an increase of Qo, by 15% in
Serra de Cima and by 21 to 23% in Albergaria. Given the characteristics of the studied soils such as their high stoniness (leading to preferential flow paths for infiltration) and their relatively impermeable bedrock, most of Qo can be considered as subsurface runoff, rather than surface
runoff or percolation. This decrease of ET and increase in Qo occurred mostly at the start of the
18
Discussion
Model calibration and performance
The calibration process of the SWR-modified T-M method improved model performance in the wet seasons at all plantations, but also decreased model performance during the start of the dry season in Albergaria at the A1 plantation (Figure 7). In fact, the same probably did not happen for Serra de Cima due to the occurrence of only one wet season in the dataset, which allowed for a balance; improving model performance for autumn 2010 led to decreased performance for the dry periods of 2011 and 2012 (see Figure 6). This could be attributed to a hysteretic relation between SWR and AWC, with different modes for wetting and drying, as has been found for repellent soils (Czachor et al., 2010; Davis et al., 2009); in particular, the finding of Czachor et al. (2010) of repellent and non-repellent soils behaving differently only during wetting might indicate why the simulation problems were confined to the dry period of the dataset. Introducing an improved model for the relation between SMC and SWR (e.g. Regalado and Ritter, 2009a, 2009b) could be a step towards addressing this issue. In this work, linear relations were used due to their simplicity, and to the fact that there is little literature regarding the variability of these processes in the study sites, therefore requiring a conservative approach to their simulation.
The high spatial variability of SWR (see Figure 8) limited the evaluation of model performance for this parameter. It is difficult to represent SWR in a site with a single value during transition periods, since SWR often ranges from no/low to strong/extreme intensity without midpoint values (see details in Keizer et al., 2008, and Santos et al., 2013). As discussed earlier, the single SWR value simulated for a site should be understood as an “effective” parameter. Prior knowledge of this issue informed the selection of SMC instead of SWR for optimization. A more complex soil water model might require the simulation of the spatial variability of SWR in some way.
The lower limit on SWR for Serra de Cima (Figure 8) did not affect simulations of SWR persistence nor SMC; it could, however, have been eliminated by relaxing the optimization range for the lower thresholds. This could be due to the poorer quality of the SWR dataset collected in Serra de Cima (see below), which was biased towards high SWR intensity.
Variability between study sites
The three plantations showed remarkable differences in model parameterization and results. Parameterization for the two Albergaria plantations was very similar when considered as fractions of field capacity and wilting point, and when compared with that for Serra de Cima (Table 4). In fact, the parameters for Albergaria A1 provided reasonable simulations for Albergaria A2, and vice-versa. This was not the case for the parameterization for Serra de Cima. Furthermore, the parameterization and results indicated that SWR had a greater impact on soil water balance in Albergaria than in Serra de Cima.
This could indicate actual differences between the two study sites but also differences between the measurements for both. As shown in Table 2, soils in Serra de Cima have markedly higher silt fractions and organic matter contents than soils in Albergaria. While higher organic matter contents could indicate higher SWR in the case of Serra de Cima, higher sand contents could
19
lead to higher SWR in the case of Albergaria (see Doerr et al., 1996; Jiménez-morillo et al., 2014; Mataix-solera et al., 2013; Santos et al., 2013), and therefore further work would be required to assess the impact of these differences in SWR.
As for differences in measurements, both sites showed similar SWR patterns (Figure 8) and SWR-SMC relationships (Figure 2). However, differences in soil texture might influence the results of the MED test (Hamlett et al., 2011), and therefore there might be differences in SWR intensities between sites despite the similar patterns. Furthermore, similar values of SWR intensity measured with the MED test, as done for this work, do not necessarily indicate similar SWR persistence, as discussed earlier (Chau et al., 2014). In similar conditions in central Portugal but for shrublands, Stoof et al. (2011) found that fire enhanced the persistence of SWR. Together, this suggests that despite similar SWR intensity in Serra de Cima and Albergaria, SWR persistence could be higher in the latter due to the effects of the fire. This would explain: (i) why soil wetting in Albergaria after the start of the wet season is slower (compare Figure 7 with Figure 6); (ii) why the model for Albergaria indicates a greater impact of SWR on soil water retention; (iii) why the SWR-modified T-M method produces much larger improvements in Albergaria than in Serra de Cima. Further work is required to assess these differences. It is, however, possible, that the optimization procedure attempted to capture differences in SWR persistence between both sites which were not apparent in the measured data, leading to the different parameterizations shown in Table 4.
Finally, the differences in parameterization – and possibly the differences in SWR persistence – can explain the higher impact of SWR on ET for Albergaria indicated by the simulations. However, the shallower soils should also be taken into account, as the lower absolute AWC would suffer a larger limitation to supply ET demands than in Serra de Cima.
Limitations
This work had some limitations due to the available datasets, which could have influenced the modeling evaluation and remote sensing parameterization.
At Serra de Cima, the dataset of Santos et al. (2013) was compiled during the winter drought of 2011-2012, leading to an unusual decrease of SMC and, possibly, unusually high SWR. Furthermore, the continuous SMC dataset only had one regular wetting season – that of autumn 2010 – which is the period where the impacts of SWR on initial wetting were most noted (Figure 6). Including additional continuous SMC data for years with normal rainfall, and perhaps also a SWR dataset for a normal rainfall year, would possibly lead to a larger differentiation between the original and SWR-modified T-M method.
Furthermore, the Serra de Cima dataset only sampled the top third of the soil, which might have over-represented ET and under-represented SMC and SWR. This is particularly important given the trend of decreasing SWR with depth found by Santos et al. (2013). Therefore, the data might have misrepresented SMC and SWR with consequences for the calibration of the T-M method. This dataset also limited the remote sensing approach for the crop coefficient Kc, especially due
to the estimation of ET using soil moisture from the top third of the profile, and using only data from the unburned site. Furthermore, the very limited LAI data prevented an in-depth
20
assessment of NDVI-LAI relations, and exploring more detailed approaches for interception modeling (see Cui and Jia, 2014).
In Albergaria, the dataset was more representative of soil depth and meteorology. However, the fact that there were no continuous soil moisture measurements might also have impacted the results, since the unmodified T-M method performed better for continuous than transect measurements at Serra de Cima (Table 2); in fact, model optimization for continuous measurements led to different results that that for transect measurements.
Finally, additional NDVI data from the MODIS Aqua could have been combined with the Terra dataset to improve the temporal resolution to 8-day, although the use of a temporal smoothing algorithm would necessarily limit the improvements gained by an increase in temporal resolution.
Overall, additional data on LAI and continuous soil moisture measurements, especially for burned areas, might lead to an improved calibration and assessment of the SWR-modified T-M method. Nevertheless, the existing dataset can be considered sufficient to demonstrate the applicability of the T-M modification and the usefulness of satellite imagery for this region.
Integrating SWR in existing water balance models
The results from this work show that the SWR-adapted T-M method can improve the simulation of soil moisture in water repellent soils by adding a reasonable, if simplified, simulation of the processes relating SWR with SMC. Several factors point to this:
• the optimization of SMC occurred mostly in periods where SWR was present (compare Figure 6 and Figure 7 with Figure 8);
• in the Albergaria A1 and A2 sites, the parameters led to an adequate simulation of both SMC and SWR;
• the range of most parameters could be deducted from field observations;
• the optimized parameters were consistent between sites when considering the soil water retention curves for each soil;
• parameters optimized for Albergaria A1 were usable in A2 and vice-versa, indicating that they were not fitted to a single dataset.
This SWR adaptation can be used as a template for adapting other simple soil water balance models for regions with soil water repellency, probably requiring a daily time-step approach to account for relatively fast changes in SWR (Figure 8). While the presented model appears to be simple enough to be generalized, further testing with different data would be required.
One challenge would be to establish methods to parameterize the model application for different soils. The results of this work indicate that soil water retention properties would help parameterize the model (Table 4). Work by other authors linking the relation between soil moisture and repellency to the water retention curve (Diamantopoulos et al., 2013; Kajiura et al., 2012) and specifically to the field capacity and wilting point (Deurer and Bachmann, 2007; Regalado et al., 2008) point this as a promising approach. Another challenge would be to link parameterization with both the intensity and persistence of SWR. This would also require the exploration of more datasets.
21
Finally, the present method generalizes outflow, but there is a specific interest in the impact of SWR on surface runoff due to the subsequent impacts on soil erosion, particularly for recently burned forests (Malvar et al., 2013, 2011; Prats et al., 2013, 2012; Vieira et al., 2014). Further work should focus on linking SMC or SWR with surface runoff generation, for which existing datasets for the same study sites can be used.
Conclusions
This work demonstrated that a simplified approach for water balance calculations could be adapted for soil water repellent conditions, by limiting soil wetting in repellent conditions. The adapted method was assessed using field measurements for one unburned and two recently burned eucalypt plantations. The results indicated that the burned and unburned areas required different parameterizations, possibly due to both differences in soil properties and the impacts of fire on repellency itself. The modified method led to important improvements to soil water content simulation at the burned sites, and modest improvements at the unburned site. Model parameters were related with points in the soil water retention curve, indicating a potential approach for parameter estimation in different sites. The method presented herein appears capable of being incorporated in more complex eco-hydrological models with simple approaches to soil water balance.
Acknowledgements
This work was funded by the European Regional Development Fund (through Programa Operacional Factores de Competitividade – COMPETE), the European Social Fund (through Programa Operacional Potencial Humano – POPH) and the Portuguese Republic (through FCT – Fundação para a Ciência e Tecnologia), taking advantage of data collected and analyzed within the framework of several projects: EROSFIRE (POCTI/AGR/60354/2004), EROSFIRE2 (PTDC/AGR-CFL/70968/2006), HIDRIA FEDER-009308) and ERLAND (FCOMP-01-0124-FEDER-008534), as well as profiting from work done in the context of the doctoral and post-doctoral fellowships attributed to J.P. Nunes (SFRH/BPD/39721/2007 and SFRH/BPD/87571/2012), M.E. Rial-Rivas (SFRH/BPD/64425/2009), and M. Malvar (SFRH/BD/41320/2007 and SFRH/BPD/97977/2013).
References
Allen, R.G., Pereira, L.S., Raes, D., Smith, M., 1998. Crop evapotranspiration: guidelines for computing crop requirements. United Nations Food and Agriculture Organization (FAO), Rome.
Bachmann, J., Deurer, M., Arye, G., 2007. Modeling water movement in heterogeneous water-repellent soil: 1. Development of a contact angle-dependent water-retention model. Vadose Zo. J. 6, 436–445. doi:10.2136/vzj2006.0060
Baret, F., Guyot, G., 1991. Potentials and limits of vegetation indices for LAI and APAR assessment. Remote Sens. Environ. 35, 161–173. doi:10.1016/0034-4257(91)90009-U
22
Beatty, S.M., Smith, J.E., 2013. Dynamic soil water repellency and infiltration in post-wild fire soils. Geoderma 192, 160–172. doi:10.1016/j.geoderma.2012.08.012
Beven, K.J., 2012. Rainfall-Runoff Modelling: The Primer, 2nd ed. Wiley-Blackwell, Hoboken. Blanco-Canqui, H., Lal, R., 2009. Extent of soil water repellency under long-term no-till soils.
Geoderma 149, 171–180. doi:10.1016/j.geoderma.2008.11.036
Bodí, M.B., Martin, D.A., Balfour, V.N., Santín, C., Doerr, S.H., Pereira, P., Cerdà, A., Mataix-Solera, J., 2014. Wildland fire ash: Production, composition and eco-hydro-geomorphic effects. Earth-Science Rev. 130, 103–127. doi:10.1016/j.earscirev.2013.12.007
Bodí, M.B., Muñoz-Santa, I., Armero, C., Doerr, S.H., Mataix-Solera, J., Cerdà, A., 2013. Spatial and temporal variations of water repellency and probability of its occurrence in
calcareous Mediterranean rangeland soils affected by fires. Catena 108, 14–25. doi:10.1016/j.catena.2012.04.002
Brevik, E.C., Cerdà, a., Mataix-Solera, J., Pereg, L., Quinton, J.N., Six, J., Van Oost, K., 2015. The interdisciplinary nature of SOIL. Soil 1, 117–129. doi:10.5194/soil-1-117-2015
Campos, I., Neale, C.M.U., Calera, A., Balbontín, C., González-piqueras, J., 2010. Assessing satellite-based basal crop coefficients for irrigated grapes (Vitis vinifera L.). Agric. Water Manag. 98, 45–54. doi:10.1016/j.agwat.2010.07.011
Carlson, T.N., Ripley, D.A., 1997. On the Relation between NDVI , Fractional Vegetation Cover , and Leaf Area Index. Remote Sens. Environ. 62, 241–252.
doi:10.1016/S0034-4257(97)00104-1
Cerdà, A., Doerr, S.H., 2007. Soil wettability, runoff and erodibility of major dry-Mediterranean land use types on calcareous soils. Hydrol. Process. 21, 2325–2336. doi:10.1002/hyp.6755 Cerdà, A., Doerr, S.H., 2005. Influence of vegetation recovery on soil hydrology and erodibility
following fire: an 11-year investigation. Int. J. Wildl. Fire 14, 423–437. doi:10.1071/WF05044
Chau, H.W., Biswas, A., Vujanovic, V., Si, B.C., 2014. Relationship between the severity, persistence of soil water repellency and the critical soil water content in water repellent soils. Geoderma 221-222, 113–120. doi:10.1016/j.geoderma.2013.12.025
Cui, Y., Jia, L., 2014. A Modified Gash Model for Estimating Rainfall Interception Loss of Forest Using Remote Sensing Observations at Regional Scale. Water 6, 993–1012.
doi:10.3390/w6040993
Czachor, H., Doerr, S.H., Lichner, L., 2010. Water retention of repellent and subcritical repellent soils : New insights from model and experimental investigations. J. Hydrol. 380, 104–111. doi:10.1016/j.jhydrol.2009.10.027
David, T.S., Ferreira, M.I., David, J.S., Pereira, J.S., 1997. Transpiration from a mature Eucalyptus globulus plantation in Portugal during a spring-summer period of
23
Davis, D.D., Horton, R., Heitman, J.L., Ren, T., 2009. Wettability and Hysteresis Effects on Water Sorption in Relatively Dry Soil. Soil Sci. Soc. Am. J. 73, 1947–1951.
doi:10.2136/sssaj2009.00028N
De Coninck, H., 2003. Modelling interception of Eucalyptus globulus and Pinus pinaster stands in Central Portugal. Wageningen University of Research.
DeBano, L.., 2000. The role of fire and soil heating on water repellency in wildland
environments: a review. J. Hydrol. 231-232, 195–206. doi:10.1016/S0022-1694(00)00194-3
Dekker, L.W., Doerr, S.H., Oostindie, K., Ziogas, A.K., Ritsema, C.J., 2001. Water Repellency and Critical Soil Water Content in a Dune Sand. Soil Sci. Soc. Am. J. 65, 1667–1674.
doi:10.2136/sssaj2001.1667
Deurer, M., Bachmann, J., 2007. Modeling water movement in heterogeneous water-repellent soil: 2. A conceptual numerical simulation. Vadose Zo. J. 6, 446–457.
doi:10.2136/vzj2006.0061
Diamantopoulos, E., Durner, W., Reszkowska, a., Bachmann, J., 2013. Effect of soil water repellency on soil hydraulic properties estimated under dynamic conditions. J. Hydrol. 486, 175–186. doi:10.1016/j.jhydrol.2013.01.020
Doerr, S., Shakesby, R., Walsh, R., 1996. Soil hydrophobicity variations with depth and particle size fraction in burned and unburned Eucalyptus globulus and Pinus pinaster forest terrain in the Águeda basin, Portugal. Catena 27, 25–47.
doi:10.1016/0341-8162(96)00007-0
Doerr, S.H., Ferreira, A.J.D., Walsh, R.P.D., Shakesby, R.A., Coelho, C.O.A., 2003. Soil water repellency as a potential parameter in rainfall-runoff modelling : experimental evidence at point to catchment scales from Portugal. Hydrol. Process. 17, 363–377.
doi:10.1002/hyp.1129
Doerr, S.H., Shakesby, R.A., Blake, W.H., Chafer, C.J., Humphreys, G.S., Wallbrink, P.J., 2006. Effects of differing wildfire severities on soil wettability and implications for hydrological response. J. Hydrol. 319, 295–311. doi:10.1016/j.jhydrol.2005.06.038
Doerr, S.H., Shakesby, R.A., MacDonald, L.H., 2009. Soil water repellency: A key factor in post-fire erosion, in: Cerdà, A., Robichaud, P.R. (Eds.), Fire Effects on Soils and Restoration Strategies. Science Publishers, Inc., Enfield, pp. 197– 224.
Doerr, S.H., Shakesby, R.A., Walsh, R.P.D., 2000. Soil water repellency: its causes,
characteristics and hydro-geomorphological significance. Earth-Science Rev. 51, 33–65. doi:10.1016/S0012-8252(00)00011-8
Duchemin, B., Hadria, R., Erraki, S., Boulet, G., Maisongrande, P., Chehbouni, A., Escadafal, R., Ezzahar, J., Hoedjes, J.C.B., Kharrou, M.H., Khabba, S., Mougenot, B., Olioso, A.,
Rodriguez, J.C., Simonneaux, V., 2006. Monitoring wheat phenology and irrigation in Central Morocco: On the use of relationships between evapotranspiration, crops
coefficients, leaf area index and remotely-sensed vegetation indices. Agric. Water Manag. 79, 1–27. doi:http://dx.doi.org/10.1016/j.agwat.2005.02.013
24
Esteves, T.C.J., Kirkby, M.J., Shakesby, R.A., Ferreira, A.J.D., Soares, J.A.A., Irvine, B.J., Ferreira, C.S.S., Coelho, C.O.A., Bento, C.P.M., Carreiras, M.A., 2012. Mitigating land degradation caused by wild fire : Application of the PESERA model to fire-affected sites in central Portugal. Geoderma 191, 40–50. doi:10.1016/j.geoderma.2012.01.001
Ferreira, A.J.D., 1996. Processos hidrologicos e hidroquimicos em povoamentos de Eucalyptus globulul Labill. e Pinus pinaster Aiton. University of Aveiro.
Ferreira, A.J.D., Coelho, C.O.A., Boulet, A.K., Leighton-Boyce, G., Keizer, J.J., Ritsema, C.J., 2004. Influence of burning intensity on water repellency and hydrological processes at forest and shrub sites in Portugal. Soil Res. 43, 327–336. doi:10.1071/SR04084
Ferreira, A.J.D., Coelho, C.O.A., Ritsema, C.J., Boulet, A.K., Keizer, J.J., 2008. Soil and water degradation processes in burned areas: lessons learned from a nested approach. Catena 74, 273–285. doi:10.1016/j.catena.2008.05.007
Gabarrón-Galeote, M.A., Martínez-Murillo, J.F., Quesada, M.A., Ruiz-Sinoga, J.D., 2013. Seasonal changes in the soil hydrological and erosive response depending on aspect, vegetation type and soil water repellency in different mediterranean microenvironments. Solid Earth 4, 497–509. doi:10.5194/se-4-497-2013
Ganz, C., Bachmann, J., Noell, U., Duijnisveld, W.H.M., Lamparter, A., 2014. Hydraulic Modeling and in situ Electrical Resistivity Tomography to Analyze Ponded Infiltration into a Water Repellent Sand. Vadose Zo. J. 13. doi:10.2136/vzj2013.04.0074
Gash, J., Lloyd, C., Lachaud, G., 1995. Estimating sparse forest rainfall interception with an analytical model. J. Hydrol. 170, 79–86. doi:10.1016/0022-1694(95)02697-N
González-Peñaloza, F. a., Cerdà, A., Zavala, L.M., Jordán, A., Giménez-Morera, A., Arcenegui, V., 2012. Do conservative agriculture practices increase soil water repellency? A case study in citrus-cropped soils. Soil Tillage Res. 124, 233–239. doi:10.1016/j.still.2012.06.015 Granged, A.J.P., Jordán, A., Zavala, L.M., Bárcenas, G., 2011. Fire-induced changes in soil water
repellency increased fingered flow and runoff rates following the 2004 Huelva wildfire. Hydrol. Process. 25, 1614–1629. doi:10.1002/hyp.7923
Gu, J., Li, X., Huang, C., Okin, G.S., 2009. A simplified data assimilation method for reconstructing time-series MODIS NDVI data. Adv. Sp. Res. 44, 501–509. doi:10.1016/j.asr.2009.05.009
Hamlett, C.A.E., Shirtcli, N.J., Mchale, G., Ahn, S., Bryant, R., Doerr, S.H., Newton, M.I., 2011. Effect of Particle Size on Droplet Infiltration into Hydrophobic Porous Media As a Model of Water Repellent Soil. Environ. Sci. Technol. 45, 9666–9670.
doi:dx.doi.org/10.1021/es202319a
Hedo, J., Lucas-Borja, M.E., Wic, C., Andrés-Abellán, M., de Las Heras, J., 2015. Soil
microbiological properties and enzymatic activities of long-term post-fire recovery in dry and semiarid Aleppo pine (Pinus halepensis M.) forest stands. Solid Earth 6, 243–252. doi:10.5194/se-6-243-2015
25
Hewelke, E., Gnatowski, T., Oleszczuk, R., 2014. Effects of soil water repellency on moisture patterns in a degraded sapric histosol. L. Degrad. Dev. doi:10.1002/ldr.2305
Huete, A., Justice, C., van Leeuwen, W., 1999. MODIS vegetation index (MOD13). Algorithm theoretical basis document. University of Arizona, Tucson.
ICNF, 2013. IFN6 – Áreas dos usos do solo e das espécies florestais de Portugal continental. Resultados preliminares. Instituto da Conservação da Natureza e das Florestas, Lisbon. IUSS Working Group WRB, 2014. World Reference Base for Soil Resources 2014. International
soil classification system for naming soils and creating legends for soil maps (No. 106). Food and Agriculture Organization of the United Nations, Rome.
Jiménez-morillo, N.T., González-pérez, J.A., Jordán, A., Zavala, L.M., María, J., Rosa, D.,
Jiménez-gonzález, M.A., González-vila, F.J., 2014. Organic matter fractions controlling soil water repellency in sandy soils from the Doñana national park (southwestern Spain). L. Degrad. Dev. doi:10.1002/ldr.2314
Kajiura, M., Etori, Y., Tange, T., 2012. Water condition control of in situ soil water repellency: an observational study from a hillslope in a Japanese humid-temperate forest. Hydrol. Process. 26, 3070–3078. doi:10.1002/hyp.8310
Karunarathna, A.K., Moldrup, P., Kawamoto, K., de Jonge, L.W., Komatsu, T., 2010. Two-Region Model for Soil Water Repellency as a Function of Matric Potential and Water Content. Vadose Zo. J. 9, 719–730. doi:10.2136/vzj2009.0124
Keesstra, S.D., Maroulis, J., Argaman, E., Voogt, A., Wittenberg, L., 2014. Effects of controlled fire on hydrology and erosion under simulated rainfall. Cuad. Investig. Geográfica 40, 269–293. doi:10.18172/cig.2532
Keizer, J.J., Coelho, C.O.A., Shakesby, R.A., Domingues, C.S.P., Malvar, M.C., Perez, I.M.B., Matias, M.J.S., Ferreira, A.J.D., 2005a. The role of soil water repellency in overland flow generation in pine and eucalypt forest stands in coastal Portugal. Soil Res. 43, 337–349. doi:10.1071/SR04085
Keizer, J.J., Doerr, S.H., Malvar, M.C., Prats, S.A., Ferreira, R.S.V., Oñate, M.G., Coelho, C.O.A., Ferreira, A.J.D., 2008. Temporal variation in topsoil water repellency in two recently burnt eucalypt stands in north-central Portugal. Catena 74, 192–204.
doi:10.1016/j.catena.2008.01.004
Keizer, J.J., Ferreira, A.J.D., Coelho, C.O.A., Doerr, S.H., Malvar, M.C., Domingues, C.S.P., Perez, I.M.B., Ruiz, C., Ferrari, K., 2005b. The role of tree stem proximity in the spatial variability of soil water repellency in a eucalypt plantation in coastal Portugal. Soil Res. 43, 251–259. doi:10.1071/SR04096
King, P.M., 1981. Comparison of methods for measuring severity of water repellence of sandy soils and assessment of some factors that affect its measurement. Aust. J. Soil Res. 19, 275–285. doi:10.1071/SR9810275
Kramers, G., van Dam, J., Ritsema, C., Stagnitti, F., Oostindie, K., Dekker, L., 2005. A new modelling approach to simulate preferential flow and transport in water repellent porous
26
media: Parameter sensitivity, and effects on crop growth and solute leaching. Aust. J. Soil Res. 43, 371–382. doi:10.1071/SR04098
Lasdon, L.S., Waren, A.D., Jain, A., Ratner, M., 1978. Design and Testing of a Generalized Reduced Gradient Code for Nonlinear Programming. ACM Trans. Math. Softw. 4, 34–50. doi:10.1145/355769.355773
Leighton-Boyce, G., Doerr, S.H., Shakesby, R.A., Walsh, R.P.D., 2007. Quantifying the impact of soil water repellency on overland flow generation and erosion: a new approach using rainfall simulation and wetting agent on in situ soil. Hydrol. Process. 21, 2337–2345. doi:10.1002/hyp.6744
Leighton-Boyce, G., Doerr, S.H., Shakesby, R.A., Walsh, R.P.D., Ferreira, A.J.D., Boulet, A.-K., Coelho, C.O.A., 2005. Temporal dynamics of water repellency and soil moisture in eucalypt plantations, Portugal. Aust. J. Soil Res. 43, 269. doi:10.1071/SR04082
Malvar, M.C., Martins, M.A.S., Nunes, J.P., Robichaud, P.R., Keizer, J.J., 2013. Assessing the role of pre-fire ground preparation operations and soil water repellency in post-fire runoff and inter-rill erosion by repeated rainfall simulation experiments in Portuguese eucalypt plantations. Catena 108, 69–83. doi:10.1016/j.catena.2012.11.004
Malvar, M.C., Prats, S.A., Nunes, J.P., Keizer, J.J., 2011. Post-fire overland flow generation and inter-rill erosion under simulated rainfall in two eucalypt stands in north-central Portugal. Environ. Res. 111, 222–36. doi:10.1016/j.envres.2010.09.003
Mataix-solera, J., Arcenegui, V., Tessler, N., Zornoza, R., Wittenberg, L., Martínez, C., Caselles, P., Pérez-bejarano, A., Malkinson, D., Jordán, M.M., 2013. Soil properties as key factors controlling water repellency in fi re-affected areas: Evidences from burned sites in Spain and Israel. Catena 108, 6–13. doi:10.1016/j.catena.2011.12.006
Moody, J.A., Ebel, B.A., 2014. Infiltration and runoff generation processes in fire-affected soils. Hydrol. Process. 28, 3432–3453. doi:10.1002/hyp.9857
Moody, J.A., Kinner, D.A., Úbeda, X., 2009. Linking hydraulic properties of fire-affected soils to infiltration and water repellency. J. Hydrol. 379, 291–303.
doi:10.1016/j.jhydrol.2009.10.015
Moreira, F., Rego, F.C., Ferreira, P.G., 2001. Temporal (1958-1995) pattern of change in a cultural landscape of northwestern Portugal : implications for fire occurrence. Landsc. Ecol. 16, 557–567. doi:10.1023/A:1013130528470
Moriasi, D.N., Arnold, J.G., Van Liew, M.W., Bingner, R.L., Harmel, R.D., Veith, T.L., 2007. Model evaluation guidelines for systematic quantification of accuracy in watershed simulations. Trans. ASABE 50, 885–900. doi:10.13031/2013.23153
Nash, J.E., Sutcliffe, J. V, 1970. River flow forecasting through conceptual models. Part 1: discussion of principles. J. Hydrolology 10, 282–290. doi:10.1016/0022-1694(70)90255-6 Nyman, P., Sheridan, G.J., Smith, H.G., Lane, P.N.J., 2014. Modeling the effects of surface
storage, macropore flow and water repellency on infiltration after wildfire. J. Hydrol. 513, 301–313. doi:10.1016/j.jhydrol.2014.02.044