Universidade de Lisboa
Faculdade de Ciências
Departamento de Informática
Transcriptomic analysis of maritime pine response to
infection with Bursaphelenchus xylophilus, the
causing agent of pine wilt disease
Mestrado em Bioinformática e Biologia Computacional
Especialização em Bioinformática
Dissertação orientada por:
António Marcos Costa do Amaral Ramos
Cátia Luísa Santana Calisto Pesquita
Daniel Filipe Branco Gaspar
Universidade de Lisboa
Faculdade de Ciências
Departamento de Informática
Transcriptomic analysis of maritime pine response to
infection with Bursaphelenchus xylophilus, the causing
agent of pine wilt disease
Mestrado em Bioinformática e Biologia Computacional
Especialização em Bioinformática
Daniel Filipe Branco Gaspar
Dissertação orientada por:
António Marcos Costa do Amaral Ramos
Cátia Luísa Santana Calisto Pesquita
i “A ciência serve para nos dar uma ideia de quão extensa é a nossa ignorância”
iii
ACKNOWLEGMENTS
Esta dissertação é o culminar de mais uma etapa de apredizagem e crescimento a nível pessoal e profissional. Embora, pela sua finalidade académica, uma dissertação seja um trabalho individual, há contributos que devem ser realçados. Nesse sentido, desejo expressar o meu sincero reconhecimento e gratidão pela inestimável ajuda:
Ao meu orientador, Doutor António Marcos Ramos, pela oportunidade que me concedeu, pelo apoio diário, pelos conselhos e rigor científico das orientações, indispensáveis na realização deste trabalho, e em especial pela amizade e confiança.
À minha orientadora, Doutora Cátia Pesquita, pela disponibilidade permanente, pelo acompanhamento e interesse demonstrado nas várias etapas deste trabalho. As suas sugestões e partilha de conhecimento foram indispensáveis.
À Doutora Anabel Chimenos, pela disponibilidade e apoio prestado em todas as tarefas realizadas, pela indispensável partilha de conhecimentos. Acima de tudo, pela amizade e convivência.
Aos Mestres Brígida Meireles e Pedro Barbosa, por toda a ajuda, pela integração e convivência no CEBAL, amizade e companheirismo.
A todas as pessoas do CEBAL que de alguma forma me ajudaram.
Por último, mas nunca em último, aos meus Pais e à minha Avó. Porque mesmo quando a distância nos separa, não me deixam caminhar sozinho.
v
RESUMO
A bioinformática é uma área mutidisciplinar que envolve a aplicação de técnicas computacionais para analisar informação biológica em larga escala. Este conjunto de ferramentas e técnicas computacionais foi desenvolvido para dar suporte à análise da crescente quantidade de dados gerados neste domínio, e em particular por técnicas de next-generation sequencing. Uma das áreas da biologia largamente dependente das ferramentas bioinformáticas é a análise do perfil do transcriptoma. Atualmente, a técnica de RNA-sequencing tem sido a abordagem predominante em estudos transcriptómicos de dados de sequenciação. Esta técnica tem sido bastante usada em estudos de resistência, especialmente em espécies florestais ameaçadas.
A Floresta é um recurso natural essencial em termos globais, não apenas pela sua importância a nível ecológico, mas também a nível económico e paisagístico. Ela representa um suporte de Vida na Terra, fornecendo inúmeros benefícios fundamentais para o equilibrio de diversos ecossistemas. No entanto, recentemente tem vindo a verificar-se um preocupante declínio de várias espécies florestais, sendo o Pinheiro Bravo (Pinus pinaster Ait.) uma das mais afectadas. Este declínio tem causado um impacto negativo no equilibrio dos ecossistemas e na manutenção da biodiversidade. Um dos organismos com maior potencial destrutivo para a área florestal de Pinheiro Bravo é o nemátodo da madeira do pinheiro (Bursaphelenchus xylophilus), um verme microscópico responsável pela doença da murchidão do pinheiro. Numa tentativa de reduzir as perdas resultantes da doença, surgiram vários estudos de resistência do hospedeiro para a identificação de árvores com menor susceptibilidade à infecção. No entanto, parte desses estudos apresenta uma abordagem mais tradicional, sem recurso às novas tecnologias de sequenciação. Nesse sentido, o presente trabalho, baseado no estudo de dados de RNA-sequencing produzidos pela plataforma de sequenciação Ion Proton, tem como principal objectivo a caracterização da resposta do Pinheiro Bravo à infecção com o nemátodo da madeira do pinheiro entre três diferentes estágios após inoculação. Para isso, foram
vi identificados genes diferencialmente expressos, vias metabólicas e marcadores
moleculares potencialmente associados à resistência à doença.
Um total de 355,287 unigenes foram obtidos a partir de um conjunto de 176,282,168 reads sequenciadas para todas as bibliotecas, pela técnica de de novo assembly. A baixa percentagem de genes predictos (23.5%) a partir do conjunto de unigenes assemblados e o elevado número de genes sem anotação ou com anotação desconhecida, evidenciam as limitações existentes num estudo de RNA-Seq em espécies não-modelo, sem o genoma sequenciado, como é o caso do Pinheiro Bravo. Apesar disso, foram obtidos 17,533 genes diferencialmente expressos entre todas as comparações. No seguimento desta análise, há a evidência de duas fases de resposta à infecção. Em primeiro lugar, é desencadeada uma resposta imediata, logo após a infecção. Posteriormente, uma segunda fase de resposta parece acontecer aos 7 dias após a infecção. Foi ainda identificado um conjunto de genes candidatos envolvidos na resistência à doença nos vários estágios em estudo. Desse conjunto, é possível identificar genes envolvidos no metabolismo secundário, stress oxidativo e defesa contra infeção de agentes patogénicos. Este estudo representa uma nova abordagem ao nivel dos mecanismos moleculares e vias metabólicas envolvidas na defesa contra a infeção do nemátodo da madeira do pinheiro. Podendo assim ser um recurso útil para estudos ulteriores e também para programas de melhoramento com vista à seleção de plantas com menos susceptibilidade à doença.
Palavras-chave: Bioinformática; Next-generation sequencing; RNA-Sequencing; Pinus pinaster; Bursaphelenchus xylophilus; doença da murchidão do pinheiro.
vii
ABSTRACT
Bioinformatics is a multidisciplinary field that involves the application of computational tools to analyze biological information on a large-scale. This set of computational techniques were developed to support the analysis of the increasing amount of data generated in this area, and in particular by next-generation sequencing (NGS). One of the main fields of biology that is largely dependent on bioinformatics tools is the transcriptome profile analysis. Currently, RNA-Sequencing (RNA-Seq) is the dominant transcriptomics approach for NGS data. RNA-Seq has been highly used in disease pathogenesis studies, especially in endangered forest species.
Forests are essential resources on a global scale, not only for the ecological benefits, but also for economical and landscape purposes. They represent one of the Life support systems on Earth, providing essential resources for a range of ecosystems. However, in recent years there has been a worrying decline of a large number of forest species around the world, with maritime pine (Pinus pinaster Ait.) being one of the most affected. This alarming decay is caused by abiotic and biotic factors. Within this last group of factors we must highlight the pine wood nematode (PWN), Bursaphelenchus xylophilus as one of the main responsible. PWN is a microscopic organism reported for the first time in Portugal in 1999, being the causal agent of pine wilt disease (PWD). In an attempt to reduce losses arising by PWD, the study of maritime pine resistance is one of the research programs that recently started in Portugal, aiming to improve their resistance and select trees with lower susceptibility to infection. However, just a few of these studies were based on next-generation sequencing data. Taking this into account, this study is an approach to pine wilt disease, using RNA-Sequencing data produced by Ion Proton platform. The aims of this study was to analyze RNA-Seq data to characterize the maritime pine transcriptome in the response to infection with Bursaphelenchus xylophilus, over three different time stages after inoculation of the PWN, by determining the differentially expressed genes,
viii regulatory networks and pathways, with the purpose of identifying potential genes
involved in resistance against PWD.
A total of 355,287 unigenes were obtained by de novo assembly from the 176,282,168 sequenced reads for all libraries. Moreover, we obtained 17,533 differentially expressed genes (up and down regulated) between all comparatives. The low rate of predicted genes (23.5%) from the set of assembled contigs and the high number of genes without annotation or with "Unknown" annotation, evidences the existing limitations when working in RNA-Seq studies with non-model species like Pinus pinaster. Despite this, further analysis suggest an early response that may occur immediately after inoculation and a late response that may occur 7 days after inoculation.
A set of candidate genes involved in resistance against PWN infection were identified over different time points. These genes were related to secondary metabolism, oxidative stress and defense against pathogen infection. Our results provide new insights about the molecular mechanism and metabolic pathways involved in resistance of Pinus pinaster against PWN infection. It may be a useful resource in future studies and for future breeding programs to select plants with lower susceptibility to PWD.
Keywords: Bioinformatics; Next-generation sequencing; RNA-Sequencing; Pinus pinaster; Bursaphelenchus xylophilus; Pine wilt disease.
ix
TABLE OF CONTENTS
ACKNOWLEGMENTS ... iii RESUMO ... v ABSTRACT ... vii LIST OF TABLES ... xiLIST OF FIGURES ... xiii
ABBREVIATIONS ... xv
1. - INTRODUCTION ... 1
1.1 – Motivation ... 1
1.2 – Objectives ... 2
1.3 – Maritime Pine and Pine wilt disease ... 3
1.4 - Next-generation sequencing ... 5
1.4.1 - RNA-Sequencing ... 7
1.5 - Bioinformatics tools for RNA-Seq data analysis ... 9
1.5.1 - Pre-processing data tools ... 9
1.5.2 - De novo assembly tools ... 10
1.5.3 - Mapping tools ... 11
1.5.4 - Differential expression for RNA-Seq data analysis ... 11
1.5.4.1 - EdgeR ... 12
1.5.4.2 - Prediction of candidate coding regions (TransDecoder) ... 12
1.5.5 - Transcriptome annotation ... 13
1.6 - SNP calling ... 14
2. - MATERIAL AND METHODS ... 17
2.1 - Pre-processing RNA-Sequencing data and assembly ... 17
2.2 - Prediction of candidate coding regions ... 18
2.3 - Mapping and differential expression analysis ... 18
2.4 - Transcriptome annotation ... 19
x
3. - RESULTS ... 21
3.1 - Pre-processing of RNA-sequencing data and assembly ... 21
3.2 - Mapping and differential expression analysis ... 23
3.3 - Transcriptome annotation ... 25 3.4 - SNP calling analysis ... 31 4. - DISCUSSION ... 33 5. - CONCLUSIONS ... 41 6. - REFERENCES ... 43 7. - APPENDIX ... 53
7.1 - Biological Material, pine wood nematode inoculation and sampling ... 53
7.2 - RNA extraction, cDNA synthesis, library preparation and sequencing ... 54
xi
LIST OF TABLES
Table 1 - Number of sequenced reads and its average read length for each library. Number
and percentage of processed reads after control quality. ... 22
Table 2: Key results from QUAST software ... 22 Table 3: Number of mapped reads, unique mapped reads and their percentages for each
library ... 23
Table 4: Total number of differentially expressed tests (up and down) between each
comparison ... 24
Table 5: Number of differentially expressed genes (up and down) uniquely for each
comparison ... 24
Table 6 – Summary of most representative KEGG pathways detected in predicted genes
and in DEG ... 30
Table 7 - SNP calling analysis. Number and percentage of effects by region ... 31 Table 8 - SNP calling analysis. Number and percentage of effects by functional class .... 31 Table 9 - SNP calling analysis. Number and percentage of effects by type ... 32
xiii
LIST OF FIGURES
Figure 1 - Representation of workflow applied in this study. ... 2 Figure 2 - Example of RNA-Seq data analysis workflow ... 8 Figure 3 - Gene ontology analysis of RNA-Seq data. Distribution of biological process
subcategories for all predicted genes ... 26
Figure 4 - Gene ontology analysis of RNA-Seq data. Distribution of cellular component
subcategories for all predicted genes ... 27
Figure 5 - Gene ontology analysis of RNA-Seq data. Distribution of molecular function
subcategories for all predicted genes ... 27
Figure 6 - Gene ontology analysis of RNA-Seq data. Distribution of biological process
subcategories in DEG ... 28
Figure 7 - Gene ontology analysis of RNA-Seq data. Distribution of cellular component
subcategories in DEG ... 28
Figure 8 - Gene ontology analysis of RNA-Seq data. Distribution of molecular function
subcategories in DEG ... 29
xv
ABBREVIATIONS
BAM Binary Alignment Map
BLAST Basic Local Alignment Search Tool
BP Biological Process
CC Cellular Component
cDNA Complementary Deoxyribonucleic Acid
DEG Differentially Expressed Genes
FDR False Discovery Rate
GO Gene Ontology
KEGG Kyoto Encyclopedia of Genes and Genomes
MF Molecular Function
MR Mapped Reads
mRNA Messenger Ribonucleic Acid
NGS Next-Generation Sequencing
ORF Open Reading Frame
PCR Polymerase Chain Reaction
PDA Potato Dextrose Medium
PP Pinus pinaster PWD Pine Wood Disease
PWN Pine Wood Nematode
QC Quality Control
RNA Ribonucleic Acid
SAM Sequence Alignment Map
SNP Single Nuclear Polymorphism
1
1. - INTRODUCTION
Maritime pine (Pinus pinaster Ait) is one of the main forest species in southwestern Europe, having a high economic impact due to the value of the wood and resin. However, recently a serious decline of maritime pine populations has been observed, with pine wood nematode (Bursaphelenchus xylophilus) being one of the main agents responsible for the decline. Over the last years, some studies in this area were executed using different approaches. However, just a few of these studies were based on next-generation sequencing (NGS) data. This study is an approach to study pine wilt disease (PWD), using RNA-Seq data produced by the Ion Proton platform. RNA-Seq is largely used in resistance studies, being especially useful to characterize transcriptome profile over different time points. This technique involves a set of steps to process NGS data, allowing the identification of candidate genes and molecular markers associated to the resistance against PWD.
1.1 – Motivation
RNA-Seq is a revolutionary technology widely used to characterize transcriptome profile over different time points, using deep-sequencing technologies. However, in terms of bioinformatics analysis, these type of approaches require to take into account some aspects that can limit the appropriate approaches to use. The most important limitation is to work with non-model organisms like Pinus pinaster, which there is no genome sequence available in public databases. In this sense, this study pretends to contribute to the bioinformatics field, providing a RNA-Seq analysis workflow for a non-model species that could, in future, be applied and adapted to similar studies.
2
1.2 – Objectives
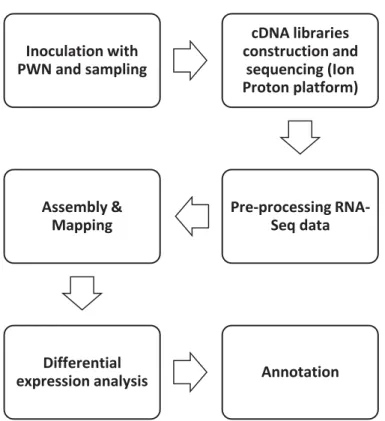
The purpose of this study was to analyze RNA-Seq data to characterize the maritime pine transcriptome in the response to infection with Bursaphelenchus xylophilus. In order to carry out this work, four libraries of RNA-Seq data were sequenced by the Ion Proton platform. The four libraries corresponds to three different time stages after inoculation of the PWN plus the control sample. So, by determining the differentially expressed genes over those libraries, and the regulatory networks and pathways involved, we were able to identify potential candidate genes associated with resistance against PWD. In this context, a RNA-Seq analyses workflow was established and a several bioinformatics tools were used to achieve these aims. In figure 1 are represented all capital stages followed in this study. This dissertation focuses only in the bioinformatics analysis of the sequenced libraries. Inoculation with PWN and sampling cDNA libraries construction and sequencing (Ion Proton platform) Pre-processing RNA-Seq data Assembly & Mapping Differential
expression analysis Annotation
3
1.3 – Maritime Pine and Pine wilt disease
Forests are much more than a large area of land covered with trees. They represent one of the life support systems on Earth, providing essential resources for a range of ecosystems. Furthermore, forests supply various products and services, generating a wide range of economic and social benefits. Due to the commercial value of wood products, maritime pine (Pinus pinaster Ait.) is one of the main conifer species in southwestern of Europe, covering approximately 4 million hectares in this area (Plomion et al., 2000). In Portugal, maritime pine has been considered by many as one of the predominant tree species, and by far the most widespread, mainly in the regions of Atlantic influence, covering over than 700 thousand hectares, that corresponds to 23% of the total forest surface (ICNF – IFN, 2013).
In recent years there has been a worrying decline of a large number of forest species around the world, with maritime pine being one of the most affected. This alarming decay is caused by abiotic and biotic factors, and within this last group of factors we must highlight the pine wood nematode, Bursaphelenchus xylophilus (Steiner & Buhrer, 1934) (Nickle, 1970) as one of the main culprits (Futai et al., 2008).
PWN is a quarantine organism in the European Union (Directive 77/93 EEC), being the causal agent of the pine wilt disease (PWD), that may kill a host tree within a short period of time after infection (Mota et al., 1999). Mostly due to this pathogen, the total area occupied by P. pinaster suffered an abrupt decline in Portugal, accounting for losses of 263,000 hectares between 1995 and 2010 (AFN, 2010). As a result, P. pinaster went from being the main forest species, in terms of distribution and area, to the third, behind eucalyptus and cork oak. Recently, it has been identified as an endangered species by the IUCN red list of threatened species (Farjon, 2010).
PWN was reported for the first time in Portugal in 1999 (Mota et al., 1999), and in less than 10 years the whole P. pinaster area has been affected. PWN is transported between host trees by an insect vector, a longhorn cerambycid beetle (Monochamus
4 galloprovincialis Oliv.) (Sousa E. et al, 2001). The transmission may occur in two forms: by oviposition, whereby the female beetles laying their eggs under the bark of stressed or recently killed trees by the PWN, and the nematodes migrate to pupae just before adult beetles emerge, ensuring successful survival of the parasite; or via transmission by feeding that occurs through beetle feeding wounds (primary transmission). Nematodes carried by beetles move into wounds and breed in the xylem, nonetheless, the survival of nematodes is not guaranteed (Edwards & Linit, 1992; Fielding & Evans, 1996). This is a close relationship between PWN and its vector beetle, resulting in the epidemiological cycle of PWD (Futai et al., 2008).
PWD expression depends not only on the pathogenicity of PWN and susceptibility of host trees but also on environmental conditions such as high temperature and large soil moisture, the optimal conditions for PWN proliferation (Fielding & Evans, 1996). The symptoms caused by PWD are common to other diseases, and therefore can easily be confused. A typical early symptom is needle discoloration. Needles turn grayish green, then tan, and finally brown. Then, resin flow ceases and the wood is dry when cut (Futai et al., 2008).
The defensive mechanisms of host trees can be divided into early and advanced stage (Fukuda, 1997). In the first stage, defensive response occurs in both susceptible and resistant trees, nonetheless, late response is found only in susceptible trees (Fukuda, 1997). In the same species, it has been verified the existence of trees with different levels of susceptibility, some of which survive the infection, thus, constituting an opportunity for selective breeding. This has been the approach in breeding programs developed in China and Japan over the last years (FAO, 1985).
5
1.4 - Next-generation sequencing
Before discussing the applications and impact of next-generation sequencing (NGS), also known as massively parallel sequencing, on genomics research, it is necessary to look back on the history of sequencing development, to review basic concepts and the evolution of NGS systems. The NGS term describes a set of platforms that represent the evolution of sequencing technology from the Sanger system, and has provided unprecedented opportunities. Their use has changed scientific approaches, enabling whole genome or individual genes sequencing, having applications in various fields, including plant biology (Liu et al., 2012).
In 2005 the first NGS platform was launched by 454 Life Sciences (www.454.com). This system is based in the principle of pyrosequencing or sequencing by synthesis. In brief, this process starts with an emulsion PCR in which single-stranded DNA binding beads are encapsulated. During the pyrosequencing mechanism, a successful incorporation of a nucleotide is converted to light emission from the release of pyrophosphate molecules (Liu et al., 2012) (Mardis, 2013). Initially, the 454 system had a read length of 100-150bp, however, it was upgraded to 600-700bp with a 99.9% accuracy after filtering and with an output of 0.7Gb data per run (Liu et al., 2012). The 454 platform was a revolutionary technology that represented an important progress in terms of speed, throughput and allowed reducing the per-base cost over Sanger technology (Van Dijk, Auger, Jaszczyszyn, & Thermes, 2014).
The second platform launched, and presently the most widely used, was the Illumina system from Solexa (www.illumina.com). Briefly, in this system, libraries are loaded into a flow cell and each bound fragment is amplified into a clonal cluster through bridge amplification. Four kinds of fluorescently labeled nucleotides are added and as they are incorporated a characteristic signal is emitted. This emission wavelength is recorded and used to identify the base (Mardis, 2013). Illumina have shorter read lengths (150-300bp) when compared with the 454 system, but produce more reads and have higher
6 throughput per run (~1,500Gb). The Illumina sequencing system also has a lower cost per base than older platforms.
In 2006, Applied Biosystems released the SOLiD platform (Sequencing by Oligo Detection), a system that requires an emulsion PCR approach with small magnetic beads for DNA fragment amplification. The technology of two-base sequencing is used during the sequencing mechanism, where the libraries are sequenced by 8 base-probe ligation with a specific fluorescent marker, which identifies a two-base combination. The probes light signal is recorded and after five cycles the sequence of an entire fragment can be deduced (Liu et al., 2012; Zhang et al., 2011). The SOLiD system has a high accuracy (99.99%) after filtering, producing reads with an average length of 85bp. Nonetheless, is slightly more expensive than Illumina system and may take a few more days per run (Liu et al., 2012). One of the most recent NGS platform is the Ion ProtonTM system, developed by Ion
Torrent in 2010. This technology differs from other existing platforms in base detection. It measures slight variations in pH levels, which is caused by the releasing of Hydrogen ions during base incorporation into a strand of DNA by a polymerase (Ion ProtonTM system
guidelines), instead of measuring light released from fluorescent or chemiluminescent reagents as other platforms do. This sequencer machines use only an ion sensor, therefore it does not require camera scanning or light. For this approach, libraries are amplified by emulsion PCR and each fragment is attached to one bead. These beads are placed into the wells of Ion Chips (Mardis, 2013). The Ion Proton platform has a higher sequencing speed and lower cost per base comparing to oldest platforms. Moreover, it produces up to 10Gb throughput per run with a read length of up to 200bp (Ion ProtonTM
system Documentation).
Over the last years, some new NGS platforms emerged on the market. These technologies, also called third generation sequencing, promise to deliver entire genomes in less than a day, increasing the applicability of sequencing technologies (Schadt et al., 2010). An example of third generation platform is the single-molecule real-time, launched
7 by Pacific Biosciences, enabling real-time observation of DNA synthesis (Schadt et al., 2010).
Since the introduction of the first NGS platform, there was a revolution in the biological research field, which allowed a fast progress in terms of reducing costs, increasing throughput and accuracy. Every day, more organisms are being sequenced, and lots of new raw data are constantly becoming available to be analyzed. This fast paced evolution provides new opportunities and enables additional studies and projects in genomics, metagenomics, epigenomics, exomics and also in transcriptomics which has contributed to the decline of microarrays technology. Furthermore, NGS is being used in forensic genetics and in clinical diagnostics for genetic diseases (Van Dijk et al., 2014; Mardis, 2013; Liu et al., 2012).
Taking this into account and despite some hurdles to be considered, in a near future NGS tools will provide us new applications in research fields and clinical diagnostics that would have been unthinkable some years ago.
1.4.1 - RNA-Sequencing
Transcriptome analysis provides information about all transcriptional activity in a cell or organism, and it has recently gained popularity and been applied to disease pathogenesis studies and identification of biomarkers (Wang et al., 2009).
Initially, the most commonly used technique in transcriptome analysis was microarrays. However this technique has several limitations, like reliance upon existing knowledge of gene sequences or high background levels (Wang et al., 2009). Due to this and to NGS evolution, RNA-sequencing is nowadays the dominant transcriptomics approach for gene expression analysis, identifying differentially expressed genes under different conditions and allowing new insights in various fields such as plant biology (Wang et al., 2009). Unlike microarrays, RNA-Seq does not need probes or reference sequences, produces low
8 background noise and can identify novel transcripts and splicing events, among other advantages. RNA-Seq revolutionized the scientific approaches in transcriptome analysis, offering a number of advantages compared to microarrays.
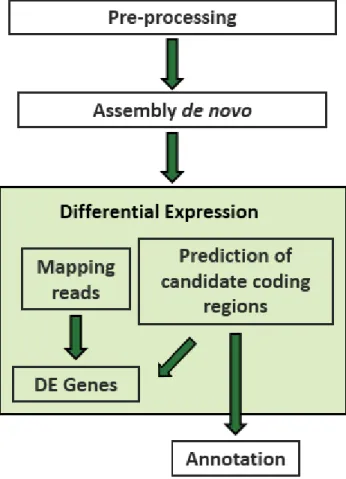
For non-model organisms like P. pinaster, for which there is no genome sequence available, RNA-Seq is an efficient means to generate functional genomic data (Parchman et al., 2010). Once RNA-Seq raw reads have been obtained, the first step of data analysis is to trim raw reads with low quality bases and adapters. Then, processed reads are assembled into contigs before aligning them to the genomic sequence to reveal transcription structure and finally predict candidate coding regions and annotate them against a database (Wang et al., 2009). An example of RNA-Seq data analysis workflow can be observed in figure 2.
9
1.5 - Bioinformatics tools for RNA-Seq data analysis
Next-generation sequencing of RNA libraries has become progressively used in a huge variety of transcriptomic studies. However, this information needs to be processed appropriately, thus, a set of freely bioinformatics tools has been developed for multiple genomic features analysis (Kalari et al., 2014). In this context, some bioinformatics tools commonly used in each stage of RNA-Seq analysis are presented below.
1.5.1 - Pre-processing data tools
Once raw reads have been produced by NGS systems, the first challenge of data analysis is to check the quality of the reads and trim adaptors sequences and low quality bases. For this step, a set of tools like FastQC software (Andrews, 2010) and PRINSEQ (Schmieder & Edwards, 2011) are frequently used, these tools apply a set of control tests on a raw sequence data and provides statistics which reports an overview of quality scores in our RNA-Seq data. FastQC tool outputs a set of graphics where potential problematic areas (low quality) are identified, and it also provides graphical information about GC content, N content, sequence length distribution and overrepresented sequences (Andrews, 2010). Based on FastQC results, it is necessary to trim low quality bases. For this step, is necessary to establish a threshold value for quality and for read length. A commonly software used for trimming low quality reads are Sickle (Joshi & Fass, 2011) and FASTX Toolkit1. They take an input file in fastq format and outputs a trimmed version with a
specific thresholds defined by user. Briefly, Sickle uses a sliding windows along approach, either to trim the 3’-end or the 5’-end of reads, when quality is sufficiently low or high respectively. Moreover, Sickle also discard reads based upon the length threshold defined previously (Joshi & Fass, 2011).
10
1.5.2 - De novo assembly tools
The genomes of a large number of organisms have been sequenced by NGS over the last years, but it still represents a small percentage of all known organisms. Working with non-model species without a reference genome is challenging because it is imperative to determine the transcript sequences from RNA-Seq data de novo, a process known as de novo transcriptome assembly. A set of software packages like TransAByss (Robertson et al., 2010), Velvet/Oases (Zerbino & Birney, 2008) (Schulz et al., 2012) or Trinity (Grabherr et al., 2011) has been developed to perform de novo assemblies. Most of the available assemblers implement algorithms based on de Bruijn graph (De Bruijn, 1946). In brief, in de Bruijn graph a node is defined by a substring of a fixed length k, denoted as k-mer, usually shorter than the read length. The nodes are connected by edges only if their overlap is exactly k-1 nucleotides. This representation enumerates all possible solutions by which linear sequences can be reconstructed given overlaps of k-1. However, the adaptation of de Bruijn graph to de novo assembly may have some issues, such as working with large amounts of data sets or providing robustness in cases of sequencing errors that can introduce false nodes (Grabherr et al., 2011).
One of the assemblers implementing the de Bruijn graph is the Trinity assembler (Grabherr et al., 2011). It is a widely used tool for de novo transcriptome assembly. Trinity includes three modules: Inchworm, that uses a greedy k-mer-based approach, assembles the RNA-Seq data into the unique sequences of transcripts; Chrysalis, which constructs a de Bruijn graph for each cluster of related contigs; Butterfly, which analyzes the paths taken by reads and reports all plausible transcript sequences (Grabherr et al., 2011).
11
1.5.3 - Mapping tools
Mapping, also called alignment of reads to a reference genome or transcriptome, is an essential step in NGS data analysis. This challenge consists in aligning a set of sequenced reads against a reference genome. Numerous tools have been developed to perform this process, including BWA (H. Li & Durbin, 2009) RapMap (Srivastava et al., 2015), Bowtie (Langmead et al., 2009) or SOAP (R. Li et al., 2008), among others. Due to the use of different algorithms, each tool provides different trade-off between speed and quality of the mapping (Hatem et al., 2013). Thus, algorithms must follow some assumptions, like aligning single reads across splice junctions de novo, or handle paired-end reads and run in a reasonable amount of time (Grant et al., 2011). To evaluate RNA-Seq alignments, a set of metrics needs to be checked. For example, each tool provides a score relative to mapping quality (MAPQ), the possibility of limiting the number of allowed mismatches or the gap length. The mapping process is a crucial step to perform differential expression analysis because the latter is performed over the unique mapped reads.
From the large set of mapping tools referred before,RapMap is one of the most recent publicly available. This tool is based on the algorithm called quasi-mapping that uses a combination of data structures, a hash table, suffix array and efficient rank data structure, taking advantage of the transcriptome structure and providing read mapping information for each query that is useful for downstream analysis (Srivastava et al., 2015).
1.5.4 - Differential expression for RNA-Seq data analysis
High-throughput sequencing technologies led to a massive increase in transcriptomic data represented by counts. Analysis of such data is often concerned with detecting differential expression between different stages. The discovery of the differential expression data between different stages is, particularly but not exclusively, done by using biological replicates samples among each stage. Briefly, this type of analysis consists of normalizing the raw input counts and performing statistical tests to accept or reject
12 the null hypothesis of no differential expression between two or more groups of samples
under different experimental conditions (Rashi Gupta, 2012; Soneson & Delorenzi, 2013). Several tools have been developed for inferring differential expression for RNA-Seq data, however, in this thesis we will focus only on EdgeR, an R package from Bioconductor.
1.5.4.1 - EdgeR
R is a programming language for statistical computing, providing a wide variety of statistical and graphical techniques (R Core Team, 2015). R can be extended via packages. The two biggest repositories for R packages are the CRAN (https://cran.r-project.org/) and Bioconductor (Huber et al., 2015), but only Bioconductor is relevant in this context. Bioconductor is an open source, open development software project to provide tools for the analysis and comprehension of high-throughput genomic data, based primarily on the R programming language (Gentleman et al., 2004; Huber et al., 2015).
The EdgeR package provides a set of tools to identify differential gene expression in sequence count data from high-throughput sequencing technologies, allowing the analysis from different groups of data (Robinson et al.,2010). We can describe EdgeR’s model as a statistical software based on the negative binomial distributions, which includes empirical Bayes estimation, exact tests, generalized linear models and quasi-likelihood tests. The input data is summarized into a table of counts, with rows corresponding to genes and columns to samples. To assess differential expression, EdgeR uses an exact test analogous to Fisher’s, but adapted to over dispersed data (Robinson et al., 2010).
1.5.4.2 - Prediction of candidate coding regions (TransDecoder)
Open reading frames (ORFs) are regions of nucleotide sequences between a start and a stop codon, and may indicate candidate protein coding regions in a DNA sequence. In
13 computational biology, identification of candidate coding regions represents a challenge
in RNA-Seq studies conducted in species without a reference transcriptome. For this purpose, some software packages like TransDecoder (B. J. Haas et al., 2013) have been developed.
TransDecoder was integrated into the Trinity package, being useful for the identification of potential protein-coding regions within reconstructed transcripts generated by de novo assembly using Trinity. However, it can also be used as standalone tool. TransDecoder is executed in several steps. Initially, it processes a FASTA file containing transcript sequences and extracts the long ORFs. By default it considers as long ORFs the ones that are at least 100 amino acids in length. Additionally, an extra step to identify ORFs by homology via BlastP and/or Pfam against SwissProt and/or UniRef90 databases, respectively, can also be executed. To finalize the prediction, TransDecoder integrates the results obtained in the previous steps and outputs the final set of candidate coding regions (B. Haas, 2014).
1.5.5 - Transcriptome annotation
Transcriptome annotation provides information related to the function and biological process of assembled transcripts and the proteins they encode. The first step to perform transcriptome annotation involves de novo transcriptome assembly to infer transcripts from RNA-Seq data, or mappping reads onto a reference genome, when it is available. Then, annotation can be performed using one of the available tools implemented for this purpose, such as InterProScan (Jones et al., 2014; Quevillon et al., 2005).
InterProScan is one of the bioinformatics tools available for transcriptome annotation. This software searches protein sequences over non-redundant public domain databases, such as Pfam, Gene3D and Panther, providing information related to protein domains and important sites and classifying them into families (Jones et al., 2014).
14 Once the InterProScan results are obtained, it is possible to filter them and identify Gene
Ontology (GO) terms or KEGG pathways. GO terms are used to describe gene function, classifying them into three categories: molecular function (MF), cellular component (CC) and biological process (BP) (Gene Ontology Consortium). There are several tools that analyse and organize GO terms data sets, including CateGOrizer (Na et al., 2014). This tool takes GOs IDs as input and performs a step-wise classification against a GO_slim database (Zhi-Liang, Jie, & James, 2008).
KEGG database (Kanehisa et al., 2015) is an integrated database which includes genomic, chemical and systemic functional information. Therefore, KEGG is widely used as a knowledge base for interpretation of large-scale datasets generated by high-throughput sequencing, being a reference resource for gene and protein annotation (Kanehisa et al., 2015).
1.6 - SNP calling
Single nucleotide polymorphisms (SNPs) are one of the most common type of genetic variation among individuals. They can be used as biological markers, helping in a set of research studies, which include the susceptibility and response to pathogens, such as maritime pine susceptibility to PWN.
Advances in NGS technologies provided new guidelines for identification of genetic variants such as SNP calling, but an accurate SNP calling can be difficult if NGS data suffer from high error rates or low-coverage (Nielsen et al., 2011). Moreover, assembly and alignment processes have a crucial role in a successful SNP detection (Nielsen et al., 2011). The identification and filtering of SNPs from the raw data requires utilization of many processing steps and the application of a set of tools. Probably, the most widespread package for SNP calling is the genome analysis toolkit (GATK) (McKenna et al., 2010).
15 GATK package provides a wide variety of tools for variant discovery and genotyping, which
include the Haplotype Caller and the UnifiedGenotyper, the tool used in this study. This tool uses a Bayesian genotype likelihood model to estimate the most likely genotypes and allele frequency for each sample in a population of N samples. UnifiedGenotyper generates an unfiltered, highly sensitive callset in variant call format (VCF). VCF is a text file format, containing meta-information lines about position and quality of each variant in genome. To filter the generated data, SelectVariants is a tool that has been widely used. It provides a new VCF file containing the selected subset of variants, following specific thresholds for quality defined by user. An useful tool for variant annotation is SnpEff (Cingolani et al., 2012). This software provides an annotation for variants and predicts the effects they produce on predicted genes.
17
2. - MATERIAL AND METHODS
This section describes the workflow applied in this study to perform the analysis of the RNA-Sequencing data produced to investigate the maritime pine response to infection with PWN. For this purpose, a set of maritime pine trees was inoculated with PWN and four sampling time points were established. RNA extraction was performed and four cDNA libraries were constructed. All libraries were sequenced as single-end reads on the Ion Proton platform. All specifications for these steps are presented in appendix. Data analysis workflow included the pre-processing of the raw reads and the de novo transcriptome assembly, mapping, differential gene expression analysis between all conditions, transcriptome annotation and finally the SNP calling.
2.1 - Pre-processing RNA-Sequencing data and assembly
The quality of the RNA-Seq reads from the four sequenced libraries was checked using FastQC software Version 0.11.3, a quality control tool for high throughput sequence data. Based on the FastQC results, a quality threshold of 12 and a read length of 80bp were defined. These parameters were used to run Sickle tool Version 1.33, trimming poor quality bases and adapters sequences from the raw data, which produced a set of processed reads to proceed with the RNA-Seq analysis. Discarding low quality bases from the raw data allows to reduce errors in subsequent procedures, therefore, pre-processing of raw reads is an important step, contributing to the reliability of the final results. Due to the fact that there was no reference genome available for P. pinaster, it was necessary to perform a de novo transcriptome assembly. The processed reads from all libraries were assembled into contigs using Trinity 2.1.1 with the default parameters. In order to improve assembly by reducing gaps between contigs, clipping 5’ and 3’ low quality regions and obtain larger contigs, the CAP3 software (Huang & Madan, 1999) was
18 used. The resultant assembly was the basis for the next procedures, being used as the
reference transcriptome assembly.
2.2 - Prediction of candidate coding regions
The sequences from the reference transcriptome were analyzed with TransDecoder-2.0.1 software to identify the open reading frames (ORF). This software is even it is able to predict ORFs by itself, allowing the improvement of such predictions performing homology searches. Thus, the ORF transcripts identified were further scanned for homology to known proteins against SWISS-PROT (Boeckmann et al., 2003) and Pfam (Finn et al., 2015) databases by running BlastP (Altschul et al., 1990) and HmmScan (Eddy, 1995), respectively. At the end, TransDecoder provides a final set of candidate coding regions, namely, predicted genes representing the basis for their annotation.
2.3 - Mapping and differential expression analysis
Mapping the reads against the transcriptome assembly was performed using RapMap, a new fast sensitive and accurate mapping tool. In brief, it consisted in building the index over the reference transcriptome, which was subsequently used along with a set of reads as input, to report the alignments in SAM format. This mapping output provided a report for each read (mapped or unmapped), which included the position of the mapped reads in the reference sequence, a quality mapping score, and was useful to infer gene expression information.
Before performing a differential gene expression analysis, it is imperative to determine the number of unique mapped reads, which was accomplished with SAMtools -1.3 (H. Li et al., 2009). SAMtools provides a set of utilities for manipulating alignments in the SAM format. The unique mapped reads were identified from the SAM files by using the flag
19 “NH:i:1”, which is produced by RapMap and indicates solely the reads that mapped only
once in the reference transcriptome.
The EdgeR package of Bioconductor was used to identify transcripts that were differentially expressed between the conditions. To adjust for library sizes and skewed expression of transcripts, the estimated abundance values were normalized using the Trimmed Mean of M-values normalization method (Robinson & Oshlack, 2010) included in the EdgeR package. As our experiment did not have biological replicates, it was necessary to determine the biological variability. Thus, in accordance with the EdgeR guidelines, a BCV (biological coefficient variation) of 0.1 was assigned (McCarthy, Chen, & Smyth, 2012). This procedure has been successfully used previously in other studies, for which biological replicates were also not available (Sebastiana et al., 2014). After the identification of the differentially expressed (DE) genes a multiplicity correction was performed by applying the Benjamini-Hochberg method (Yoav & Yosef, 1995) on the p-values, to control the false discovery rate (FDR). Finally, in order to obtain the most significant DE genes, the results were filtered using a FDR value ≤ 0.01.
2.4 - Transcriptome annotation
The ORFs transcripts identified by TransDecoder were used for transcriptome annotation. This procedure was performed using InterProScan. The protein domains, GO terms and KEGG pathways associated with the genes annotated which are encoding enzymes were identified. A python script was run to filter GO’s and KEGGs from the InterProScan output. Categorizer was used for the analysis of the GOs. From a list of GOs IDs belonging to one of the GO category (BP, CC, MF), it classifies them by their corresponding subcategories against the GO Slim plant, counting the number of GOs within each subcategory, and reporting its percentage over the total set of GO IDs provided.
20 In relation to functional annotation for differential expressed genes, the contigs were
annotated against the non-redundant NCBI plants database (version of August, 2015) using BlastX (e-value 1e-5).
2.5 SNP calling
Variant calling was performed with the GATK toolkit, which offers a variety of tools for variant discovery. Similarly to differential expression analysis, the unique mapped reads were used for SNP calling. The first step was to create a dictionary as a reference from the assembly, which was done using Picard tools (Broad institute, n.d.). Once the dictionary was created, the next step was to produce an unfiltered highly sensitive call set of variants in VCF format, using the "UnifiedGenotyper" tool available in the GATK toolkit. This initial set of variants was then filtered, using the "SelectVariants" option with the parameters SNP quality (QUAL >= 60), individual coverage (DP >= 25) and genotype quality (GQ - phred quality >= 40), in order to produce the final set of high-confidence SNPs. Finally, SnpEff was used to annotate and predict effects of the filtered SNPs.
21
3. - RESULTS
The key results of the RNA-Sequencing analyses from maritime pine response to infection with PWN are shown in this chapter. These results include the most relevant metrics and statistics obtained in each bioinformatics analysis step described previously.
3.1 - Pre-processing of RNA-sequencing data and assembly
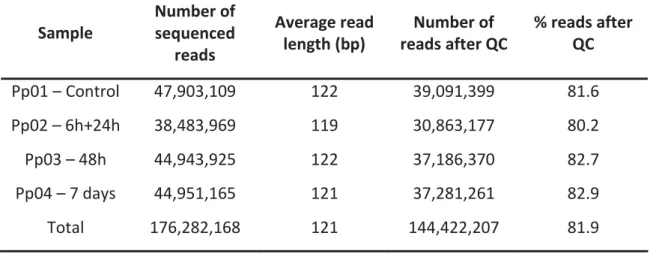
A total of 176,282,168 raw reads were generated for all libraries. After checking quality control using FastQC, low-quality bases were trimmed by Sickle and 144,422,207 high quality reads were obtained with an average range length between 119bp and 122bp (table 1). A total of 81.9% of the original number of reads were retained after applying the quality control procedures.
The de novo assembly performed with Trinity 2.1.1 produced 483,428 contigs. Additional clustering of these contigs was performed with CAP3 (Huang & Madan, 1999), which resulted in an improved assembly comprising 355,287 contigs with a total length of 147,022,102 base pairs. Moreover, the largest contig had 7,285 base pairs. QUAST software (Gurevich et al, 2013) was used to obtain a set of different assembly metrics such as the N50, percentage of GC content, and the distribution of number of contigs above different length ranges. This allows a general view of the assembly status. Key results from the QUAST are presented in table 2.
Regarding gene prediction for the transcriptome assembly, we used TransDecoder software to identify protein coding regions within the unigenes, which yielded a total number of 83,468 predicted genes from the 355,287 assembled contigs.
22
Table 1 - Number of sequenced reads and its average read length for each library. Number and percentage of processed reads after control quality.
Table 2: Key results from QUAST software Sample Number of sequenced reads Average read length (bp) Number of reads after QC % reads after QC Pp01 – Control 47,903,109 122 39,091,399 81.6 Pp02 – 6h+24h 38,483,969 119 30,863,177 80.2 Pp03 – 48h 44,943,925 122 37,186,370 82.7 Pp04 – 7 days 44,951,165 121 37,281,261 82.9 Total 176,282,168 121 144,422,207 81.9 Metric Value
Total number of contigs 355,287 Nº of contigs >=200 bp 355,287 Nº of contigs >=500 bp 66,262 Nº of contigs >=1000 bp 15,997 Nº of contigs >=2000 bp 2,583 Nº of contigs >=4000 bp 74 Nº of contigs >= 6000 bp 3
Total length of contigs 147,022,102 bp
Largest contig 7,285 bp
GC % 44.2%
23
3.2 - Mapping and differential expression analysis
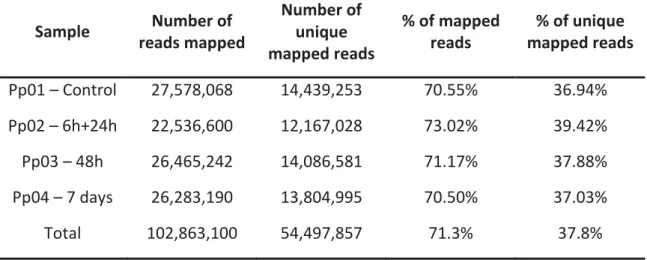
The mapped reads (MR) report for each library is presented in table 3. A total of 102,863,100 pre-processed reads were mapped by RapMap against the transcriptome assembly for all libraries, which corresponded to an average of 71.3% of the total number of pre-processed reads. The lowest percentage of mapped reads were obtained for the control library (Pp01) and for the last sampling time point Pp04, with values of 70.6% and 70.5%, respectively. On the other hand, for the Pp02 library, which corresponds to the 6h+24h sampling time points after inoculation, the highest percentage of MR (73%) was obtained (Table 3).
For all downstream analyses it was essential to filter the unique mapped reads (UMR) from this set of mapped reads. A total of 54,497,857 UMR were retained, which corresponded to approximately 37.8% of total processed reads (Table 3). Similarly to MR, the lower percentage of UMR was detected in Pp01 and Pp04 (36.9% and 37%, respectively), while the Pp02 library had the highest percentage of UMR (39.4%) (Table 3).
Table 3: Number of mapped reads, unique mapped reads and their percentages for each library
Sample Number of reads mapped Number of unique mapped reads % of mapped reads % of unique mapped reads Pp01 – Control 27,578,068 14,439,253 70.55% 36.94% Pp02 – 6h+24h 22,536,600 12,167,028 73.02% 39.42% Pp03 – 48h 26,465,242 14,086,581 71.17% 37.88% Pp04 – 7 days 26,283,190 13,804,995 70.50% 37.03% Total 102,863,100 54,497,857 71.3% 37.8%
24 Statistical analysis in EdgeR software identified a total of 17,533 differentially expressed
genes (DEG) (adjusted P-value ≤ 0.05 and FDR value= 0.01) within the 42,606 significant tests. The number of tests (up and down regulated) for each comparison between two different stages are summarized in table 4. The highest number of tests were identified between the control sample and the Pp02 where 4,969 genes were up regulated and 5,104 genes were down regulated. Moreover, 85 genes were always differentially expressed (up or down) in all comparisons.
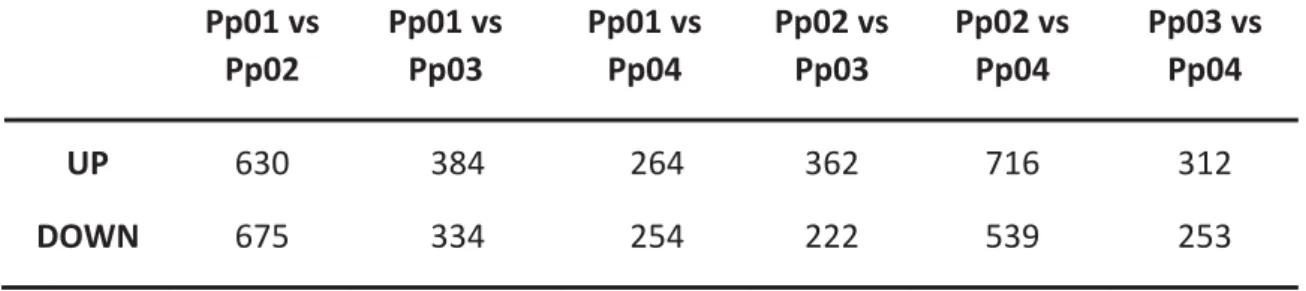
Table 5 shows the number of genes differentially expressed (up and down) uniquely for each comparison. These results are in agreement with the total number of significant tests, since the highest number of DEG were present between Pp01 and Pp02 libraries.
Table 4: Total number of differentially expressed tests (up and down) between each comparison Pp01 vs Pp02 Pp01 vs Pp03 Pp01 vs Pp04 Pp02 vs Pp03 Pp02 vs Pp04 Pp03 vs Pp04 UP 4969 3354 3001 2874 4746 3235 DOWN 5104 3549 2637 2964 3957 2216
Table 5: Number of differentially expressed genes (up and down) uniquely for each comparison Pp01 vs Pp02 Pp01 vs Pp03 Pp01 vs Pp04 Pp02 vs Pp03 Pp02 vs Pp04 Pp03 vs Pp04 UP 630 384 264 362 716 312 DOWN 675 334 254 222 539 253
25
3.3 - Transcriptome annotation
Functional annotation over the 83,468 predicted genes by TransDecoder was performed using BlastP against the NCBI NR-plants database, with results showing a total of 70,646 annotated genes. However, 25,545 annotated genes had “Unknown” description, predominantly being associated to Picea sitchensis, a conifer of the Pinaceae family. From this set of annotated genes, the subset containing only the DE genes also contained 8,996 with an “Unknown” description or no description available. Also for the DE genes, most of the “Unknown” descriptions were related to Picea sitchensis.
We also carried out analysis about protein domains using InterProScan, which provided information related to the Gene Ontology annotations and KEGG pathways in the set of all predicted genes.
Gene Ontology (GO) analysis was performed by running queries against the CateGOrizer plant database, providing information related to three ontologies, which include biological process, cellular component and molecular function. First, a GO analysis was performed for all predicted genes, for which the results are shown in figures 3, 4 and 5. A total of 38,762 (46.4%) genes were associated with at least one GO term and a total of 1,810 different GO terms were found over the whole gene set.
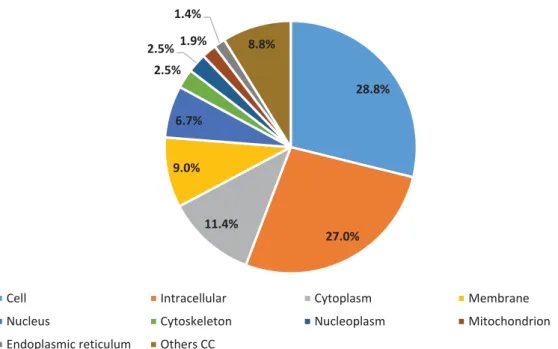
With respect to the biological process branch, we found 1,737 hits assigned to 30 GO terms. The most significant were cellular process (GO:0009987) (32.8%), metabolic process (GO:0008152) (26.9%) and biosynthetic process (GO:0009058) (11.1%) (Figure 3). In the case of cellular component, 690 hits were assigned to 26 terms. The largest proportion GOs were assigned to cell (GO:0005623) (28.84%), intracellular (GO:0005622) (26.96%) and cytoplasm (GO:0005737) (11.45%) (Figure 4). In the molecular function category, we detected 1,437 hits corresponding to 24 GO terms. In this category, the most representative terms were catalytic activity (GO:0003824) (44.2%), transferase activity (GO:0016740) (13.9%) and hydrolase activity (GO:0016787) (11.7%) (Figure 5).
26 Subsequently, to further investigate the biological response associated to PWN infection,
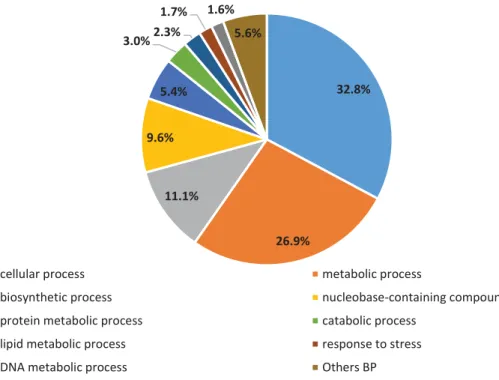
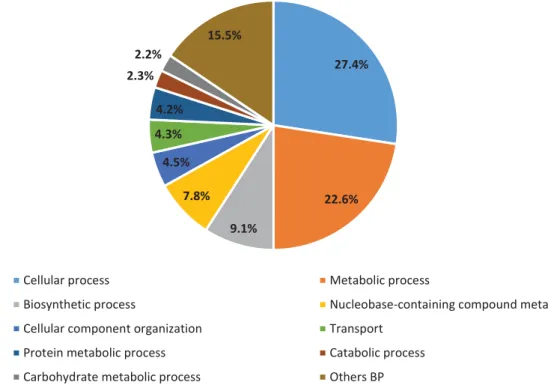
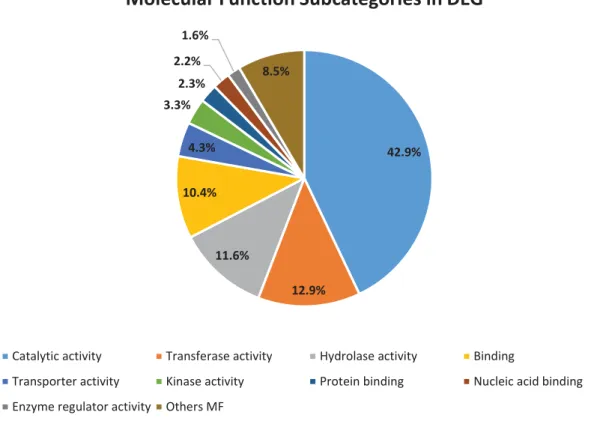
we performed a GO’s analysis for DE genes between all conditions, the results are shown in figures 6, 7 and 8. In this analysis, we identified a total of 9,119 DE genes (52.0%) associated with at least one GO term and a total of 1,292 different GO terms were found. For the biological process term we identified 36 GO subcategories with a total of 1,477 hits. The most representative subcategories were cellular process (GO:0009987) (27.4%), metabolic process (GO:0008152) (22.55%) and biosynthetic process (GO:0009058) (9.1%) (Figure 6). Regarding cellular component terms, 24 subcategories were found with a total of 486 hits. The subcategories with more hits were cell (GO:0005623) (28.6%), intracellular (GO:0005622) (27.4%) and cytoplasm (GO:0005737) (12.4%) (Figure 7). Lastly, for molecular function term we identified 24 subcategories with a total of 1,039 hits. The most relevant subcategories were catalytic activity (GO:0003824) (42.9%), transferase activity (GO:0016740) (12.9%) and hydrolase activity (GO:0016787) (11.6%) (Figure 8). 32.8% 26.9% 11.1% 9.6% 5.4% 3.0%2.3% 1.7% 1.6% 5.6%
Biological Process Subcategories for all predicted genes
cellular process metabolic process
biosynthetic process nucleobase-containing compound metabolic process
protein metabolic process catabolic process
lipid metabolic process response to stress
DNA metabolic process Others BP
Figure 3 - Gene Ontology analysis of RNA-Seq data. Distribution of biological process subcategories for all predicted genes
27 28.8% 27.0% 11.4% 9.0% 6.7% 2.5% 2.5%1.9% 1.4% 8.8%
Cellular Component Subcategories for all predicted genes
Cell Intracellular Cytoplasm Membrane
Nucleus Cytoskeleton Nucleoplasm Mitochondrion
Endoplasmic reticulum Others CC
44.2% 13.8% 11.7% 9.5% 3.9% 3.4% 2.4%1.9% 1.5% 6.7%
Molecular Function Subcategories for all predicted genes
Catalytic activity Transferase activity Hydrolase activity
Binding Transporter activity Kinase activity
Protein binding Nucleic acid binding Enzyme regulator activity
Others MF
Figure 4 - Gene Ontology analysis of RNA-Seq data. Distribution of cellular component subcategories for all predicted genes
Figure 5 - Gene Ontology analysis of RNA-Seq data. Distribution of molecular function subcategories for all predicted genes
28 27.4% 22.6% 9.1% 7.8% 4.5% 4.3% 4.2% 2.3% 2.2% 15.5%
Biological Process Subcategories in DEG
Cellular process Metabolic process
Biosynthetic process Nucleobase-containing compound metabolic process
Cellular component organization Transport
Protein metabolic process Catabolic process
Carbohydrate metabolic process Others BP
28.6% 27.4% 12.4% 9.9% 5.1% 2.5% 2.1% 1.7% 1.7% 8.9%
Cellular Component Subcategories in DEG
Cell Intracellular Cytoplasm Membrane Nucleus
Cytoskeleton Mitochondrion Nucleoplasm Thylakoid Others CC
Figure 6 - Gene Ontology analysis of RNA-Seq data. Distribution of biological process subcategories in DEG
29 42.9% 12.9% 11.6% 10.4% 4.3% 3.3% 2.3% 2.2% 1.6% 8.5%
Molecular Function Subcategories in DEG
Catalytic activity Transferase activity Hydrolase activity Binding
Transporter activity Kinase activity Protein binding Nucleic acid binding
Enzyme regulator activity Others MF
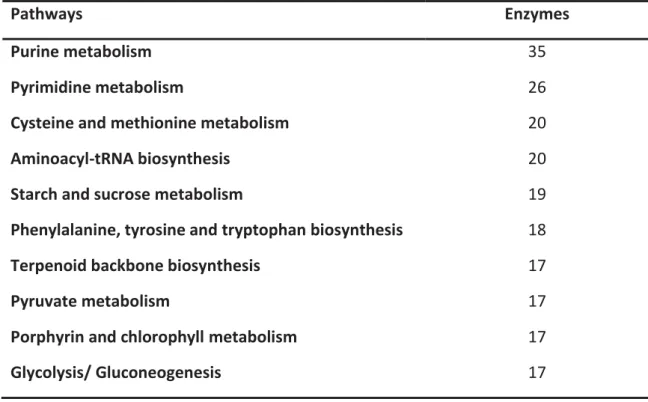
30 Similarly to the GO analysis, we performed the KEGG pathways analysis for all predicted
genes and for the DE genes. In the predicted genes set, we identified 4,904 genes associated with at least one KEGG pathway and a total of 111 KEGG pathways were found. KEGG analysis of DE genes between stages revealed that 1,154 were associated with at least one KEGG pathway and a total of 102 different KEGG pathways were found over this set of genes.
The ten most representative pathways for predicted genes and for DE genes with the number of enzymes associated are shown in table 6.
Table 6 – Summary of most representative KEGG pathways detected in predicted genes and in DEG
Pathways Enzymes
Purine metabolism 35
Pyrimidine metabolism 26
Cysteine and methionine metabolism 20
Aminoacyl-tRNA biosynthesis 20
Starch and sucrose metabolism 19
Phenylalanine, tyrosine and tryptophan biosynthesis 18
Terpenoid backbone biosynthesis 17
Pyruvate metabolism 17
Porphyrin and chlorophyll metabolism 17
31
3.4 - SNP calling analysis
For SNP discovery and filtering, GATK was used with stringent parameters. Variants were called using the UnifiedGenotyper and further filtering was performed using the SelectVariants option. In total, 36,295 different SNPs were detected. Among these SNP’s, 32.0% were found in exons, while 30.6% were detected in an intergenic region, a portion of DNA sequences located between genes (Table 7). Moreover, with respect to the SNPs found in each functional class, we identified 48.5% associated to missense mutations, 50.7% associated to silent mutations and less than 1% associated to nonsense mutations (Table 8).
Table 7 - SNP calling analysis. Number and percentage of effects by region
Table 8 - SNP calling analysis. Number and percentage of effects by functional class
Region Count Percent
Exon 15,232 31.9%
Intergenic 14,600 30.6%
Splice site region 1 <0.1%
Transcript 31 0.1%
UTR 3 Prime 9,072 19.0%
UTR 5 Prime 8,718 18.3%
Type Count Percent
MISSENSE 7,410 48,5%
NONSENSE 121 0,8%
32
Table 9 - SNP calling analysis. Number and percentage of effects by type
Type Counts Percent
3 prime UTR variant 9,072 19.0%
5 prime UTR premature start codon gain variant
1,245 2.6%
5 prime UTR variant 7,473 15.9%
Initiator codon variant 8 <0.1%
Intergenic region 14,600 30.6%
Missense variant 7,350 15.4%
Missense variant + splice region variant 1 <0.1%
Splice region variant 1 <0.1%
Start lost 23 <0.1%
Stop gained 121 0.3%
Stop lost 28 0.1%
Stop retained variant 14 <0.1%
33
4. - DISCUSSION
In this study, we used an approach based in RNA-Sequencing technology to generate the transcriptome profile of maritime pine in different stages after inoculation with PWN, identifying candidate genes associated to resistance mechanism.
One of the main challenges in RNA-Seq studies for non-model organisms like maritime pine is the de novo transcriptome assembly. This is a crucial step, which can yield some undetected errors by the error-prone nature of high-throughput sequencing reads. The error rate of Ion Proton sequencing is between 1% and 3% affecting the accuracy of the de novo transcriptome assembly, since the de Bruijn graph can introduce false nodes, which may have important implications for gene prediction, differential expression analysis and SNP calling. This fact is evidenced in this study due to the low rate of predicted genes from the set of assembled contigs. Only 83,468 genes were predicted from 355,287 assembled contigs. These results can be explained, in part, either by sequencing errors or by assembly errors. In particular, the Ion Proton sequencing error rate is larger than other sequencing platforms, which increases the probability of the errors mentioned previously. Another relevant factor that contributes to the low rate of predicted genes is the unavailability of a reference genome for P. pinaster. In RNA-Seq approaches, the availability of reference genome is important because it provides a full description of genetic sequences and other useful biological knowledge stored in genome. In addition, with the usage of a genome reference it is easier to analyze and compare regions that could be less probably achieved with the de novo assembly. When a reference genome is not available, the genetic description contained in the assembled transcripts can be successfully identified by homology only if the protein products have homologies in different protein databases, giving a set of predicted genes. From the total genes predicted in these study, 70,646 of them were annotated, providing a genomic resource to further deepen the study of candidate genes associated to pine
34 wood disease resistance. However, 25,545 annotated genes had “Unknown” description,
mainly associated to Picea sitchensis. This high number of “Unknown” annotations can be explained again due to the unavailability of a reference genome for P. pinaster.
Despite the limitations mentioned above related with the RNA-Seq approaches, this study provides new advances in the comprehension of maritime pine resistance to PWN, by identifying a set of candidate genes potentially involved in defensive mechanism. However, additional studies are required to identify the real role of each gene in this complex defensive system.
Functional annotation with GO terms for predicted genes resulted in 38,762 (46,4%) unigenes with at least one assignment into one of the three categories of GO terms (BP,MF and CC). In one of the GO categories, the GO terms fell mainly into two or three subcategories. The GO subcategories identified with more evidences are in accordance with other reports (Santos et al., 2012), and may represent a typical gene expression profile for P.pinaster after infection with PWN.
Most plant defensive responses to pathogens have evolved into a complex system, simultaneously combining a number of mechanisms and pathways. To identify pathways involved in defense against PWN, we performed KEGG analysis for our set of predicted genes. The different KEGG pathways associated with the predicted genes are in agreement with Physiome Project Models for P. pinaster (http://nsr.bioeng.washington.edu/jsim/models/kegg/organism.html?eppi) except pyrimidine metabolism. The most prevalent pathways were purine and pyrimidine metabolism. These subunits of nucleic acids are major energy carriers and precursors for the synthesis of nucleotide cofactors such and NAD and SAM (Moffatt & Ashihara, 2002). The comparison of sequence data from all libraries revealed a total of 17,533 DEG. Note that this high number of genes were obtained using a FDR value of 0.01. Usually this kind of studies make use of a FDR value equal to 0.05. Due to the huge number of DEG found
35 with that FDR value, we were forced to decrease it in order to reduce the complexity of
the set DEG to analyze.
The highest number of DEG were identified in the comparison between control sample (Pp01) and the first time point (PP02 – 6h + 24h), suggesting an immediate response to PWN after inoculation. This observation is in accordance with previous results obtained in Pinus thunbergii Parl., that propose an early response to PWN in susceptible and in resistant trees (Shin et al., 2009). Within this early stage of response and comparing with the control sample, several genes potentially involved in the defensive response were detected. The “TMV resistance protein N-like” gene was down-regulated. This gene produces a resistance protein that guards the plant against pathogens, trigging a defense system, which restricts the pathogen growth (http://www.uniprot.org/uniprot/Q40392). We also highlighted “putative TIR-NBS-LRR protein” that belongs to disease resistance proteins family (http://www.uniprot.org/uniprot/Q9ZVX6). These proteins have been referenced as commonly involving in defensive mechanisms in various diseases. Several up-regulated genes for this comparison were also identified, including the “mildew resistance locus 6 calmodulin binding protein” gene, which triggers a response in the occurrence of an infection caused by a foreign body (http://www.uniprot.org/uniprot/B2KZI2). The processes used by the PWN to invade the Pinus pinaster tissues are likely to represent a very similar mechanism, hence this results provides further support for the involvement of the mildew resistance locus 6 calmodulin binding protein gene in the initial response of plants to infections with parasites or other agents. Also “sucrose synthase” was identified, an enzyme that provides the substrate for cellulose synthase, playing an important role in secondary cell wall synthesis (Nairn et al., 2008). The over expression of this enzyme as a response to infection, gives insights that not just proteins related to defensive mechanism are used to fight the infection. Thus, some mechanisms are activated to reconstruct the cell damage originated by the PWN. In the (Shin et al., 2009) report it was also suggested that there is a late response in susceptible trees. This was observed in our data, indicating that this response may occur