WORKING PAPER SERIES
Universidade dos Açores Universidade da Madeira
CEEAplA WP No. 16/2011
Estimation of the Milk Production Function:
Application of the Incomplete Gamma
Function in the São Miguel Island (Azores)
Francisco Silva Maria Graça Batista Rui Ponte
Estimation of the Milk Production Function: Application
of the Incomplete Gamma Function in the São Miguel
Island (Azores)
Francisco Silva
Universidade dos Açores (DEG e CEEAplA)
Maria Graça Batista
Universidade dos Açores (DEG e CEEAplA)
Rui Ponte
Universidade dos Açores (DEG)
Working Paper n.º 16/2011
Junho de 2011
CEEAplA Working Paper n.º 16/2011 Junho de 2011
RESUMO/ABSTRACT
Estimation of the Milk Production Function: Application of the Incomplete Gamma Function in the São Miguel Island (Azores)
The Incomplete Gamma Function was used to explain the behavior of 305 days of lactation of dairy cows on São Miguel Island in the Azores. Ultimately, 330,127 observations of the daily production of these animals were used to estimate the production functions and income per animal of each lactation. Lactations were checked, as were the months of cow calving that maximized production and income for each lactation. The conclusion was that the fourth and fifth lactations maximized the income and production per animal for the 305 days of production. The calving between the months of October and December was shown to maximize the accumulated production of lactation whereas calving between the months of August and December contributed to maximizing the accumulated income per lactation.
The management of livestock directed toward the maximization of the income of the dairy farm must take into account that insemination of these animals will have to take place between the months of December and March so that calving can occur in the intended months and lactation can start at the time of the year conductive to optimal income. The management of livestock lactation of a dairy farm on São Miguel Island demonstrated that it was possible to increase production and income per animal by up to 25%, while the management of calving months was shown to also maximize production and income per animal by up to 9%. However, the low adjustment value of the model (R2 of 25%) pointed to the weak adaptation of the Incomplete Gamma Function to the data used.
Keywords: Incomplete Gamma Function, Production Estimation, Income
Estimation.
Francisco Silva
Universidade dos Açores
Departamento de Economia e Gestão Rua da Mãe de Deus, 58
9501-801 Ponta Delgada Maria Graça Batista Universidade dos Açores
Departamento de Economia e Gestão Rua da Mãe de Deus, 58
Rui Ponte
Universidade dos Açores
Departamento de Economia e Gestão Rua da Mãe de Deus, 58
E
STIMATION OF THEM
ILKP
RODUCTIONF
UNCTION:
A
PPLICATION OF THEI
NCOMPLETEG
AMMAF
UNCTION IN THES
ÃOM
IGUELI
SLAND(A
ZORES)
FRANCISCO SILVA
Departamento de Economia e Gestão Universidade dos Açores
CEEAplA Apartado 1422
9501-801 Ponta Delgada, Azores; Portugal Tel.: 296 650 084
Fax: 296 650 083
MARIA DA GRAÇA BATISTA Departamento de Economia e Gestão
Universidade dos Açores CEEAplA
Apartado 1422
9501-801 Ponta Delgada, Azores; Portugal Tel.: 296 650 084
Fax: 296 650 083
RUI PONTE
Departamento de Economia e Gestão Universidade dos Açores
Apartado 1422
9501-801 Ponta Delgada, Azores; Portugal Tel.: 296 650 084
E
STIMATION OF THEM
ILKP
RODUCTIONF
UNCTION:
A
PPLICATION OF THEI
NCOMPLETEG
AMMAF
UNCTION IN THES
ÃOM
IGUELI
SLAND(A
ZORES)
ABSTRACT
The Incomplete Gamma Function was used to explain the behavior of 305 days of lactation of dairy cows on São Miguel Island in the Azores. Ultimately, 330,127 observations of the daily production of these animals were used to estimate the production functions and income per animal of each lactation. Lactations were checked, as were the months of cow calving that maximized production and income for each lactation. The conclusion was that the fourth and fifth lactations maximized the income and production per animal for the 305 days of production. The calving between the months of October and December was shown to maximize the accumulated production of lactation whereas calving between the months of August and December contributed to maximizing the accumulated income per lactation.
The management of livestock directed toward the maximization of the income of the dairy farm must take into account that insemination of these animals will have to take place between the months of December and March so that calving can occur in the intended months and lactation can start at the time of the year conductive to optimal income. The management of livestock lactation of a dairy farm on São Miguel Island demonstrated that it was possible to increase production and income per animal by up to 25%, while the management of calving months was shown to also maximize production and income per animal by up to 9%. However, the low adjustment value of the model (R2 of 25%) pointed to the weak adaptation of the Incomplete Gamma Function to the data used.
Keywords: Incomplete Gamma Function, Production Estimation, Income
INTRODUCTION
Agriculture represents the main pillar of the economy of the autonomous region of the Azores, contributing decisively to the equilibrium of the trade balance. The agricultural sector currently represents approximately 50% of the Azores’ economy, with milk production accounting for 73%. This sector still employs roughly half the working population. Furthermore, the yearly milk production in the Azores— approximately 80% of which is exported—represents roughly 27% of the total Portuguese production (SREA, 2009).
Because of the Azores’ delicate island situation, importing raw materials and exporting finished products become untenable most of the time. The milk production business is not an exception. The manner in which the purchase price of the milk producer is stipulated, with the industry (purchaser) setting it, also lowers the producer’s leverage to control the margin of profit. Under these circumstances, the agriculture entrepreneur is not able to independently remit the value of the successive increases in costs incurred from the acquisition of raw materials (machinery, food supplements, medications, fuel, fertilizers, etc.) to the industry or the final consumer. As a result, the farmer is forced to optimize dairy production in order to make it profitable.
Such optimization involves the raising of livestock with optimal characteristics at the ideal moments to maximize production and the revenues related to the sale of milk produced by each animal. Since each animal’s production varies throughout the year, based on its characteristics, seasonal variations in the sale of milk to the industry also occur throughout the year. From the producer’s point of view, it is important to have information on the most effective periods to produce and raise the animals, combining the seasons of the year with the biological lactation cycle of each animal and the quotations of the milk price.
Objectives
The aim of this paper is to analyze productive patterns of bovine milk producers related to the island of São Miguel in the Azores in order to statistically estimate the impact of each variable that might affect the production of milk from these animals. After creating a model that can forecast the daily production of an animal with certain characteristics, it will be combined with another model that can valorize production, identifying the characteristics of the livestock and the transient timings to maximize the income from the sale of milk, taking into account the price of the material sold (e.g., the production of each animal), which varies throughout the year. The objective of this paper is also to create tools capable of assisting dairy farmers in maximizing the income from their dairy farms using efficient practices in the management and handling of their animals.
THEORETICAL BASIS
Lactation Cycle
Researchers have developed several empirical studies of the biological production cycle of milk-producing livestock in order to characterize and forecast their production. Algebraic functions have been utilized to describe the existing relationship between the production of milk and post-calving time spent. The graphical representation of milk production over time is labeled as the lactation curve (Yadav, Katpatal, & Kavshik, 1977), in which a concise summary of milk production patterns determined by the biological efficiency of an animal is used to select and manage the feeding of an animal or a herd. A cow has a productive cycle of roughly 305 days a year, and its behavior varies depending on the growth process and death of her mammary cells. This cycle is
usually composed of an initial production (t=0), ascending to its peak and subsequent decline and drying off (t=305)—a stage in which the animal rests for approximately two months before calving again and starting a new lactation.
Of the main particularities of lactation, the persistence and peak stand out. Although lactation peak designates the period in which milk production is maximized, persistence in a given lactation may be defined as the cow’s ability to maintain production after reaching this peak. Each animal has different capacities of converting its feed into milk, depending on genetics, environmental conditions, age, calving, and lactation stage, among other factors. Independently, a natural production cycle exists in which these factors operate, making it variable in quality, quantity, peak, and persistence. The importance of knowing this cycle, as well as the factors involved, is based on the premise that any impact on the lactation curve directly influences the profits of a dairy farm.
The lactation curves and the parameters calculated from them, as well as peak and persistence, have long been used to aid in the management of dairy farms. In many situations, production forecast for the 305 days is needed despite having incomplete information. Therefore, by knowing the production forecast of each animal beforehand based on each one’s specific inputs, the farmer can make productive and genetic use of the efficient animals while eliminating inefficient ones, while perform feeding, insemination, and slaughter tasks at effective timings in order to maximize economic advantages. Thus, it is fundamental to estimate from partial records the total milk production of an animal in lactation. Based on this estimate, it is possible to select an animal based on its characteristics or part of its lactation.
The lactation curves are also important for determining strategies capable of optimizing the selection and search of more efficient and profitable genotypes for the
farmer. The curve’s shape indicates possible needs for the farmer to manage the animal’s feeding. For example, an ascending phase of the curve indicates the need for a better feeding plan for the animal, reinforcing its potential of production while it undergoes a biological phase of productive ascension. On the other hand, a decreasing curve requires a less complex nutritional plan since the animal is going through a phase of biological decline in output, making it unnecessary to overfeed it. The study of the shape of the curve and its components makes possible the establishment of improvement programs that consider total production, with the components determining the lactation curve, the shape of which would be the most desirable in a biological or economical sense.
Incomplete Gamma Model
The advancements of statistical procedures and development of new computer techniques have made it possible to use improved methods, leading to a more accurate estimate of milk production. In more developed countries, dairy farms’ computing capabilities have improved in recent years, enabling them to measure and store all records of each animal’s daily production. Using this information, it is possible to create the lactation curve and respective parameters for comparison, analysis, and management of each animal. It is necessary to find a mathematical model that can be adjusted with the greatest precision for this phenomenon.
Empirical mathematical models of lactation curves are the regular functions y = f (t), defined for positive values of daily milk production (y) and the post-calving period (t). These models represent a fundamental research tool for the development and validation of mechanistic models, with the objective of explaining the main characteristics of standard milk production in terms of learning about the biology of the mammary glands during gestation and lactation. These models also have the advantage
of minimizing the random variation, simultaneously synthesizing the profile of lactation in biologically interpretable parameters.
The models are useful for estimating milk production in lactation accrued from partial results and building projections according to the extension of the lactation period, providing farmers with different decisions to make when managing the herd. The mathematical programming models attempting to describe this phenomenon must recognize the complex biological nature of milk production in order to be robust. Furthermore, the researchers must quantify the effect of each variable in order to take maximum advantage of this knowledge.
Certain algebraic equations have been proposed by different researchers in the field who have compared and discussed the results and conclusions among themselves. For example, the Incomplete Gamma Function (Wood, 1967) is capable of generating curves of different shapes, influenced by environmental and biological factors. Wood’s model has been widely used for estimating lactations. The Incomplete Gamma Function (Yn anbe cn
−
= ) is an exponential function consisting of three parameters (a, b, c) and a variable for time (n). These parameters are normally interpreted as initial production (a), rising to peak (b), and decreasing to post-peak decrease (c) of the milk production (Yn)
in a given post-delivery day (n). This model is also advantageous as it can be modeled after different types of curves based on its algebraic configuration. However, some researchers (Kellogg, Urquhart, & Ortega, 1977) claim that the most adequate mathematical model will be different for each geographical region and each climatic situation.
In manufacturing industries, the purchase price of milk production depends on the balance between supply and demand in the international dairy market. Distribution and marketing enterprises of these products are in charge of balancing the purchase price for industry based on the balance of surpluses and shortages in the supply of dairy products in the markets. In turn, the industry forwards this price on to production. This is followed by an inverse process between the delivery chain of this product and the setting of its price; despite milk and derivatives being staple goods, they are not of limited origin and abound in large quantities for the markets. Therefore, the price of these products is indirectly set for distribution to the industry, which in turn remits this volatility directly to the purchase price relating to production.
The production price also depends on different factors related to modality, quantity, and quality of the milk delivered to the industry. Given the fact that a greater abundance of milk exists on the market in summers and greater shortages in winters, the price paid to the producer is normally seasonally adjusted at these times. Therefore, the price paid per liter of milk to the farmer, from March to August, is relatively lower than the price paid from September to February as a means to balance milk supplied to the market.
Objectives
Explicit empirical objectives were tiered as follows:
1. To estimate the parameters of the Incomplete Gamma Function, which can be adjusted to the data based on lactation and month of calving;
2. To estimate production throughout 305 days for lactation and 1 month for calving through the application of the parameters calculated by the Incomplete Gamma Function;
3. To estimate the average monthly sale price of milk to the industry using a model of seasonal forecasting based on historical information;
4. To estimate the income for 305 days for lactation and 1 month for calving, multiplying monthly production by the respective price estimates; and
5. To analyze the results and determine lactations and months for calving that maximize the production and income related to each animal.
METHODOLOGY
Production Function
A database was used in reference to the “Contrast Dairy” program under the responsibility of the Regional Department of Agrarian Development (Direcção
Regional do Desenvolvimento Agrário), maintained by the Agrarian Association of São
Miguel (Associação Agrícola de São Miguel). The data obtained grouped together monthly observations made of the daily production of milk of 18,590 animals of the Holstein-Frisia breed grazing on São Miguel Island in the Azores archipelago from 2004 to 2008.
The following operations were conducted on the original database:
1. Eliminated inconsistent and erroneous records;
2. Eliminated production records exceeding 305 lactation days; 3. Eliminated production records inferior to 10 liters daily; 4. Eliminated production records exceeding 70 liters daily; and 5. Grouped lactations equal to or more than 7.
The final database included 330,127 daily observations of milk production in liters within two decimals places for each day of lactation, number of lactations, and month of delivery. The data were adjusted by the Incomplete Gamma Function [1] (Wood, 1967), using the statistics package of the SAS System v9.0 software (Macciotta, Cappio-Borlino, & Pulina, 2004).
cn -b
e
n
a
=
y
[1]To estimate the parameters “a,” “b,” and “c” of the production function [1], the NLIN method of multiple iterations through Marquardt’s algorithm was used. To vary the initial parameters calculated by the REG procedure applied to the logarithmic function of production [2], the method selected the parameters minimizing the sum of squared estimation errors for each lactation and month of calving.
cn
-log(n)
b
log(a)
log(y)
=
+
×
[2]The consistency and confidence in the model were analyzed using measures of variance and error of the initial parameters.
The accumulated production [3] from a specific animal’s lactation (305 days) was calculated through the summation, from 0 to 305, of the Incomplete Gamma Function [1]:
n
d
e
n
a
y
b −cn∑
=
=
305 0Y
[3]The estimated parameters were also the basis for calculations of the following indicators for each lactation number and month of calving (Macciotta, Cappio-Borlino, & Pulina, 2004): Initial Production (n=1): c
ae
−=
Y
1Ascension to the Peak:
b
=
A
peakDecline after the Peak:
c
=
D
peakLactation Peak (days):
c
b
=
T
peak Lactation Peak (Lt.):( )
b be
c
b
a
⎟
⎠
⎞
⎜
⎝
⎛
=
Peak
Income FunctionA database was used to track quotations of the average prices paid to individual Azores dairy farmers each month from January 2005 to May 2009 in €/Kg. The data were provided by the agricultural market information system of the Office of Planning & Policy of the Ministry of Agriculture, Rural Development and Research. The prices were converted to €/Lt in order to apply them to the amounts forecasted by the production function [1].
A price forecast was also defined using an integrated autoregressive model of moving average time series that predicts seasons based on historical seasonality— SARIMA [4]—of the statistical program SPSS. The SARIMA model is described as
ARIMA(p,d,q)x(P,D,Q)S, in which (p,d,q) refers to the non-seasonal part of the model while (P,D,Q)S refers to the seasonal part.
( )
( )
( )
( )
S t Q qB
B
ε
θ
φ
pB
Φ
B
S∇
d∇
DtΖ
t=
Θ
[4] Where:1. p is the non-seasonal auto regression order; 2. d is the non-seasonal differentiation number; 3. q is the non-seasonal moving average order; 4. P is the seasonal auto regression order; 5. D is the seasonal differentiation number; 6. Q is the seasonal movable average order; and 7. S is the length of seasonality.
A series of monthly prices until December 2015, using the prediction variant ARIMA (1;0;1) (1;0;1) 12, was provided.
Once the Incomplete Gamma Function model [1] predicts the amount (Lt.) of milk that an animal with established characteristics (month of delivery and lactation number) can produce, the income function [5] can be considered as the production function [5] multiplied by the sale price of the produced content (€/Lt) on the date of this production. n cn -b n
=
(a
n
e
)
P
I
[5] Where:1. In = income from the day n of lactation;
2. a, b, c = parameters related to the animal’s characteristics; 3. n = day of lactation (time occurred after calving); and
4. Pn = sale price of milk produced in day n of lactation (euros/Lt);
Since the prices are differentiated between two periods of the year, the accumulated income function for the 305 days [6] must also be differentiated to valorize production in both periods, according to their respective sale prices.
Pi
dn
e
n
a
Pv
dn
e
n
a
x cn b x cn b⎟⎟
⎠
⎞
⎜⎜
⎝
⎛
+
⎟
⎠
⎞
⎜
⎝
⎛
=
∑
∑
+ − − 305 1 0I
[6] Where:1. I = total income for 305 production days;
2. a, b, c = parameters related to the animal’s characteristics; 3. x = lactation day at the end of the summer price period;
Ex: x (days) = beginning of the winter season – date of calving-1; 4. Pv = milk sale price in the summer season; and
5. Pi = milk sales price in the winter season.
RESULTS
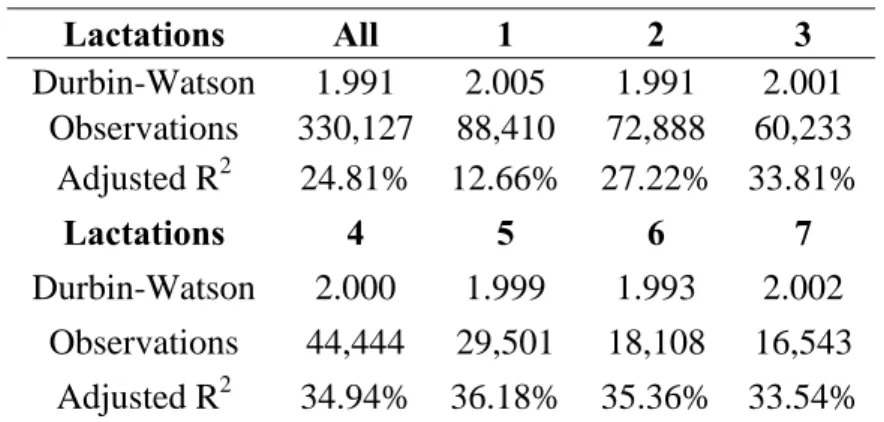
R2 was below 40% for all lactations (Table 1 - Statistical Significance Analysis), meaning the model can only explain this portion of the observed variations. The R2 of the sample was centered at 25% for 330,127 observations. A negative correlation was observed between the evolution of this value and the number of observations in the
sample; as the number of observations in the sample increased, the explanatory power of the model (R2) decreased.
Table 1. Statistical Significance Analysis.
Lactations All 1 2 3 Durbin-Watson 1.991 2.005 1.991 2.001 Observations 330,127 88,410 72,888 60,233 Adjusted R2 24.81% 12.66% 27.22% 33.81% Lactations 4 5 6 7 Durbin-Watson 2.000 1.999 1.993 2.002 Observations 44,444 29,501 18,108 16,543 Adjusted R2 34.94% 36.18% 35.36% 33.54%
Compared to previous research, Cobuci (2000) found a R2 of 79% in 1,130 observations when applying this model to analyze animals of the Guzerá breed in Brazil. Gonçalves (2002) studied animals from the Holstein breed, verifying an adjusted R2 of 99.99% in 157,932 records. Andrighetto (2004) found a R2 of 54% in the adjustment of the Incomplete Gamma Function of 3,360 observations of buffalo production in Brazil. On the other hand, Oliveira (2007) found a R2 of 13% in 48,710 records whereas Muñoz-Berrocal and Tonhati (2003) found a R2 of 86% in the application of the Incomplete Gamma Function to 27,600 observations of buffalo production in São Paulo, Brazil.
The Durbin-Watson (DW) index, which measures auto-correlation between the residuals, showed a value close to 2 (Table 1 - Statistical Significance Analysis) for all lactations, indicating the absence of auto-correlation between the unexplained observations by the model. Gonçalves (2002) verified a DW of 2.1 in Holstein breed animals in the State of Minas Gerais, Brazil. Dematawewa (2007) observed a DW of 0.25 for the adjustment function related to animals of the Holstein breed in the United
States, whereas Silvestre (2006) obtained a DW of 1.1 for the adjustment function in bovine lactations in the north of Portugal.
Characterization of Lactations
By analyzing initial production in each lactation and month of delivery, the highest production (37 Lt.) in the first lactation days happened during the fourth lactation, which started in August, and the third and sixth lactations, when calving occurs in June. Delivery in the months of May to June was also observed to have favorable lactations with a 34% higher initial production than those initiated in other periods of the year. The month of June was shown to be the best month for delivery to reach maximum initial production. However, this amount continually decreased because this delivery occurred at the height of the year of unfavorable conditions for successful calving while simultaneously allowing for more natural and regular feeding, which is favorable to initial milk production superior to that observed in lactations during other months. On the other hand, whereas initial production in the months of May to July, for all lactations, demonstrated the highest initial production, they did not contribute to the maximum accumulated production for the entire 305 days. This situation may be due to the fact that an animal approaching the biological production peak is also approaching the middle of the summer season, where temperature and lack of natural feed hinder its maximum production efficiency, passing the biological production peak at a time of year in which conditions allowing it to take full advantage of its productive capacity do not exist.
Regarding production peak per lactation and month of calving, the maximum daily production observed (39 Lt.) occurred in the fifth lactation, when calving occurs in the month of April. Furthermore, calving from March to June (i.e., spring) was the more
favorable lactations period, with a production peak 8% higher than other periods of the year. In relation to the time after calving it took to reach the production peak, calving from May to August contributed to reaching the peak faster (from one to seven days faster), while from September to December it took considerably longer (from 40 to 47 days). Animals in the first, fourth, and fifth lactations had more difficulties reaching their peak (45 and 34 days, respectively) while animals in the second and third lactations had faster average times (30 and 31 days, respectively) before reaching the production peak.
The growth rate to the peak reflects the acceleration with which the animal reached its production peak from the initial production. Calving in the summer months displayed very low or negative growth rates to the peak, meaning that the animals calved during this period experience little growth from their initial production to their peak, indicating that—in cases of negative rates—initial production has already peaked. Calving in the winter months caused greater discrepancies (higher growth rates) from their initial production to their peaks. Thus, calving in the summer months enhances the ability to reach the peak of production faster (often on the first day of production) more than calving in the winter season. Regarding the rate of decline after reaching the peak, calving from June to September (i.e., summer) favors lactations that—upon reaching their peak—are more enduring and experience lower rates of drops in production than lactations than in the winter periods.
Production Function
By using parameters of the Incomplete Gamma Function for each month of calving and lactation, the accumulated production for 305 lactation days was calculated for each order of lactation and month of calving through the production function [1]. The fourth
and fifth lactations were shown to be more productive after 305 days, followed by the fourth and third lactations. On the other hand, the lactation started in the first calving period was shown to be the least productive. An animal in the fifth lactation produced on average 25% more milk than an animal in the first lactation, 8% more than animals in the second and seventh or more lactations, and approximately 2% more than animals in the third and sixth lactations.
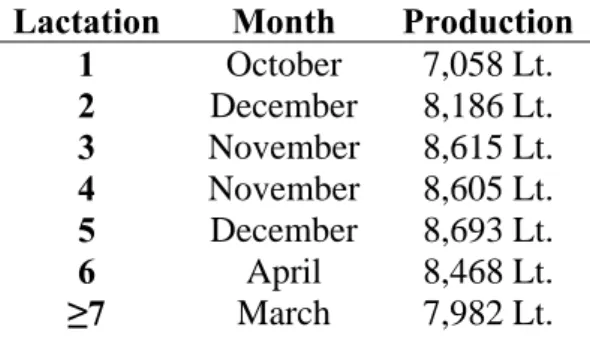
The month of delivery that maximizes production (Table 2 – Month of calving maximizing the accumulated production of lactation) varied according to the animal’s lactation. However, deliveries from October to December were shown to maximize on average 2% of the accumulated lactation production.
Table 2. Month of calving maximizing the accumulated production of lactation.
Lactation Month Production
1 October 7,058 Lt. 2 December 8,186 Lt. 3 November 8,615 Lt. 4 November 8,605 Lt. 5 December 8,693 Lt. 6 April 8,468 Lt. ≥7 March 7,982 Lt.
An animal starting its fifth lactation in the month of December presents the ideal state for maximum accumulated production for 305 days (8,693 Lt.). This condition is excellent due to the fact that the animal, despite undergoing a (fifth) lactation at top mammary capacity due to calving in December, reaches its production peak in a season in which environmental conditions provide natural, rich, and regular feeding, thereby maximizing its production. Therefore, the animal takes advantage of the combination of the most productive lactation and the month of calving, enabling the animal to reach the
peak of its biological cycle of production in the season of the year of highest production.
Considering the gestation period of the cow (nine months), the optimal month for insemination of an animal in a given lactation was extrapolated from the given month (Table 3 – Month of insemination maximizing accumulated production).
Table 3. Month of insemination maximizing accumulated production.
Lactation Starting in Month
1 January 2 March 3 February 4 February 5 March 6 July ≥7 June
In the effective management of an animal on a dairy farm, this information (Table 3 – Month of insemination maximizing accumulated production) plays a significant role in the management of the insemination months of each animal. By managing the month of insemination, the manager can control the month of the next delivery for each animal, making it occur at the time of year in which conditions are excellent for maximizing the production of the lactation to begin.
Assuming a difference in the production accumulated for 305 days of a lactation started for at least a month and being more efficient, the management of the month of calving can maximize an animal’s yearly production by up to 9% (Table 4 – Maximum production effect from managing the month of calving).
Table 4. Maximum production effect from managing the month of calving.
Lactation Effect
2 7% 3 6% 4 4% 5 6% 6 7% ≥7 7% All 5% Income Function
Income was calculated in Euros per animal for 305 days of production for each lactation and month of calving using the income function [6], taking into account the prices estimated for the year 2009. The maximum average accumulated income was observed for animals between the third and sixth lactation. The most profitable lactation period was the fifth one, rendering approximately 2,525€ for the 305 days of production.
The month of calving maximizing accumulated income for the 305 days of lactation depended on the animal’s number of lactations (Table 5 – Month of calving maximizing accumulated lactation income). However, calving occurring during the second semester showed an increased income per animal by up to 5%.
Table 5. Month of calving maximizing accumulated lactation income.
Lactation Month Production
1 July 2,103€ 2 December 2,416€ 3 August 2,540€ 4 September 2,575€ 5 December 2,566€ 6 May 2,507€ ≥7 September 2,358€
An animal beginning its fourth lactation in the month of September presented the ideal condition for maximizing accumulated income for the 305 days (2,575 €). This
condition is excellent since the production and milk price cycles combine to produce more (production peak) when the price of milk is higher (milk price peak), maximizing the income from the animal.
Assuming a cow’s normal gestation period, the optimal month of insemination can be determined so that the calving occurs in the intended month (Table 6 – Month of insemination that maximizes the total income).
Table 6 . Month of insemination that maximizes the total income.
Lactation Starting in Month
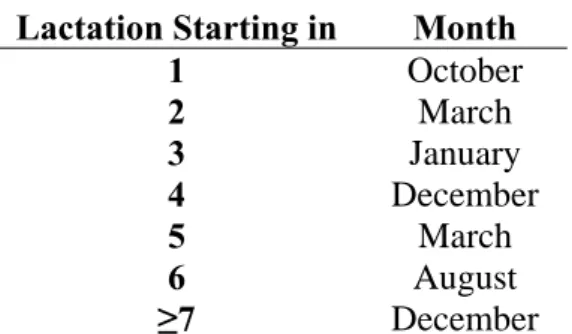
1 October 2 March 3 January 4 December 5 March 6 August ≥7 December
This information is extremely useful when effectively managing a dairy farm animal, where management of the months of insemination for each animal is performed according to its lactation, in order to ensure that the next calving occurs during the time of year with optimal conditions, thereby maximizing income from the upcoming lactation.
Based on the existing difference between the accumulated income from 305 days of a single lactation started for at least a month and the more efficient lactation, it can be concluded that managing the month of calving may maximize up to 9% (Table 7 – Maximum effect in managing the month of calving per lactation) of the yearly income of an animal.
Lactation Effect 1 9% 2 6% 3 5% 4 4% 5 5% 6 6% ≥7 6% All 6%
CONCLUSIONS
As the data indicate, the accumulated production for 305 days is maximized in the fourth and fifth lactation periods independent of the month of calving. The month of calving maximizing the animal’s accumulated production varies during each lactation, although the months from October to December were shown to be optimal. Regarding income per animal, the fourth and fifth lactations were also observed to maximize income for 305 days of production. As to the optimal month of calving, besides varying with the lactation, it was verified that the periods from August to December maximize the accumulated income from the lactation.
To maximize production and income of a dairy facility, the entrepreneur must have a herd comprised primarily of animals between the third and sixth lactations, maintaining an accumulated production per animal for 305 days above 8.3 liters and an income above 2.4 Euros per lactation. The management of lactations was shown to increase production and income of each lactation up to 25% per animal, while management of the months of calving through insemination was also shown to increase productivity and income, related to the lactation in question, by up to 9% per animal.
However, the model presented an R2 of 25% and a Durbin-Watson index of 1.99 in the sample used, which did not indicate a strong model adaptation despite noting an
absence of auto-correlation among the observations. Due to lack of apparent causes to justify the occurrence of different optimal months for calving relative to different lactations, no significant discrepancies were expected between the optimal months for calving during each lactation, for both production and income.
It was also concluded that the use of the database from São Miguel Island ignores the particular effects of each dairy farm, such as microclimate and feeding, among other specific conditions. To forecast production and income per dairy farm, a database comparing historical patterns from specific dairy farms with similar characteristics should be utilized. The further use of data explaining production variation during lactation and mathematical models with greater explanatory power than the Incomplete Gamma Function might contribute to better results in forecasting production and income per animal. Finally, since the price of milk depends on its fat and protein content, a robust model forecasting the income per animal might also take into account the forecasting of the fat and protein content per animal.
REFERENCES
Cobucci, J.A., Euclydes, R.F., Verneque, R.S., Teodoro, R.L., Lopes, P.S., & Silva, M.A. (2000). Lactation curve in Guzera breed. Revista Brasileira de Zootecnia, 29(5), 1332-1339. doi: 10.1590/S1516-35982000000500011.
Gonçalves, T.M., Oliveira, A.I.G., Freitas, R.T.F., & Pereira, I.G. (2002). Curvas Lactation Curve in Holstein Herds of Minas Gerais State: Choice of Model with the Best Fit. Revista Brasileira de Zootecnia, 31(4), 1689-1694. doi: 10.1590/S1516-35982002000700011.
Kellogg, D.W., Urquhart, N.S., & Ortega, A.J. (1977). Estimating Holstein lactation curves with a Gamma Curve. Journal of Dairy Science, 60(8), 1308-1315. doi: 10.3168/jds.S0022-0302(77)84028-9.
Macciotta, N., Cappio-Borlino, A., & Pulina, G. (2004). Growth and Lactation Curves. In P. D. Arnauld Saxton, Genetic Analysis of Complex Traits Using SAS (97-146). North Carolina: SAS Publishing.
Muñoz-Berrocal, M., & Tonhati, H. (2003). Uso de modelos lineares e não lineares
para o estudo da curva de lactação em Bufalos Murray e seus mestiços em sistema de criação semi-extensivo, no estado de São Paulo. Faculdad de Zootecnia, UNAS - Perú.
Oliveira, H.T.V., Reis, R.B., Glória, J.R., Quirino, C.R., & Pereira, J.C.C. (2007). Curvas de lactação de vacas F1 Holandês-Gir ajustadas pela função gama incompleta.
Arquivo Brasileiro de Medicina Veterinária e Zootecnia, 59(1), 233-238. doi:
10.1590/S0102-09352007000100037.
Silvestre, A.M., Petim-Batista, F., & Colaço, J. (2006). The accuracy of Seven Mathematical Functions in Modeling Dairy Cattle Lactation Curves Based on Test-Day Records From Varying Sample Schemes. Journal of Dairy Science , 89(5), 1813-1821. doi:10.3168/jds.S0022-0302(06)72250-0.
SREA. (2009). Principais Indicadores Estatísticos. Serviço Regional de Estatística dos Açores: Instituto Nacional de Estatística.
Wood, P.D.P. (1967). Algebric model of the lactation curve in cattle. Nature. 216, 164-165. doi:10.1038/216164a0.
Yadav, M.C., Katpatal, B.C., & Kavshik, S.N. (1977). Components of Gamma Type Function of a lactation curve, and factors affecting them in Hariana and its Friesian crosse. Indian Journal of Animal Science, 49(9), 502-505.