Bruno José Fernandes Faria Matos
Evaluation and Characterization of the
Anaerobic Profile in Soccer Players
Master Degree in Sports Training
Dissertation under the guidance of Ph.D. Filipe Manuel Batista Clemente
Co-Advisor Ph.D. João Miguel Camões
II
III Matos, Bruno José Fernandes Faria
Evaluation and Characterization of the Anaerobic Profile in Soccer Players / Bruno José Fernandes Faria Matos; Advisor: Ph.D. Filipe Manuel Batista Clemente. – Masters Degree in Sports Training, Escola Superior de Desporto e Lazer do Instituto Politécnico de viana do Castelo. - 107 p.
Keywords: Soccer, Anaerobic Power, Wingate Anaerobic Test, fitness assessment and monitoring
V
Every morning a gazelle wakes up knowing she will have to run faster than the fastest lion in the savannah if she wants to survive. Every morning a lion wakes up knowing he needs to run faster than the slowest gazelle in the savannah if he does not want to starve.
It does not matter if you're a lion or a gazelle. When the sun rises, start running. African Proverb
VI
DEDICATION
Alice, Leandro, Carla, Nesinha, Elvira, José Fernandes, Gabriela, Armindo, Joana, Carolina, Teresa, Zézinha, João, João Pedro, Jorge, Sofia, Pipa, Sarita, Ana Inês and Marco for being my greatest example. You are the reason why I fight to be better every day.
VII
ACKNOWLEDGMENT
To the Ph.D. Filipe Clemente for the total dedication he gave to this work and for the incessant help and motivation so that I could conclude this thesis with the best possible quality.
To the Ph.D. Miguel Camões for being during this two-year period a source of inexhaustible motivation and for having always provided all the necessary help.
To Ana Inês, for all the hours I have not been with you to be able to run towards my other great passion.
To César Leão, for helping me the way he could whenever I needed it.
To Celso, Gui and Peixoto for the friendship over these two years. We have stories that we will never forget.
To Mário Simões, who believed in my work 4 years ago and continues to be my greatest reference in the field.
To Luís Mesquita and Jorge Ribeiro for being a source of energy and daily motivation to grow as a man and a professional. They are, in their own way, a reference for me.
To Machado, Afonso and Mantorras for everything we have already shared. This conquer is also yours. Life will never diminish the importance that you have for me.
To Marcos Costa Pinto for the fraternal and paternal figure that he represents for me and for being the responsible person for the passion that I have for training today. The wings that you gave me are what allow me to reach all that stages in my life.
To my very rare friends, for all the minutes that I stole from them, to be able to walk towards my goals. Without you, I would not be here today.
VIII
GENERAL INDEX
THESIS DESCRIPTON ... III EPIGRAPH ... V DEDICATION ... VI ACKNOWLEDGEMENTS ... VII GENERAL INDEX ... VIII INDEX OF TABLES ... IX ABSTRACT ... XI LIST OF ABREVIATIONS ... XVI
CHAPTER I – GENERAL INTRODUCTION ... 1
General introduction ... 3
Characterization of the game ... 4
Game Demands ... 4
Activity profile by tactical position ... 5
Practical apllications by activity profile by tactical position ... 7
Bioenergetics of soccer ... 9
Aerobic capacity ... 10
Anaerobic capacity ... 12
Interaction between aerobic and anaerobic energy systems ... 14
CHAPTER II – GENERAL OBJECTIVES ... 17
General objectives ... 19
CHAPTER III – ORIGINAL PAPERS ... 21
Paper 1 ... 23
Paper 2 ... 34
CHAPTER IV – GENERAL DISCUSSION ... 66
General discussion ... 68
CHAPTER V – GENERAL CONCLUSION ... 74
General conclusion ... 76
CHAPTER VI – GENERAL REFERENCES ... 79
IX
INDEX OF TABLES
PAPER 1
Table 1. Estatística descritiva (média ± desvio-padrão) dos valores obtidos do Wingate para as diferentes faixas etárias. ... 45
PAPER 2
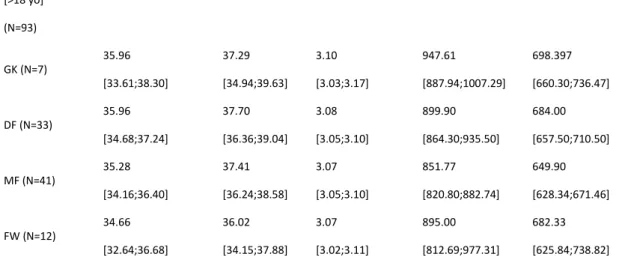
Table 1. Characterization of the sample ... 80 Table 2. Mean and [90% Confidence Interval] for performance variables split by age
group and playing positions ... 80
Table 3. Modelling the associations between Wingate Anaerobic Test and the
performance variables of Speed (20m Sprint Test) and Strength (SJ and CMJ), after adjustment for age ... 81
XI
ABSTRACT
Soccer is the most popular sport in the world and is practiced by both men and women, young people and adults with different levels of specialization. The performance of a soccer player is dependent on the interaction of many factors, such as: technical, tactical, psychological, physiological and biomechanical. In recent years, much research has been conducted on player performance during the game and science has been widely incorporated into training planning. Changes in performance and physiological response throughout the game were studied with a focus on the individual differences in physical stress to which players are exposed in the game.
RESUMO
O futebol é o desporto mais popular do mundo e é praticado tanto por homens como por mulheres, jovens e adultos, com diferentes níveis de especialização. A performance de um jogador de futebol está dependente da interação de diversos fatores, tais como: técnicos, táticos, psicológicos, fisiológicos e biomecânicos. Nos últimos anos, muita pesquisa foi conduzida sobre a performance dos jogadores durante o jogo e a ciência tem sido amplamente incorporada no planeamento do processo de treino. Alterações na performance e resposta fisiológica durante o jogo foram estudadas com foco nas diferenças individuais relativamente ao stress físico a que os jogadores são expostos no jogo.
OBJECTIVES
Article 1
The first article had two purposes: (a) to characterize the anaerobic profile, as measured by Wingate Anaerobic Test (WAnT), in four age groups of soccer players (12-14, 14-16, 16-18 and 18-37) playing in different positions (goalkeepers, defenders, midfielders, forwards); and (b) to analyze inter-individual variability in every position and age group.
XII
The second article had two purposes: (a) evaluate the relationship between performance variables such as Wingate Anaerobic Test (WAnT), 20m Sprint Test (20m test) and Vertical Jump Test (VJ), in four age groups of soccer players (12-14, 14-16, 16-18 and 16-18-37) playing in different positions (goalkeepers, defenders, midfielders, forwards); and (b) to analyze inter-individual variability in every position and age group.
RESULTS
Article 1
There were no statistically significant differences for peak power (Ppeak) between the different tactical positions (p = 0.160; 𝜂2 = 0.008, no effect). There were also no significant interactions between age group and tactical positioning (p = 0.117; 𝜂2 = 0.022,
no effect). The comparison between age groups in the mean power (Pmean) variable
revealed statistically significant differences (p = 0.001; 𝜂2 = 0.227, small effect). Post-hoc tests revealed no differences between the 16-18 and 18-37 age groups, however there are differences between the two older age groups and 12-14 and 14-16 age groups. The highest values of mean power were identified in the 16-18 and 18-37 age groups. The comparison between tactical positions also revealed differences in the Pmean variable (p = 0.001; 𝜂2 = 0.043, minimum effect). In particular, goalkeepers were found to have significantly lower values compared to defenders (p = 0.001), midfielders (p = 0.001) and forwards (p = 0.003). For the fatigue index (FI) variable there were no statistically significant differences between age groups (p = 0.065; 𝜂2 = 0.012, no effect). On the other hand, there were statistically significant differences between tactical positions for the variable in question (p = 0.001; 𝜂2 = 0.041, minimum effect). Specifically, it was found that goalkeepers presented significantly higher values of FI compared to the defenders (p = 0.001) and midfielders (p = 0.001).
Article 2
The analysis of interactions between factors revealed minimum interactions between age groups and playing positions in Ppeak (p = 0.316; 𝜂𝑝2 = 0.057, minimum
effect), Pmean (p = 0.147; 𝜂𝑝2 = 0.072, minimum effect) and CMJ (p = 0.073; 𝜂𝑝2 = 0.084,
minimum effect), 20-m (p = 0.016; 𝜂𝑝2 = 0.107, minimum effect) and SJ (p = 0.011; 𝜂𝑝2 = 0.112, minimum effect).
XIII
Moderate differences between age groups were found on Ppeak (p = 0.001; 𝜂2 = 0.475, moderate effect), Pmean (p = 0.001; 𝜂2 = 0.477, moderate effect), 20-m (p = 0.001; 𝜂2 = 0.431, moderate effect), SJ (p = 0.001; 𝜂2 = 0.349, moderate effect) and CMJ (p = 0.023; 𝜂2 = 0.370, moderate effect).
Pairwise comparison revealed that 12-14 group had lower values of Ppeak than 14-16 (d = 1.022, minimum effect), 16-18 (d = 1.935, moderate effect) and >18 (d = 2.924,
strong effect); lower values of Pmean than 14-16 (d = 0.936, minimum effect), 16-18 (d =
1.824, moderate effect) and >18 (d = 2.917, strong effect); lower values of 20 meters than 14-16 (d = 1.138, minimum effect), 16-18 (d = 1.933, moderate effect) and >18 (d = 3.640,
strong effect); lower values of SJ than 14-16 (d = 0.175, no effect), 16-18 (d = 0.750, minimum effect) and >18 (d = 2.081, moderate effect); lower values of CMJ than 14-16
(d = 0.166, no effect), 16-18 (d = 0.844, minimum effect) and >18 (d = 2.033, moderate
effect). The 14-16 age group had lower values of Ppeak than 16-18 (d = 0.899, minimum effect) and >18 (d = 1.870, moderate effect); lower values of Pmean than 16-18 (d = 0.993, minimum effect) and >18 (d = 1.994, moderate effect); lower values of 20 meters than
16-18 (d = 0.543, minimum effect) and >16-18 (d = 1.517, moderate effect); lower values of SJ than 16-18 (d = 0.649, minimum effect) and >18 (d = 1.898, moderate effect); lower values of CMJ than 16-18 (d = 0.766, minimum effect) and >18 (d = 1.929, moderate effect). The 16-18 age group had lower values of height than >18 (d = 0.954, minimum effect); lower values of Pmean than >18 (d = 0.895, minimum effect); lower values of 20 meters than >18 (d = 0.893, minimum effect); lower values of SJ >18 (d = 0.924, minimum effect); lower values of CMJ >18 (d = 0.922, minimum effect).
No effect between playing positions were found in Ppeak (p = 0.325; 𝜂2 = 0.017,
no effect), Pmean (p = 0.545; 𝜂2 = 0.010, no effect), 20-m (p = 0.078; 𝜂2 = 0.033, no
effect), SJ (p = 0.653; 𝜂2 = 0.008, no effect) and CMJ (p = 0.344; 𝜂2 = 0.016, no effect). We found a positive association between WAnT and both strength determinants, after adjusting for age. We observed a significant variation for the squat jump test (B = 3.91, 90% CI: 2.49, 5.32) and for the counter-movement jump test (B = 3.59 , 90% CI: 2.22, 4.95). An inverse significant association was observed between anaerobic capacity and speed test of the athletes (B = -0.06, 90% CI: -0.10; -0.01), independently of the age. In addition, and after adjusting for chronological age, the anaerobic capacity could independently explain a large proportion of the relative speed (19%) and strength (24-26%).
XIV
CONCLUSIONS
Article 1
Regardless of playing position, there was a significant effect for age in peak power and mean power that can be supported by different adaptations due to differences in the training process and in the competitive process, on the other hand, there were no statistically significant effects for age with respect to fatigue index what can be justified in the younger age groups by the low values found in the peak power that makes the amplitude between the maximum and the minimum values very reduced, and in the older age groups by an increased aerobic capacity. Tests for variance analysis revealed significant effects for position in mean power and fatigue index what can be an consequence of the adaptations arising from the activity profile of the players depending on the positions in which they play, but there were no significant differences in peak power what can be justified by the intermittent demands of the game, what can means that peak power is not accurable to predict performance between different positions. Thus, given the heterogeneity in physiological profile and motor skills in top teams, it is not considered reliable to identify a capacity that by itself can help predict long-term success, therefore, the selection of young players for a certain position based on their physiological ability may be inappropriate.
Article 2
We found that older age groups are superior than the younger age groups in all performance variables analyzed. It were found significant differences between tactical positions in all performance variables. The WAnT seems to be able to predict with a good level the performance of the athletes in the 20m test and VJ.
XVI
LIST OF ABBREVIATIONS
WAnT – Wingate Anaerobic Test 20m test – 20 meters Speed Test VJ – Vertical Jump Test
Ppeak – Peak Power Pmean – Mean Power FI – Fatigue Index
- 1 -
- 3 -
General Introduction
Soccer is the most popular sport in the world and is practiced by both men and women, young people and adults with different levels of specialization. The performance of a soccer player is dependent on the interaction of a many factors such as: technical, tactical, psychological, physiological and biomechanical.
The economic and social impact of soccer has supported the development of the sport worldwide, which allows the creation of infrastructures, the involvement of professionals from different sports sciences, and the incorporation of technology that allows the formation of more and more players refined and of better quality.
In recent years, much research has been conducted on player performance during the game and science has been widely incorporated into training planning. Changes in performance and physiological response throughout the game were studied with a focus on the individual differences in physical stress to which players are exposed in the game.
Currently, the time that each player has to make any impact in the game is very limited and the margin between success and failure of a team may be very small. During a 90-minute game, elite players run an average of 10km/h in a predominantly aerobic regime, with 8 to 10% of this distance being covered in a high-intensity race. Within this context, high intensity actions are still necessary, for example: jump, shot, sprints and changes of direction. Games are mostly decided on two versus two situations and in the final parts of the games. In this context, the physiology of football, especially with regard to fatigue, has become increasingly important and studied.
The core of this work is centred in the evaluation and characterization of the anaerobic profile in soccer players. For this, the work is divided into different phases, such as: literature review, where we make a brief state-of-art about bioenergetic of the game and the principal evaluation protocols used to assess energy systems in soccer players; then, two original papers are presented, focused on the evaluation and characterization of the anaerobic profile in soccer players of different age groups playing in different positions. We finish with the final conclusions of the information previously presented.
- 4 -
1. Characterization of the game
1.1. Game demands
During a game, players travel different distances at different speeds and perform a variety of motor skills. The vast majority of the actions during the game are of low intensity (such as standing still, walking or running slowly) while high intensity actions are less frequent and correspond to only 8 to 10% of the total distance traveled (Carling, Bloomfield, Nelsen, & Reilly, 2008; E. Rampinini, Coutts, Castagna, Sassi, & Impellizzeri, 2007; Stolen, Chamari, Castagna, & Wisløff, 2005).
Although the high-intensity actions represent a small fraction of the player's total activity, they deserve more attention, since it is from these actions that the game outcome can be changed (Grégory Dupont & McCall, 2016), so that the vast majority of training focuses on the development of capabilities that can decide the outcome of these moments, such as accelerations, air confrontations or fast reactions to the loss of ball possession (Grégory Dupont & McCall, 2016).
Di Salvo et al. (2013) recorded an average of 10.8 km per game in the English League and other authors recorded maximum distances of 13.8 km in elite games (Di Salvo et al., 2007; Di Salvo, Pigozzi, González-Haro, Laughlin, & De Witt, 2013; Gregory Dupont et al., 2010; Stolen et al., 2005). Of these absolute values, the same authors, corroborated by other studies, recorded distances between 681 and 693 meters of high intensity running (19.8 to 25.2 km/h) and between 248 and 258 meters of sprint (> 25 km/ h), in a spectrum between 5 and the 11 sprints per game with 1 to 29 meters distance (Bradley et al., 2013; Gregory Dupont et al., 2010). Of the number of sprints performed, most were short-distance (<10m) in comparison to long-short-distance (> 10m), of which 23-30% was explosive nature and 69.5 to 77% were progressively reached (Di Salvo, Gregson, Atkinson, Tordoff, & Drust, 2009; Di Salvo et al., 2010), with velocities close to 32.5km/h in elite games (Bradley et al., 2013).
The recovery time available between high intensity actions is variable and is a characteristic dependent on the unpredictability of the game itself, the level of competition and the difference between the two teams. However, there is evidence that recovery time between high intensity actions (> 19.8km/h) varies between 51 and 61 seconds, but it is possible to verify recovery times of only 20 seconds, in any case, 98% of the time the recovery is of an active nature (Dupont & McCall, 2016). More extreme plays can force players to perform high-intensity actions (> 19.8 km/ h) every 12 seconds (5 actions in a space of 60 seconds) or every 15 seconds (7 actions in a space of 111
- 5 -
seconds) (Dupont & McCall, 2016). The frequency of repeated high-intensity efforts (at least 3 consecutive actions above 19.8 km/ h with a maximum of 20 seconds of recovery between them) is only 1.1 times per game, and these can usually be moments that define the game outcome (Dupont & McCall, 2016).
1.2. Activity profile by tactical position
The literature is extensive and clear in the notion that the differences between positions are too obvious to be overlooked. Perceiving these differences is necessary in order to develop and optimize the preparation of the athletes by position so that they can respond effectively to the demands that they are exposed in the context of the game (Carling, 2013).
1.2.1. Total distance travelled
Regardless of the speed, it is proven that during an elite soccer game, the midfielders (mostly the central midfielders) are those who travel the longest distance, approximately 12 to 13km. On the other hand, the central defenders are the ones that travel less distances per game, 10km or less. The lateral defenders, the wingers and the forwards travel between 10.5 and 11.5km per game (Di Salvo et al., 2007, 2013).
1.2.2. High intensity running
The differences between distance travelled at high intensity and distance covered at high intensity plus the distance covered in sprint are identical. The wingers typically travel the longest distance, 900 and 1050 meters, respectively. Already the distances covered by midfielders, lateral defenders and forwards are of 700 to 765 meters and 900 to 970 meters, respectively. Once again, the central defenders are the ones with the shortest distance with values below 500 and 700 meters, respectively .(V. Di Salvo et al., 2007, 2013).
1.2.3. Sprint distance
The wingers and the forwards are the ones that lead the distance covered in sprint (> 25.2km/h), with values between 260 and 350 meters (Andrzejewski, Chmura, Pluta, Strzelczyk, & Kasprzak, 2013; Di Salvo et al., 2009; Valter Di Salvo et al., 2010). The midfielders are those that have lower values between 140 at 170 meters. (Andrzejewski
- 6 -
et al., 2013; V. Di Salvo et al., 2009; Di Salvo et al., 2010). Sprint distance reflects the accumulation of distance from each sprint and not the actual length of the sprint.
1.2.4. Recovery between high intensity actions
The average recovery time between actions varies between positions as reported in the literature, with the highest mean recovery time for the central defenders (about 195 seconds) and the shortest for the lateral defenders (116 seconds) (Carling, Le Gall, & Dupont, 2012). The most common recovery times (~ 61 seconds) were observed more frequently in central defenders. The lowest frequency of repeated high-intensity efforts with recovery times less than or equal to 30 seconds and between 31 and 61 seconds was observed in the central and lateral defenders respectively (Carling et al., 2012).
1.2.5. Factors that contribute to differences between positions
There are many researchers who have focused their attention on game analysis in order to realize what it is that determines certain positions to travel greater distances and perform more high intensity actions.
The game context (social, competitive and economic importance, result and substitutions) seem to play a decisive role in the players physical performance, so much so that the literature shows that central defenders run less 10 to 17% at high intensity in games in which his team is winning against the games where his team is losing, as well as the forwards players who, compared to the games where his team is losing, travel 15% more at high intensity and achieve 54% more sprint distance (Bradley & Noakes, 2013; Dupont & McCall, 2016). In games considered critical and of great importance, central defenders and lateral defenders reduce the distance at high intensity during the second part of the game. Finally, a substitute after entering the game travels greater total distance and in high intensity compared to the same period when he performs the 90 minutes (Bradley & Noakes, 2013; Dupont & McCall, 2016).
Ball possession is another factor that strongly influences the physical performance of a team throughout the game, in particular the distance travelled in high intensity. When a team is in possession of a ball, the distance travelled is greater for the lateral defenders (498 meters), which are followed very closely by the midfielders and the wingers, being the central defenders (489 meters) and the forwards (331 meters ) who travel the shortest distance, respectively (Di Salvo et al., 2009). When the team is not in possession of the ball, the forwards are the ones with the longest distance (566 meters), running almost
- 7 -
double when compared to when they are in possession of the ball, being that the central defenders are the ones that travel less distance (179 meters) (Di Salvo et al., 2009).
The tactical organization is one of the factors that also influences the exigency that certain position will have in the game. A study by Bradley et al. (2011) that compared the effect of using three distinct tactical organizations (4-4-2, 4-5-1 and 4-3-3) found that there are significant differences in the distances travelled at high intensity, but only when the team is in possession of a ball (Bradley et al., 2011). In a 4-4-2 ball possession situation, forwards, midfielders and defenders travel significantly higher distances in high intensity running. The forwards who play 4-5-1 or 4-3-3 are 37-68% more high-scoring when they are out of possession than the forwards who play 4-4-2 (Bradley et al., 2011). Without ball possession defenders and midfielders travel significantly higher distances at high intensity than when they are in ball possession (Bradley et al., 2011; V. Di Salvo et al., 2009).
The championship where a team plays is another determining factor in the differences between different positions. In a comparison between the English League and the Spanish League there were clear differences between the demands required for each position in the different championships. The central defenders and midfielders (defensive or offensive) of the English League run significantly higher distance in high intensity than the players of the same positions of the Spanish League. The lateral defenders and wingers of the English League, compared to those of the Spanish League, run a large percentage of the total distance in high intensity running, unlike the midfielders (defensive and offensive) that in the Spanish League have a greater percentage of the total distance in high-intensity running, although in the English League the players of this position travel similar distances in attack and defensive actions and the Spanish League players travel significantly more high-intensity distance in attack actions (Alexandre Dellal et al., 2011).
1.3. Practical applications by activity profile by tactical position
There are many factors that influence in general and individual the physical requirement of each position, however, the aim of the soccer is not to notice who runs the most, who makes more sprints or if a team has more high intensity actions than the other. The literature points to other factors than physical, such as technical and tactical ability as the most important to achieve success. Since soccer purpose is to win and not know who runs more, using this data to help the coach make the best decisions has been a huge challenge. Often the data is collected, analysed and sent to the coach, but how do they use
- 8 -
them? How can these data support the coach and boost player performance? Can there be a connection between these two variables? The teams who run the most, are the teams that win more?
The distance covered in high intensity in the second half is significantly lower for the winning team than for the losing team, while there are no significant differences during the first half (Dupont et al., 2010). This evidence can be justified by the fact that when a team is ahead in the marker, aims to maintain that advantage in order to win the game. This means that the team that is at an advantage tries to keep ball possession as long as possible and the team that is at a disadvantage tries to press as much as possible against the opponent, resulting in higher intensity actions (Dupont & McCall, 2016). The total distance travelled at high intensity does not only depend on the physical capacity of the team, but also on the constraints provoked by the opponent, the technical level and the tactical organization of both teams, so that teams with better technical and tactical levels will travel less distance to high intensity (Dupont & McCall, 2016; Stolen et al., 2005), so that in the English League, the worst-ranked teams travelled more distance in high intensity and performed more sprints than the best-ranked teams (Di Salvo et al., 2009).
In addition, to focus only on the distances covered is questionable due to the variation that exists from game to game regardless of the player's position (interindividual coefficient of variation of 42.7%), between positions (interindividual coefficient of variation of 24.9 a 40%) and among players with more minutes in each of the positions (inter-individual coefficient of variation from 36.0 to 52.1%) (Dupont et al., 2010). Team tactics, time in possession of the ball, the context of the game in relation to the their importance or international games or between leagues, for example, are all factors that contribute decisively to this variability of distances travelled, therefore, we have to be cautious in the interpretation of the data and not ignore the importance that these factors have in the dynamics of the team (Bradley et al., 2011; Bradley & Noakes, 2013; Alexandre Dellal et al., 2011; Di Salvo et al., 2013; Gregson, Drust, Atkinson, & Salvo, 2010).
This data can be important and can, for example, help us to: verify the effect that the game system has on the distance travelled in the team and individually (a), to draw the individual profile over time (c) to perceive the influence of a substitution in the game and if the player who replaced a colleague has fulfilled what was expected (d) (Dupont & McCall, 2016).
- 9 -
Thus, in addition to this type of data, qualitative data will have to be taken into account, since, one of the greatest characteristics of an elite player is to be in the right space at the right time, and the distances travelled are only the consequence so that the player achieves this goal (Dupont & McCall, 2016).
The training should therefore focus on optimizing mechanisms to develop physical abilities that allow the player to save effort so that at the right moments can be decisive. Although we know that not all games or moments in the game oblige a player to act at the limit of his physical abilities, it is crucial that the player is prepared for the situations in which he has to do it, as a rule, are the moments that decide the games. In addition, we have seen that the requirements between positions vary and during the game, not infrequently, we see players taking positions that are not always the ones that are more accustomed to playing, having to be prepared for the requirement that it requires. Finally, and because we have seen that a substitute that comes into play plays a decisive role, training should be aimed at allowing players with less playing time to be able to respond effectively to the demands of a football game.
2. Bioenergetic of soccer
A soccer game, given its duration, is mostly dependent on aerobic metabolism, however, it is in actions that occur in the anaerobic metabolism that most games are decided. The mean intensity measured by the percentage of maximal heart rate (HRmax) during the 90 minutes is close to the anaerobic threshold and, in soccer players, it is usually between 80-90% of HRmax (Stolen et al., 2005). Physiologically, it would be impossible maintain this intensity during the 90 minutes, hence that between periods of high intensity recovery periods of low intensity.
Given the nature of the game, it has not yet been possible to accurately and reliably estimate VO2 values during a soccer game, mainly due to constraints with the use of certain measurement equipment. Thus, although there is some disagreement about the accuracy of VO2 estimation through its correlation with heart rate, Stolen et al. (2005), based on studies by authors that corroborate the validity of the VO2 estimation by its relation with HR, determined that the VO2 value for an average intensity of 85% of HRmax would correspond to 75% of VO2max (Stolen et al., 2005). This would correspond to an average VO2 of 45.0, 48.8 and 52.5 mL/kg/min for a player with a VO2max of 60, 65 and 70 mL/kg/min. Thus, assuming these values, a player weighing
- 10 -
75kg will have an energy expenditure of 1519, 1645 and 1772 kcal, respectively, during a game (Stolen et al., 2005).
In addition to the absolute values of VO2max, it seems that the running economy can play a determining role in the performance of a soccer player. At a given intensity, VO2 values for athletes with identical VO2max values may be very different and, even in highly trained athletes, the effort economy in running can vary up to 20%. This variation in the energy cost may be associated with anatomical parameters, mechanical and neuromuscular capacity, especially in the efficiency of the stretch shortening cycle (Stolen et al., 2005). Hoff and Helgerud (2004), cited by Stolen et al. (2005) estimate that a 5% improvement in running economy can increase by 1000 meters the distance travelled by a player in 90 minutes (Hoff & Helgerud, 2004; Stolen et al., 2005).
2.1. Aerobic capacity
In a 90-minute game, players can reach 80-90% of their HRmax, which according to Stolen et al. (2005) will correspond to 70 to 80% of their VO2max, and rarely fall below 65% of their HRmax (Bangsbo, Mohr, & Krustrup, 2006; Stolen et al., 2005). The literature reports VO2max values for soccer players ranging from 50 to 75 mL/kg/min (Haugen, Tønnessen, & Seiler, 2013). These data reflect the importance of the aerobic system during a game, since the ability to recover between repeated efforts and maintaining high intensity levels is crucial in an elite player. Thus, the more developed the aerobic capacity, the longer the player will be able to sustain repeated efforts and the faster he will be able to recover between these efforts (Iaia, Rampinini, & Bangsbo, 2009). The relationship between VO2max and repetitive sprinting ability (RSA) has not yet been clearly demonstrated, since, according to Dupont and McCall (2016), there are studies that prove this relationship as well as others that deny it, and these differences are probably related to the use of different protocols, especially with the disparate use of the number of sprints, sprints distance and recovery time, since the aerobic system will have a more significant participation when the use of a protocol that contemplates sprints in greater numbers and with longer duration and with brief periods of active recovery (Grégory Dupont & McCall, 2016).
In addition to VO2max, VO2 kinetics are reported as an important aerobic quality, related to the ability to maintain performance during repeated efforts in soccer players (Grégory Dupont & McCall, 2016; Ermanno Rampinini et al., 2009). Tomlin and Wenger (2001) suggest that higher VO2 values during a sprint result in less dependence on
- 11 -
anaerobic glycolysis and, therefore, the increased capacity to maintain the power generated. A rapid adjustment of VO2 at the beginning of the exercise can lead to a decisive contribution of oxidative phosphorylation and a diminished O2 deficit (Tomlin, Tomlin, & Wenger, 2001). The optimization of VO2 kinetics allows a better adjustment of the oxidative processes required in the transition from rest to activity, as is characteristic of soccer because of its intermittent nature (Rampinini et al., 2009), which has a great relation with RSA (Dupont et al., 2010). Since there is no significant difference between VO2max values between professional and non-professional players (Rampinini et al., 2009), but there are significant differences between the RSA values of professional players compared to amateur players (Rampinini et al., 2009), we can assume that the kinetics of VO2 may be a selection factor, since in professional players this capacity is significantly more developed than in amateur players.
The importance of aerobic capacity in soccer players is also supported by studies that indicate that there is a significant relationship between aerobic power, final classification and distance travelled (Krustrup et al., 2003; Krustrup, Mohr, Ellingsgaard, & Bangsbo, 2005), and that the decline in technical performance is decreased after exposure to a aerobic training program (Impellizzeri et al., 2008; Ermanno Rampinini et al., 2008), so that several authors show that, for example, in Hungary and Norway or internationally level, the teams or national teams that win the most are those made up of players with better VO2max (Stolen et al., 2005).
Having said that, although VO2max is considered a very sensitive measure for the success of a soccer player, Reilly et al. (2000) suggests that values >60 mL/kg/min should be indicated as a minimum limit for elite players and that players below this threshold will have difficulties reaching the elite of soccer (Reilly, Bangsbo, & Franks, 2000). In addition, the same author also considers determinant to establish reference values that could condition the development of the training program, which should be around 70 mL/kg/min in elite athletes, which is close to those seen in elite middle distance endurance athletes (Haugen et al., 2013), and according to Tønnessen et al. al. (2013) have no logic, since the aerobic requirement in soccer is not comparable to that of a middle distance runner (Haugen et al., 2013).
In addition to the above said, the aerobic component seems to be an important factor in the incidence of injuries in soccer players, since athletes with better aerobic capacity, particularly at maximum aerobic velocity, tend to have fewer injuries than athletes with lower aerobic capacity and respond better to changes in acute training load (Blanch &
- 12 -
Gabbett, 2016; Hulin, Gabbett, Caputi, Lawson, & Sampson, 2016; Malone et al., 2016; Watson, Brickson, Brooks, & Dunn, 2017; Watson, Brindle, Brickson, Allee, & San, 2017).
2.1.1. Influence of tactical position, age and competitive level on aerobic capacity
Tønnessen et al. (2013) conducted a 23-year data collection survey of players of all competitive levels in Norway and found that the mean VO2max values for international and 1st and 2nd-tier Norwegian athletes were 62 to 64 mL/kg/min, values corroborated by Reilly et al. (2000) (Reilly et al., 2000; Tonnessen, Hem, Leirstein, Haugen, & Seiler, 2013). No significant differences were reported between senior and junior players in the relative values of VO2max, but this was not the case for absolute data because of the body mass of junior players. The difference between professional players and amateur players has strong statistical significance (Tonnessen et al., 2013).
For the differences between positions, the lateral defenders are those with the best values (60.53 mL/kg/min), followed by the midfielders (59.53 mL/kg/min), central defenders (57.58 mL/kg/min), forwards (56.52 mL/kg/min) and goalkeepers (50.85 mL/kg/min), respectively (Manari et al., 2016; Tonnessen et al., 2013).
Generalizing the data collected in this study, the values of VO2max collected are better in the pre-season than during the season and the end of the season, although they do not have statistically significant differences. These data are in agreement with the studies of Heller et al. (1992) and Metaxas et al. (2006), cited by Tønnessen et al. (2013) and Manari et al. (2016) (Manari et al., 2016; Tonnessen et al., 2013), but are not corroborated by the studies of Casajus (2001) and Magal et al. (2009), cited by Tønnessen et al. (2013) (Tonnessen et al., 2013), who found better values of VO2max at the end of the season than at the beginning, these data can be justified by the training programs used by the different samples that prioritized the development of different physical capacities throughout the season (Malone et al., 2016; Manari et al., 2016; Tonnessen et al., 2013; Watson et al., 2017; Watson et al., 2017).
2.2. Anaerobic capacity
In soccer, anaerobic metabolism plays a key role in actions such as sprint, jump, shot or tackle. Although aerobic metabolism predominates during play, these explosive and
- 13 -
short-lived actions, involving a variety of muscular actions, are the most likely to determine the final outcome of the game.
For 90 minutes, an elite player is involved in about 150 to 250 high-intensity actions (Bangsbo, Marcello, & Krustrup, 2007) with distances between 15 and 20 meters (Bangsbo et al., 2006; Osgnach, Poser, Bernardini, Rinaldo, & Di Prampero, 2010). Every 90 seconds a sprint lasts between 2 and 4 seconds (Helgerud, J.; Engeng, L.C.; Wisloff, U.; Hoff, 2001; Reilly et al., 2000; Stolen et al., 2005) and that constitute 1 to 11% of the total distance traveled in the game (Stolen et al., 2005), which is equivalent to 0.5 to 3% of total playing time (Helgerud, J.; Engeng, L.C.; Wisloff, U.; Hoff, 2001; Stolen et al., 2005). As mentioned before, sprints are of a different nature, and most of the sprints are within walking distance (0-10m). Thus, the ability to accelerate seems to be more decisive in soccer players than in long-distance sprints (Dupont & McCall, 2016). In any case, although not frequent, long-distance sprints occur mainly in the context of game and should be considered in the training process, since there is a very strong correlation between the exposure to the maximum speed (sprints of long distance) and the hamstring injury (Andrzejewski et al., 2013; Barnes, Archer, Hogg, Bush, & Bradley, 2014; Ekstrand, Waldén, & Hägglund, 2016; Malone et al., 2016).
Regarding the two parts of the game, and in agreement with the activity profile of the athletes from one part to the other, the lactate concentration is lower in the second half of the game and is directly related to the work performed up to five minutes before the collection. The rate of lactate removal is dependent on lactate concentration, activity in recovery periods, and aerobic capacity of the player (Stolen et al., 2005), so that a player with higher VO2max values will have lower blood lactate concentrations at submaximal intensities, due to the optimized ability to recover between repeated high-intensity efforts through an optimized aerobic response, superior lactate removal capacity and increased phosphocreatine regeneration (Stolen et al., 2005). In any case, these same players, at their maximum intensity, will have the same values of blood lactate than a player with lower VO2max values, at their maximum intensity.
2.2.1. Influence of tactical position, age and competitive level on anaerobic capacity
Haugen et al. (2013) conducted an investigation over 15 years to determine the differences between position, competitive level and age, in sprint and vertical jump in elite Norwegian athletes (Haugen et al., 2013).
- 14 -
Regarding to sprint, they found that in the 20m test international players are 1.4% faster than second division players, 2.1% than junior national players, 2.8% of junior players and 3.8% than amateur athletes (Haugen et al., 2013). Norwegian League players are 1% faster than second division players, 1.8% faster than junior national players, 2.6% faster than junior players and 3.5% faster than amateur players (Haugen et al., 2013). At the same distance, 0-20m, the forwards are 1.4% faster than the defenders, 2.5% of the midfielders and 3.2% than the goalkeepers. On the other hand, the defenders are 1.1% faster than the midfielders and 1.8% faster than the goalkeepers (Haugen et al., 2013). Players over the age of 28 are 2% slower than players between 20-22 years, 1,9% than players between 23-25 years and 2% slower than players aged 26-28 (Haugen et al., 2013).
As for vertical jump, the same study by Haugen et al. (2013), found that international players jumped 11.3% more than junior players. Players from the first and second Norwegian League and the national team of juniors jump 5-11% more than amateur and junior players. The midfielders are who jump less, behind the forwards, defenders and goalkeepers, respectively. No significant differences were found in vertical jump in the different age groups (Haugen et al., 2013). The literature agrees that vertical jumping is not an indicator of performance in soccer, with the possible exception of goalkeepers who, on the one hand, are the ones that jump the most, on the other, are also the slowest (Haugen et al., 2013; E. Rampinini et al., 2007; Rösch et al., 2000).
2.3. Interaction between aerobic and anaerobic energy systems
The interaction and relative contribution of the three energy systems during the practice of maximal exhaustive exercise is of undeniable interest. Preliminary attempts to describe the relationship between the energy systems date back to the 1960s and 1970s and although relevant at the time, were considered misleading. Given the repeated proliferation of these works, two common mistakes were installed in the scientific community. First, was to consider that the energy systems respond to the stress imposed by maximal exercise almost sequentially, and secondly, was that the aerobic system responds slowly to these demands of energy, having a small role in determining the performance in short periods of time (Buchheit & Laursen, 2013; Gastin, 2001).
The hydrolysis of ATP represents the immediate source of energy for the occurrence of muscle contraction. Since muscle ATP concentration is extremely low and its complete degradation is prevented by regulatory mechanisms, there are highly regulated chemical
- 15 -
pathways for ATP regeneration, so that muscle contraction does not need to be disrupted (Prue Cormie, Mcguigan, & Newton, 2011; Gastin, 2001). Therefore, there are three different processes that in consonance satisfy the energetic requirements of the muscle.
The first process consists in the division of the high energy phosphogen, phosphocreatine (PCr), that after binding to the ATP stored in the cell, form the ATP-PCr system. The ATP-PCr system, usually mentioned as anaerobic power, lasts between 3 and 15 seconds during actions that require maximal intent or effort (Zupan et al., 2009) and provides the immediate energy in the initial phase of that kind of actions, through the regeneration of ATP at high rates (Gastin, 2001). It can also be explained as the sum of the maximal metabolic rates involved the different energy transfer systems (Heck, Schulz, & Bartmus, 2003). The second process consists in the breakdown of carbohydrates, mainly in the form of muscle glycogen, to pyruvic acid and then lactic acid through glycolysis, without presence of oxygen (Gastin, 2001). Usually is referred as anaerobic glycolysis and it has the ability to sustain what remains of the maximal effort (Zupan et al., 2009). This system is more related to anaerobic capacity, unlike the ATP-PCr system which is related to anaerobic power (Gastin, 2001; Zupan et al., 2009), and is also defined by Heck et al. (2003) (Heck et al., 2003) as the sum of all the work to be obtained from the energy stored in the chemical form. To the set formed by the ATP-PCr system and the glycolite system, we call the anaerobic system. The capacity of the anaerobic system is limited by the amount of energy that can be released in a single maximum effort. The end of the exercise or the forced reduction of its intensity is a result of the rapid reduction of stored PCr and the accumulation of lactate together with the reduction of pH (Gastin, 2001). The third process is the aerobic system, also known as oxidative metabolism, capable of producing the highest amounts of ATP, but unlike the anaerobic system, is unable to respond effectively to energy demands at the beginning of the exercise, regardless of its intensity , given the limitation in providing oxygen to the muscle by the respiratory and cardiovascular systems, due to the limitations imposed by oxidative phosphorylation (Gastin, 2001).
Together, the 3 energy pathways described are able to respond effectively to the high energy demands imposed during sports events (Buchheit & Laursen, 2013; Gastin, 2001). Thus, hypothetically, all physical activities derive some energy from each of the three energy supply processes, and while it is clear that each system is better tuned to provide energy for different types of activity, it does not mean that it does so exclusively. Therefore, through the interaction of the differences between capacity and power of each
- 16 -
of the energy systems, results an efficient and smooth formula to replenish the ATP (Gastin, 2001).
These facts lead us to reflect on the traditionally imposed idea that aerobic metabolism plays an insignificant role during high intensity bouts, and seems clear that energy systems contribute sequentially, but in an overlapping fashion, to the energetic demands of the activity. In addition, it seems clear that the aerobic system plays a very important role in the determination of performance during high intensity bouts and can contribute approximately with same amount of energy as the anaerobic system in maximal efforts of up to 75 seconds (Gastin, 2001).
- 17 -
- 19 -
General Objectives
The main objective of this work is to collect data that can be objectively applied in practice, with the aim of improving the quality of training and, thus, increasing the performance of athletes and teams. For this, it is necessary to characterize soccer players based on some variables such as age, position and the competitive level, so that coaches and other professional involved in the development of the player's abilities understand who they are working with. Thus, within the variable competitive level, players can be grouped as: youth or senior, first or second division, amateur, semi-professional or professional, international or non-international, elite or non-elite; within the variable age, players can be grouped by: rank (under13, under16, under21) or by age groups (12-14,14-16,> 18); within the variable position, players can be grouped: generally (goalkeepers, defenders, midfielders, forwards) or specifically (lateral defenders, central defenders, wingers). This split is essential so that the results collected can have some practical relevance, since only this way it is possible to individualize the intervention. It was for this purpose that it became pertinent to carry out the article 1 where we characterized the anaerobic profile through the WAnT in four age groups of soccer players (12-14, 14-16, 16-18 and 18-37) playing in different positions goalkeepers, defenders, midfielders, forwards) and where we analyze inter-individual variability in every position and age group.
Therefore, it is pertinent to see if in practice it is possible to have access to this information in a simple and time friendly way and without requiring great material and human resources, as it requires a test like the WAnT. Since most teams make evaluations only at the beginning of the season and do not monitor athletes progress on a regular basis throughout the year, coaches lose a tool to evaluate the success of the training program, individual player response to training and the state of readiness of athletes in a return to play phase. Thus, article 2 is directed to the performance evaluation through two field tests and with greater transfer to the actions that decide the game, compared to the WAnT, in order to understand if there is any dependence between the vertical jump and the speed at 20 meters and a laboratory test as the WAnT in four age groups of soccer players (12-14, 14-16, 16-18 and 18-37) playing in different positions (goalkeepers, defenders, midfielders, forwards) while we try to analyze inter-individual variability in every position and age group.
- 21 -
- 23 -
PAPER 1
Caracterização do perfil anaeróbio de jogadores de futebol em quatro grupos etários: estudo transversal
Matos, B., Nikolaidis, P., Lima, R., Bezerra, P., Camões, M., & Clemente, F. M. (2017). Caracterização do perfil anaeróbio de jogadores de futebol em quatro grupos etários: estudo transversal. Revista Portuguesa de Ciências do Desporto, 17(S1.A), 164-171.
- 25 -
Caracterização do perfil anaeróbio de jogadores de futebol em quatro grupos etários: estudo transversal
Bruno Matos1*, Mário Simões1,2, Pantelis Theodoros Nikolaidis3, Ricardo Lima1, Pedro
Bezerra1,4, Miguel Camões1, Filipe Manuel Clemente1,5
1Instituto Politécnico de Viana do Castelo, Escola Superior de Desporto e Lazer, Melgaço, Portugal 2Instituto Politécnico de Maia, Portugal
3Ergometriko, Greece
4Centro de Investigação em Desporto, Saúde e Desenvolvimento Humano, CIDESD, Portugal 5Instituto de Telecomunicações, Delegação da Covilhã, Portugal
*Autor correspondente: [email protected]
Resumo
O presente estudo teve dois objetivos: (a) caracterizar o perfil anaeróbio, medido pelo teste de
Wingate, em quatro grupos etários de futebolistas (12-14, 14-16, 16-18 e 18-37) que jogam em
diferentes posições (guarda-redes, defesas, médios e avançados) e (b) analisar a variabilidade inter-individual relativa a cada posição e à correspondente faixa etária. Avaliaram-se 680 jogadores de futebol masculino. Independentemente da posição em campo, verificou-se um efeito significativo da idade no pico de potência (PP) (p = 0,001; ES = 0,304) e potência média (Pm) (p = 0,001; ES = 0,277). Não se verificaram efeitos estatisticamente significativos da idade na variável índice de fadiga (IF) (p = 0,065; ES = 0,012). Os testes de análise da variância revelaram ainda efeitos significativos do fator posição na Pm (p = 0,001; ES = 0,043) e IF (p = 0,001; ES = 0,041). Não se verificaram diferenças estatisticamente significativas na PP (p = 0,160; ES = 0,008).
Palavras-chaves: índice de fadiga, potência, futebol, avaliação e controlo.
Abstract
The current research had two purposes: (a) to characterize the anaerobic profile, as measured by
Wingate test, in four age groups of soccer players (12-14, 14-16, 16-18 and 18-37) playing in
different positions (goalkeeper, defence, medium, advanced); and (b) to analyse inter-individual variability in every position and age group. A total of 680 male players were evaluated. Regardless of playing position, there was a significant effect for age in peak power (PP) (p = 0,001; ES = 0,304) and average power (Pm) (p = 0,001; ES = 0,277). There were no statistically significant effects for age with respect to fatigue index (IF) (p = 0,065; ES = 0,012). Tests for variance analysis revealed significant effects for position in Pm (p = 0,001; ES = 0,043) and IF (p = 0,001; ES = 0,041). There were no significant differences in PP (p = 0,160; ES = 0,008).
- 26 -
INTRODUÇÃO
O desenvolvimento dos jogadores em resposta a diferentes estímulos de treino pode ser influenciado por diferenças na idade e no perfil físico e fisiológico. Durante a adolescência, as posições em campo, o nível de seleção e competição (local, regional, nacional ou internacional) e a qualidade do treino podem também afetar o seu desenvolvimento [18].
Alguns autores têm feito um esforço para perceber a possibilidade de predizer a habilidade futura de jovens atletas numa modalidade, em particular através da avaliação de parâmetros relacionados com características físicas e fisiológicas [4,7,12,15], variáveis psicológicas [10,20]e as duas em simultâneo [16].
Uma limitação das revisões e estudos publicados nesta área é de que apresentam apenas valores médios e desvios-padrão das variáveis avaliadas que são os valores estatísticos mais utilizados quando se pretende: perfilar as variáveis de performance dos atletas e comparar atletas com diferentes perfis. No entanto, não discriminam a variabilidade inter-individual como reportam Nikolaidis et al. [12].
Apesar de ser menos comum, existem vários estudos que provam diferenças inter-individuais de atletas e que enfatizam a necessidade de direcionar a intervenção para as necessidades dos atletas de acordo com a modalidade que praticam. Em estudos que procuraram diferenças inter-individuais de atletas, foram reportadas diferenças em parâmetros físicos e fisiológicos [6,8,11,12,14,15], psicológicos [5] e variáveis técnico-táticas [2].
Especificamente no futebol, existem vários estudos que caracterizam as exigências fisiológicas do jogo e as características fisiológicas, antropométricas e físicas dos jogadores. Apesar do metabolismo aeróbio ser o sistema energético predominante do jogo, as ações mais prováveis de decidir o desfecho do jogo como saltar, sprintar ou disputar um duelo, são de curta duração e de alta intensidade, portanto, fortemente dependentes do sistema anaeróbio, tanto láctico como aláctico [1,17].
Assim, afigura-se pertinente que parâmetros relacionados com a capacidade e potência anaeróbia sejam avaliados em jovens atletas, de forma a monitorizar a capacidade do atleta e tentar predizer a sua habilidade futura para a modalidade em apreço. Alguns estudos têm mostrado uma associação significativa entre os parâmetros determinados pelo teste de Wingate (TW) e a capacidade anaeróbia e alguns autores
- 27 -
assumem que o trabalho total (Wt), a potência media (Pm) e o índice de fadiga (IF) no TW podem ser usados para estimar a capacidade anaeróbia [1].
Posto isto, o objetivo deste estudo foi: (a) caracterizar o perfil anaeróbio, medido pelo teste de Wingate, em quatro grupos etários de futebolistas (12-14, 14-16, 16-18 e 18-37) que jogam em diferentes posições (guarda-redes, defesas, médios e avançados) e (b) analisar a variabilidade inter-individual relativa a cada posição e à respetiva faixa etária.
MATERIAL E MÉTODOS
PARTICIPANTES
Participaram do estudo 680 futebolistas profissionais e amadores distribuídos pelos seguintes grupos etários: 12-14 (n = 97; 57,72±9,42kg; 1,62±0,09cm; 19,93±2,34IMC; 16,36±4,88%MG), 14-16 (n = 185; 63,00±8,98kg; 1,71±0,07cm; 21,30±2,42IMC; 15,81±4,26%MG), 16-18 (n = 144; 69,11±9,60kg; 1,76±0,06cm; 22,38±2,74IMC; 15,16±3,94%MG) e 18-37 (n = 254; 74,76±7,96kg; 1,78±0,06cm; 23,47±1,84IMC; 14,62±3,62%MG). Todos os jogadores maiores de idade completaram um consentimento de participação e os encarregados de educação dos jogadores com menos de 18 anos aprovaram a participação dos atletas no estudo. O presente estudo seguiu as recomendações da Declaração de Helsínquia para o estudo em seres humanos.
PROCEDIMENTOS
Todos os participantes receberam instrução verbal com a explicação do desenho experimental do estudo. Todos os testes foram realizados sobre a supervisão de um fisiologista do exercício experiente e com domínio sobre todos os testes realizados. Os testes foram conduzidos entre a época 2008 e 2011, em dias da semana entre as 8:00h e as 14:00h. A ordem dos testes foi igual para todos os grupos, iniciando pelas avaliações das características físicas e de seguida pela avaliação das características fisiológicas, com uma duração media de 90 minutos. Todos os atletas realizaram um aquecimento estandardizado que incluía 10 minutos num ciclo ergómetro e 5 minutos de alongamentos dinâmicos.
CARACTERISTICAS FISICAS
A altura e o peso foram mensurados através de um estadiómetro (SECA, Leicester, Reino Unido) e uma balança eletrónica (HD-351, Tanita, Illinois, EUA), respetivamente.
- 28 -
A percentagem de massa gorda foi calculada pela soma de 10 pregas, avaliadas através de um lipocalibrador (Harpenden, West Sussex, Reino Unido), através da fórmula proposta por Parizkova [13]. Foram realizadas, de forma rotativa, três medições de cada prega, sendo usado o valor médio para a soma das 10 pregas.
CARACTERISTICAS FISIOLÓGICAS
O teste de Wingate foi realizado num ciclo ergómetro (Monark Ergomedics 874, Monark, Suécia), com uma resistência igual a 7,5% do peso corporal dos atletas. O hardware mecatrônico registrou cada revolução sendo que o software especializado (Papadopoulos e Nikolaidis, Atenas, Grécia), calculou o pico e a potência média. A partir de uma posição estacionária, os participantes foram instruídos a pedalar o mais forte que conseguissem durante 30 segundos. O teste de Wingate é considerado válido e fiável [3].
ANÁLISE ESTATISTICA
Confirmados os pressupostos de normalidade e homogeneidade da amostra, procedeu-se à execução do teste de ANOVA two-way seguido do teste de partial eta
squared (𝜂2) para o cálculo da dimensão do efeito. O tratamento estatístico executou-se no software SPSS versão 23, para um p < 0,05.
RESULTADOS E DISCUSSÃO
O teste de análise da variância para a variável pico de potência, comparativo entre as diferentes faixas etárias, revelou diferenças estatisticamente significativas (p = 0,001; 𝜂2 = 0,304). O teste de post hoc identificou diferenças estatisticamente significativas entre todas faixas etárias, revelando que os valores médios superiores se associaram à faixa etária 18-37 e os menores valores médios se registaram na faixa 12-14. Não se verificaram diferenças estatisticamente significativas para a variável pico de potência entre os diferentes posicionamentos táticos (p = 0,160; 𝜂2 = 0,008). Não se verificaram, igualmente, interações significativas entre os fatores faixa etária e posicionamento tático (p = 0,117; 𝜂2 = 0,022). Os valores descritivos poderão ser verificados na tabela 1.
Tabela 1. Estatística descritiva (média ± desvio-padrão) dos valores obtidos do Wingate para as diferentes faixas etárias.
- 29 -
[M±SD] [M±SD] [M±SD] [M±SD]
Pico de Potência (W) 9,31±1,05b,c,d 10,44±0,92a,c,d 11,04±0,97a,b,d 11,47±0,92a,b,c
Potência média (W) 7,26±1,13b,c,d 8,18±0,86a,c,d 8,72±0,76a,b 8,83±0,80a,b
Índice de fadiga (%) 41,31±9,17 42,56±8,50 42,11±7,75 44,25±5,71
Diferente estatisticamente de 12-14a; 14-16b; 16-18c; e 18-37d para um p < 0,05
A comparação entre faixas etárias na variável de potência média revelou diferenças estatisticamente significativas (p = 0,001; 𝜂2 = 0,227). Os testes de post hoc revelaram a inexistência de diferenças entre as faixas 16-18 e 18-37 observando-se, no entanto, diferenças destas com as de 12-14 e 14-16. Os maiores valores de potência média foram identificados nas faixas etárias 16-18 e 18-37. A comparação entre posicionamentos táticos revelou, igualmente, diferenças na variável de potência média (p = 0,001; 𝜂2 = 0,043). Em particular, verificou-se que os guarda-redes obtiveram valores significativamente inferiores comparativamente aos defesas (p = 0,001), médios (p = 0,001) e avançados (p = 0,003).
Finalmente, para a variável de índice de fadiga não se verificaram diferenças estatisticamente significativas entre faixas etárias (p = 0,065; 𝜂2 = 0,012). Por outro lado, verificaram-se diferenças estatisticamente significativas entre posicionamentos táticos para a variável em causa (p = 0,001; 𝜂2 = 0,041). Especificamente, verificou-se que os guarda-redes apresentaram valores significativamente superiores de índice de fadiga, comparativamente com os defesas (p = 0,001) e médios (p = 0,001).
DISCUSSÃO
As diferenças estatisticamente significativas entre faixas etárias para as variáveis pico de potência e potência média podem ser suportados por diferentes adaptações decorrentes das diferenças existentes no processo de treino e no processo competitivo, tais como, durações do jogo reduzidas em escalões mais jovens, menor volume de treino semanal nos escalões mais jovens, diferenças maturacionais nos atletas mais novos, anos de exposição à prática e nível e tipo de treino [19]. Além disto, o impacto fisiológico que o próprio jogo tem no atleta tende a ser menor nas faixas etárias mais jovens. Wong et al. [19] reportam que a intensidade do jogo, avaliada pela média da distância total percorrida, pode variar em ~5km dos sub12 à idade sénior, o que implica uma diferente resposta fisiológica em termos de resposta cardíaca e concentração de lactato, por exemplo.
- 30 -
Relativamente à variável índice de fadiga, não foram encontradas diferenças estatisticamente significativas. Estes dados podem explicar-se pelo facto de que ao não se verificarem valores altos no pico de potência e potência média nos grupos etários mais baixos, a diferença entre os valores máximos e mínimos não são também eles elevados, o que naturalmente resulta num índice de fadiga baixo. Por outro lado, em grupos etários mais altos, apesar dos valores máximos e mínimos de potência terem uma maior amplitude, uma capacidade aeróbia aumentada reportada pela literatura, pode justificar a inexistência de significância estatística relativamente aos valores de índice de fadiga.
Quanto às diferenças por posição, não se verificaram diferenças estatisticamente significativas no pico de potência, o que vai ao encontro de estudos reportados por Malina et al. [9] que não encontraram diferenças no perfil anaeróbio por posição, o que pode ser justificado pela natureza intermitente do jogo, podendo o pico de potência não ser um fator discriminativo de performance por posição. Quanto à variável potência média, verificou-se que os guarda-redes apresentaram os valores mais baixos, seguidos por avançados, defesas e médios. Por outro lado, os guarda-redes são os que apresentaram os valores mais altos no que trata à variável índice de fadiga, seguidos por defesas e médios. Os resultados encontrados para estas duas variáveis, potência média e índice de fadiga, são provavelmente consequência das adaptações decorrentes do perfil de atividade dos jogadores que ocupam estas posições, dado que os médios são os que percorrem maiores distâncias no jogo e os guarda-redes os que percorrem menores [17]. Estes dados confirmam os de Gil et al. [4] que encontraram diferenças, tanto no perfil anaeróbio como no perfil aeróbio entre diferentes posições.
Face ao exposto, e conhecendo-se a heterogeneidade no perfil fisiológico e de habilidades motoras em equipas de topo, não se afigura viável identificar uma capacidade que, por si só, possa ajudar a predizer o sucesso a longo prazo, com elevado nível de confiança [15]. Portanto, a seleção de jovens para determinada posição baseada na sua capacidade fisiológica poderá ser desapropriada visto os estudos realizados com o objetivo de investigar diferenças entre posições e o efeito da idade em determinada capacidade apresentarem resultados inconsistentes [19].
Assim, de forma a reunir conclusões práticas para a intervenção diária por parte de treinadores, treinadores de força, nutricionistas ou psicólogos uma avaliação individual deve ser uma prioridade. A caracterização destes perfis pode resultar em informação valiosa para ajustar as exigências e constrangimentos das tarefas e, com isso, o estimulo de treino. Desta forma, a criação de programas de treino pode ser mais direcionada para
- 31 -
as necessidades dos atletas e as variáveis a considerar na deteção de talentos orientadas para a especificidade do jogo, resultando num maior sucesso de todo o processo.
REFERÊNCIAS
Andrade VL, Zagatto AM, Kalva-Filho CA, Mendes OC, Gobatto CA, Campos EZ, Papoti M (2015). Running-based anaerobic sprint test as a procedure to evaluate anaerobic power. Int J Sports Med. 2015;36(14):1156–62.
Ball KA, Best RJ, Wrigley TV (2003). Inter- and intra-individual analysis in elite sport: Pistol shooting. J Appl Biomech. 19(1):28–38.
Bar-Or O (1987). The Wingate Anaerobic Test An Update on Methodology, Reliability and Validity. Sport Med An Int J Appl Med Sci Sport Exerc. 4(6):381–94.
Gil SM, Gil J, Ruiz F, Irazusta J (2007). Physiological and anthropometric characteristics of young soccer players according to their playing position: relevance for the selection process. J strength Cond Res. 21(2):438–45.
Hassmen P, Raglin JS, Lundqvist C (2004). Intra-individual variability in state anxiety and self-confidence in elite golfers. J Sport Behav. 27(3):277–90.
Helgerud J, Støren O, Hoff J (2010). Are there differences in running economy at different velocities for well-trained distance runners? Eur J Appl Physiol. 108(6):1099–105. Hoare DG (2000). Predicting success in junior elite basketball players--the contribution of anthropometic and physiological attributes. J Sci Med Sport. 3(4):391–405.
Lovell R, Towlson C, Parkin G, Portas M, Vaeyens R, Cobley S (2015). Soccer player characteristics in English lower-league development programmes: The relationships between relative age, maturation, anthropometry and physical fitness. PLoS One. 10(9):1–14.
Malina RM, Eisenmann JC, Cumming, SP, Ribeiro B, Aroso J (2004). Maturity-associated variation in the growth and functional capacities of youth football (soccer) players 13-15 years. Eur J Appl Physiol. 91(5–6), 555–562.
Morris T (2000). Psychological characteristics and talent identification in soccer. J Sports Sci. 18(9):715–26.
Nikolaidis P, Ziv G, Arnon M, Lidor R (2012). Physical Characteristics and Physiological Attributes of Female Volleyball Players—The Need for Individual Data. J Strength Cond Res. 26(9):2547–57.
![Table 2. Mean and [90% Confidence Interval] for performance variables split by age group and playing positions](https://thumb-eu.123doks.com/thumbv2/123dok_br/14931034.1001181/81.892.174.725.136.219/table-mean-confidence-interval-performance-variables-playing-positions.webp)