Tiago Jorge Ferreira
Licenciado em Ciências da Engenharia Química e Bioquímica
Hybrid Ionic Liquids/Metal Organic
Frameworks for CO
2/CH
4Separation
Dissertação para a obtenção do Grau de Mestre em Engenharia Química e Bioquímica
Orientador: Doutora Isabel A. A. C. Esteves, Investigadora
Auxiliar, FCT-UNL
Co-orientador: Doutor José M. S. S. Esperança,
Investigador Principal, FCT-UNL
Co-orientador: Doutor Rui P. P. L. Ribeiro, Investigador
Pós-Doc, FCT-UNL
Presidente: Doutor Mário Fernando José Eusébio, Professor Auxiliar, FCT-UNL Arguente: Doutor José Paulo Barbosa Mota, Professor Catedrático, FCT-UNL
Vogal: Doutora Isabel A. A. C. Esteves, Investigadora Auxiliar, FCT-UNL
Tiago Jorge Ferreira
Licenciado em Ciências da Engenharia Química e Bioquímica
Hybrid Ionic Liquids/Metal Organic
Frameworks for CO
2/CH
4Separation
Dissertação para obtenção do Grau de Mestre em Engenharia Química e Bioquímica
Orientador: Doutora Isabel A. A. C. Esteves, Investigadora
Auxiliar, FCT-UNL
Co-orientador: Doutor José M. S. S. Esperança,
Investigador Principal, FCT-UNL
Co-orientador: Doutor Rui P. P. L. Ribeiro, Investigador
Pós-Doc, FCT-UNL
Presidente: Doutor Mário Fernando José Eusébio, Professor Auxiliar, FCT-UNL Arguente: Doutor José Paulo Barbosa Mota, Professor Catedrático, FCT-UNL
Vogal: Doutora Isabel A. A. C. Esteves, Investigadora Auxiliar, FCT-UNL
Copyright © Tiago Jorge Ferreira, Faculdade de Ciências e Tecnologia, Universidade Nova de Lisboa
A Faculdade de Ciências e Tecnologia e a Universidade Nova de Lisboa têm o direito, perpétuo e sem limites geográficos, de arquivar e publicar esta dissertação através de exemplares impressos reproduzidos em papel ou de forma digital, ou por qualquer outro meio conhecido ou que venha a ser inventado, e de a divulgar através de repositórios científicos e de admitir a sua cópia e distribuição com objetivos educacionais ou de investigação, não comerciais, desde que seja dado crédito ao autor e editor.
Faculdade de Ciências e Tecnologia and Universidade Nova de Lisboa have the perpetual right with no geographical boundaries, to archive and publish this dissertation through printed copies reproduced in paper or digital form, or by any means known or to be invented, and to divulge through scientific repositories and admit its copy and distribution for educational purposes or research, non-commercial, as long as the credit is given to the author and publisher.
Agradecimentos
“This is the end, beautiful friend”, já dizia o vocalista de uma das bandas mais famosas dos anos 60. Quem me conhece sabe que a minha pessoa não abre “as portas” facilmente, preferindo estranhar, para depois entranhar. Que é como quem diz que eu normalmente não me dou bem com as pessoas que não conheço, logo à primeira. Se é complexo, se é personalidade, não sei... Não considero ter especial jeito para agradecimentos, mas tentarei o meu melhor!
Esta tese de mestrado começou a 6 de Fevereiro deste ano. Desde então passaram 6 meses de trabalho, trabalho esse que fiz da melhor maneira possível e de que me orgulho. Esta avent ura não teria sequer um início, se não fosse pelos meus orientadores. Por me terem aceitado para trabalhar neste tema, pela excelente e profissional orientação que me deram, pela elevada exigência requerida, pelas críticas construtivas e correções feitas, pelas conversas sobre a temática, pelas trocas de ideias, pela disponibilidade e acompanhamento do trabalho e também pela paciência revelada, quero deixar aqui o meu agradecimento especial à Doutora Isabel Esteves e aos Doutores José Esperança e Rui Ribeiro. Gostava de enveredar na área da investigação científica e esta experiência foi bastante motivadora para querer seguir esse caminho.
Um grande obrigado ao Mestre André Portela que, embora já não s e encontre a trabalhar no grupo, me ajudou a dar os “primeiros passos”, na medição de equilíbrios de adsorção e também na integração no grupo que, também graças a ele, ocorreu de forma mais tranquila e natural do que eu esperava. A sua ajuda e companheirismo sinto que foram inestimáveis. E, embora já lhe tenha dito isto pessoalmente, quero reforçar aqui o meu desejo de um excelente futuro profissional e pessoal. Um grande abraço.
Também quero agradecer à minha colega Vera Pessoa, que me ajudou numa fase ini cial na preparação de alguns dos materiais alvos de estudo nesta tese e também me acompanhou em algumas medições de equilíbrio de adsorção.
Fica também aqui uma palavra de apreço aos meus companheiros de laboratório Elena Surra, Abimaelle Chibério, Inês Ferreira, Ana Martins e Pedro Melo pela boa-disposição e companheirismo no tempo passado no laboratório.
Um importante agradecimento tem de ser feito aqui ao técnico superior Nuno Costa. Sem ele, a caracterização textural dos materiais estaria certamente incompleta. Obrigado também pela paciência demonstrada, visto que o “chateei” várias vezes por causa dos resultados dessas caracterizações, pela ajuda na feitura das minhas primeiras pastilhas de FT-IR e pelo esclarecimento de dúvidas específicas sobre detalhes das técnicas de caracterização.
Quero agradecer também à Doutora Małgorzata Zakrzewska, do grupo de investigação do Professor Manuel Nunes da Ponte, por ter facultado um dos líquidos iónicos utilizados para este trabalho ([C6MIM][B(CN)4]).
Porque a realização desta tese é o culminar de um percurso de 5 anos, quero agradecer aos meus amigos já conhecidos antes da chegada a esta faculdade bem como aos que fiz aqui. Um obrigado aos meus amigos Beatriz de Moura, David Lopes, Rui Ribeiro e Rita Domingos pelas trocas de ideias e discussões relativas à temática da tese; ao Dani el Brízido, Diogo Boto e José Dias pelo interesse manifestado pelo tema da minha tese, apesar seguirem cursos bem diferentes da Engenharia Química.
Por ordem alfabética, fica também um obrigado à Ana Cortes, à Beatriz Nobre, à Bianca Visveshcumar, à Catarina Araújo, à Clarinda Costa, à Diana Kharina, à Filipa Marques, à Jessica Costa, à Margarida Freixo, à Mariana Liberal, à Mónica Cunha, à Neide Gomes, ao Pedro Mendes e à Sara Sequeira pela entreajuda, pelas conversas, pelos almoços, pelos momentos de boa-disposição, pela companhia, pelos trabalhos realizados com vocês, pelo tempo passado nesta faculdade. O vosso carinho e as vossas distintas (maneiras de ser) personalidades continuarão a ser por mim apreciadas.
Quero deixar uma nota de apreço muito especial à Daniela Agostinho. Tu sabes porquê... Conheci pessoas únicas neste curso, mas o carinho que nutro por ti não tem comparação. Não preciso de dizer mais nada. Obrigado pela companhia no piso 5 do Edifício Departamental, durante estes meses.
Também à minha família, que se encontra maioritariamente na Madeira: um muito obrigado à minha avó, aos meus primos, primas, tios e tias pela vossa preocupação, carinho e por me fazerem crescer como pessoa.
O meu último agradecimento vai para os meus pais. E a eles há muitas coisas para agradecer.. . Os sacrifícios que fizeram por mim, aos mais diversos níveis são indescritíveis e eu sou um sortudo por ter dois pais com diferentes, embora complementares, personalidades. O meu mundo muda com as vossas palavras, com as vos sas memórias, com as vossas experiências e, acima de tudo, com as vossas ideias e formas de ver o mundo. Ainda bem que me têm proporcionado a possibilidade de ver e conhecer novos locais, novas culturas, tornando-me mais cidadão do mundo. Não há como agradecer isto. Amo-vos.
E embora não seja pessoa de andar a citar frases, dado o carácter pessoal dela, acabo esta secção com uma frase dita pela pessoa que mais me frustra e que simultaneamente não cessa de me surpreender: “deve ser nossa obrigação zelar pela perfeição”.
Dedicatória
Dedico esta tese de mestrado aos meus pais por tudo o que já fizeram por mim e por tudo o que continuam a fazer por mim no dia-a-dia.
Resumo
Nesta tese produziram-se nove novos materiais compósitos de ZIF-8, uma rede organometálic a porosa (MOF), impregnado com diferentes líquidos iónicos (ILs). Estes novos compósitos, designados genericamente por IL@ZIF-8, foram preparados e caracterizados com o objetivo de serem considerados potenciais adsorventes a aplicar em processos de separação por adsorção, tais como o upgrading ou condicionamento de biogás a biometano.
Numa primeira fase, a mesma quantidade molar de nove ILs diferentes foi incorporada na estrutura do ZIF-8, garantindo uma comparação válida entre as amostras. O efeito da incorporação do IL na capacidade de adsorção dos materiais compósitos foi estudado, bem como a influência do catião e do anião do IL na capacidade de adsorção de CO2 (dióxido de carbono)
e CH4 (metano) e respetivo efeito na seletividade ideal CO2/CH4.
A caracterização textural exaustiva a cada material compósito foi feita com recurso a picnometria de He, adsorção-dessorção de N2 a 77 K, difração de raios-X de pó (PXRD), espectroscopia de
infravermelho com transformada de Fourier (FT-IR) e microscopia eletrónica de varriment o (SEM).
Os resultados de equilíbrio de adsorção-dessorção de CO2 e CH4 nos compósitos mostram que
o catião imidazólio com uma curta cadeia alquílica favorece a capacidade de adsorção para estes materiais. No entanto, quem tem um papel mais ativo de adsorção de gás é o anião e o melhor daqueles que foi testado é o acetato.
Em termos de seletividade ideal CO2/CH4, em traços gerais, as amostras que capturaram menos
gás são as mais seletivas. O compósito C10@ZIF-8 é o material mais seletivo entre 1 e 3 bar; de 4 a 16 bar, C2OH@ZIF-8 é o material mais seletivo, com ganhos médios de quase 25% na seletividade em comparação com o ZIF-8 puro. O compósito C6B(CN)4@ZIF-8 apresenta boa capacidade de adsorção de gás, tendo ao mesmo tempo uma boa seletividade CO2/CH4. O efeito
da quantidade de IL impregnada (loading) foi também estudado. Novas amostras C2OH@ZIF -8 e C6B(CN)4@ZIF -8 foram produzidas com diferentes loadings e caraterizadas com as mesmas técnicas anteriormente mencionadas. Os resultados obtidos de equilíbrio de adsorção para estas amostras foram inconclusivos.
Este trabalho abre assim as portas para um campo de investigação de novos materiais com resultados potencialmente interessantes em aplicações de adsorção, dada a multitude de ILs e MOFs existentes.
Abstract
For this thesis nine new composite materials of ZIF-8, a porous organometallic network (MOF), impregnated with different ionic liquids (ILs) were produced. These new composites, generically named IL@ZIF-8, were prepared and characterized with the purpose of studying their potential use as adsorbents in adsorption separation processes such as biogas upgrading or biogas to biomethane conditioning.
Firstly, the same molar amount of nine different ILs was incorporated in ZIF-8 structure, assuring a valid comparison among samples. IL impregnation effect on the adsorption capacity of the composite materials was studied, as well as the influence of the cation and anion of the IL on the adsorption capacity of CO2 (carbon dioxide) and CH4 (methane) and respective effect on ideal
CO2/CH4 selectivity.
An exhaustive textural characterization was performed for every composite, such as He pycnometry, N2 adsorption-desorption at 77 K, Powder X-Ray Diffraction (PXRD), Fourier
Transform Infrared Spectroscopy (FT-IR) and Scanning Electron Microscopy (SEM).
CO2 and CH4 adsorption-desorption equilibria results indicate that the imidazolium cation with
shorter alkyl chains favours the adsorption capacity for these materials. However, it is the anion that has the key role in adsorption capacity; of all tested, the best one was acetate.
Generally speaking, CO2/CH4 ideal selectivities show that samples with less adsorption capacity
are the most selective. C10@ZIF-8 composite is the most selective material between 1 and 3 bar; from 4 to 16 bar, C2OH@ZIF-8 is the most selective material, with average gains of almost 25% in selectivity when compared to pristine ZIF-8. C6B(CN)4@ZIF-8 presents good gas adsorption capacity, while at the same time showing good ideal CO2/CH4 selectivity.
IL loading effect was also tested, with new C2OH@ZIF-8 and C6B(CN)4@ZIF -8 samples with different loadings being manufactured and texturally c haracterized by the above-mention ed techniques. Adsorption equilibria results for these new samples were inconclusive.
This thesis opens new possibilities for the manufacture of good and selective adsorbent materials for adsorption applications, given the amount of existing MOFs and ILs.
List of Contents
1. Introduction ...1 1.1. Motivation ...1 1.2. Thesis Structure ...4 2. Theoretical Background ...5 2.1. Gaseous mixtures ...5 2.2. Gas Absorption...6 2.2.1. Fundamentals ...6 2.2.2. Absorbents... 12 2.3. Gas Adsorption... 14 2.3.1. Fundamentals ... 14 2.3.2. Adsorbents... 21 2.4. IL@MOF Composites... 25 2.4.1. Computational Studies ... 25 2.4.2. Experimental Studies ... 262.5. Methodologies for Adsorption Equilibrium Measurements ... 28
3. Experimental Work ... 31
3.1. Materials ... 31
3.2. IL@ZIF-8 Composites Preparation ... 34
3.3. IL@ZIF-8 Composites Characterization ... 36
3.3.1. He Pycnomet ry... 36
3.3.2. N2 Adsorption-Des orption Isot herm at 77 K ... 37
3.3.3. Powder X-Ray Diffraction (P XRD)... 38
3.3.4. Fourier Trans form Infrared Spectroscopy (FT-IR) ... 38
3.3.5. Scanning Electron Microscopy (SEM) ... 38
3.3.6. Adsorption Equilibrium Measurements using a Volumetric/Manomet ric Unit ... 39
3.3.7. Adsorption Equilibria Measurements using a Gravimetric Unit ... 45
4. Experimental Results and Data Analysis ... 49
4.1. Testing IL’s Structure ... 49
4.1.1. He Pycnomet ry... 50
4.1.2. N2 Adsorption-Des orption Isot herms at 77 K... 51
4.1.3. Powder X-Ray Diffraction (P XRD)... 56
4.1.4. Fourier Trans form Infrared Spectroscopy (FT-IR) ... 58
4.1.5. Scanning Electron Microscopy (SEM) ... 63
4.2. Testing IL’s Loading ... 70
4.2.1. He Pycnomet ry... 71
4.2.2. N2 Adsorption-Des orption Isot herms at 77 K... 72
4.2.3. Powder X-Ray Diffraction (P XRD)... 74
4.2.4. Fourier Trans form Infrared Spectroscopy (FT-IR) ... 76
4.2.5. Scanning Electron Microscopy (SEM) ... 77
4.2.6. Adsorption Equilibria of CO2 and CH4... 77
5. Conclusions and Future Work ... 81
5.1. Conclusions ... 81
5.2. Future Work ... 83
6. Referenc es... 85
7. Appendixes ... 93
7.1. Appendix A – ILs’ CH4 and CO2 Solubilities ... 93
7.2. Appendix B – Experimental Protocol for IL@ZIF -8 Materials Preparation... 94
7.3. Appendix C – Weighings of ILs and ZIF-8... 95
7.4. Appendix D – Theoretical and Experimental IL Loadings ... 96
7.5. Appendix E – Procedure for the Making of FT-IR Tablets ... 97
7.6. Appendix F – Calibration Procedure for Volumetric/Manometric Apparatus ... 98
7.7. Appendix G – Volumetric/Manometric Procedure for Adsorption Equilibrium Measurements ... 100
7.8. Appendix H - Gravimetric Proc edure for Adsorption Equilibrium Measurements ... 101
7.9. Appendix I – Pure ILs’ Densities ... 102
7.10. Appendix J – He Pycnometry Data... 103
List of Figures
Figure 2.1. Mass transfer of generic component A in absorption and stripping operations ...6
Figure 2.2. Difference between the actual mass trans fer in absorption and film theory concept .8 Figure 2.3. Equilibrium curve and driving forces in absorption phenomenon ...9
Figure 2.4. Solubility of some gases in water. Here, solubility is expressed as the reciproc al of Henry's law constant ... 10
Figure 2.5. Solubility of CO2 and CH4 at 50 °C in 1-hexyl-3-methylimidazolium tricyanomethanide ... 10
Figure 2.6. Effect of liquid flowrate and pressure on the absorption rate ... 11
Figure 2.7. Effect of liquid flowrate and pressure on the percent age of CO2 absorbed ... 11
Figure 2.8. Effect of gas flowrate and pressure on absorption rate ... 11
Figure 2.9. Melting point as a function of cation alkyl chain length in several 1-n-alkyl-3-methylimidazolium salt systems... 13
Figure 2.10. Some cations and anions present in ILs... 13
Figure 2.11. Adsorption and desorption phenomena ... 15
Figure 2.12. Generic isobar ... 17
Figure 2.13. Generic isotherms ... 17
Figure 2.14. Different types of physical adsorption isotherms, according to IUPA C ... 18
Figure 2.15. Different types of hysteresis loops ... 19
Figure 2.16. Upgrading biogas with a PSA process ... 20
Figure 2.17. MOFs structure when int eracting with guest molecules ... 24
Figure 2.18. Comparison of angles in ZIFs and zeolites ... 24
Figure 2.19. Publications regarding IL@MOF materials as of July 2017, discarding membrane -related articles ... 25
Figure 3.1. Post-synthesis methods for IL@MOF preparation ... 34
Figure 3.2. Illustration of some IL@ZIF-8 prepared samples ... 36
Figure 3.3. Volumetric apparatus schematic ... 39
Figure 3.4. The actual volumet ric apparat us ... 40
Figure 3.5. Sample cell and its coupling to the apparatus ... 40
Figure 3.6. In-house developed software layout for pressure readings on the volumetric apparatus... 42
Figure 3.7. Schematic representation of excess and total adsorption ... 43
Figure 3.8. Difference between total, excess and net adsorption quantities ... 44
Figure 3.9. Schematic diagram of the gravimetric unit ... 46
Figure 3.10. Part of the gravimetric unit ... 46
Figure 3.11. The inside of the magnetic suspension balance ... 47
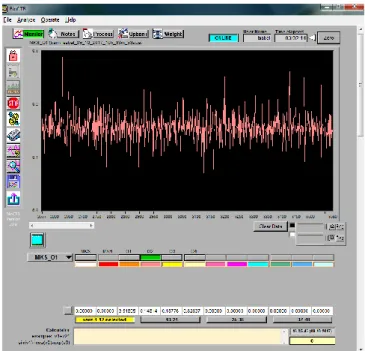
Figure 3.12. In-house developed software layout for pressure readings on the gravimetric apparatus... 48
Figure 4.2. N2 adsorption-desorption isotherms at 77 K of ZIF-8 and manufactured IL@ZIF -8
composites... 52
Figure 4.3. Obtained BET and Langmuir specific surface areas and total pore volume data for ZIF-8 and IL@ZIF -8 composites ... 54
Figure 4.4. Pore size distribution through NLDFT analysis of ZIF-8 and IL@ZIF-8 composites 55 Figure 4.5. PXRD spectra of ZIF-8 and IL@ZIF-8 composites ... 57
Figure 4.6. Comparison between obtained and o pen literature ZIF-8 FT-IR data ... 59
Figure 4.7. Obtained FT-IR spectra of ILs, IL@ZIF -8 composites and ZIF-8... 61
Figure 4.8. FT-IR spectra of [C2MIM][B(CN)4], [C6MIM][B(CN)4] and poly([Pyr11][B(CN)4]) ... 62
Figure 4.9. Micrographs of ZIF-8 and some IL@ZIF-8 composites ... 63
Figure 4.10. SEM and EDS dat a for C6Cl@ZIF-8 ... 64
Figure 4.11. SEM and EDS dat a for P66614@ZIF-8 ... 64
Figure 4.12. CO2 and CH4 adsorption-des orption isotherms at 30 ºC of ZIF-8 ... 65
Figure 4.13. CO2 and CH4 adsorption-desorption isotherms at 30 ºC of ZIF-8 and IL@ZIF-8 composites... 66
Figure 4.14. CH4 and CO2 adsorption-desorption isotherms at 30 ºC of ZIF-8 and IL@ZIF -8 composites... 67
Figure 4.15. Obtained CO2/CH4 ideal selectivities for ZIF-8 and IL@ZIF-8 composites using the Sips adsorption isotherm model ... 69
Figure 4.16. N2 adsorption-desorption isotherms at 77 K of ZIF-8 and manufactured IL@ZIF -8 composites... 72
Figure 4.17. Pore size distribution through NLDFT analysis of ZIF-8 and C2OH@ZIF -8 composites... 74
Figure 4.18. P XRD spectra for all C2OH@ZIF-8 and C6B(CN)4@ZIF-8 samples ... 75
Figure 4.19. Obtained FT-IR spectra of both ILs, IL@ZIF-8 composites tested for IL loading effect and ZIF-8 ... 76
Figure 4.20. SEM micrographs of C2OH@ZIF-8 samples ... 77
Figure 4.21. CO2 and CH4 adsorption/desorption isotherms at 30 ºC of C2OH@ZIF-8 and C6B(CN)4@ZIF -8 samples ... 78
Figure 4.22. Obtained ideal CO2/CH4 selectivities for ZIF-8 and IL@ZIF-8 composites using the Sips adsorption isotherm model ... 79
List of Tables
Table 2.1. Absorbent/absorbate systems commonly employed in the chemical industry ... 12
Table 2.2. Differences regarding physical and chemical adsorption ... 16
Table 2.3. A list of some adsorption-based separations ... 20
Table 3.1. ILs used in the formation of IL@ZIF-8 composites ... 32
Table 3.2. ILs and ZIF-8 structures ... 33
Table 3.3. Desired IL loadings in mass and weight percentage ... 35
Table 3.4. Volumetric/manometric unit reference and cell volumes ... 41
Table 4.1. Experimental composites’ solid matrix densities and respective pure IL density ... 51
Table 4.2. BET specific surface area and respective c constant, Langmuir specific surface area, total pore volume and respective partial pressure for ZIF -8 and IL@ZIF-8 composites ... 53
Table 4.3. FT-IR bands assignments ... 58
Table 4.4. Sips adsorption isotherm model parameters and average relative error obtained for ZIF-8 and IL@ZIF -8 composites ... 69
Table 4.5. Desired IL in mass and weight perce ntage for different IL loadings ... 71
Table 4.6. Experimental solid matrix densities and pure IL densities obtained for samples with different IL loadings ... 72
Table 4.7. BET specific surface area and respective c constant, Langmuir specific surface area, total pore volume and respective partial pressure obtained for samples with different IL loadings ... 73
Table 4.8. Sips adsorption isotherm model parameters and average relative error obtained for ZIF-8 and IL@ZIF -8 composites ... 79
Table 7.1. CO2 and CH4 solubilities found in the open literature for the ILs used in this thesis . 93 Table 7.2. Weighings in the manufacture of IL@ZIF -8 composite materials ... 95
Table 7.3. Comparison between expected and ex perimental IL loadings ... 96
Table 7.4. ILs densities between 5-100 °C. ... 102
Table 7.5. Sample holders' mass and volume (gravimetric unit)... 103
List of Abbreviations
ARE – Average Relative Error CCS – Carbon Capture and Storage CFC – Chlorofluorocarbon
EDS – Energy-Dispersive X-Ray Spectroscopy EU – European Union
FT-IR – Fourier Transform Infrared Spectroscopy GHG – Greenhouse Gas
HDI – Human Development Index IL – Ionic Liquid
IL@MOF – Ionic Liquid impregnated in a MOF IL@ZIF-8 – Ionic Liquid impregnated in ZIF-8
IUPAC – International Union of Pure and Applied Chemistry MOF – Metal-Organic Framework
PSA – Pressure Swing Adsorption PXRD – Powder X-Ray Diffraction RTIL – Room-Temperature Ionic Liquid SEM – Scanning Electron Microscopy STP – Standard Temperature and Pressure TGA – Thermogravimetric Analysis
TSA – Temperature Swing Adsorption USD – United States Dollar
List of Symbols
b – affinity constant
c – BET ‘c’ constant
cA – concentration of generic component A
cAi – concentration of generic component A at the interface
H – Henry’s constant
kG – gas-phase mass transfer coefficient
kL – liquid-phase mass transfer coefficient
m – weighed mass (‘apparent’ mass)
mabs – absolute amount adsorbed
meq K – equilibrium K value
mexc – excess amount adsorbed
mh – mass of sample holder
mnet – net amount adsorbed
ms – mass of the adsorbent sample
MW – molecular weight (of the gas in question)
n – heterogeneity parameter
NA – flux of generic solute A through phase interface
P – total pressure
p/p0 – relative pressure
pA – partial pressure of generic component A
pAi – partial pressure of generic component A at the interface
Ps – vapour pressure
q – specific amount adsorbed
qexc – specific excess adsorption
qnet – specific net adsorption
qt – specific total adsorption
R2 – coefficient of determination
SCO2/CH4 – ideal CO2/CH4 selectivity
Tc – critical temperature
Vcell – cell volume
Vh – volume of the sample holder
Vp – total pore volume
VREF – reference volume
Vs – solid volume
xA – mole fraction of generic component A in the liquid phase
xAi – mole fraction of generic component A in the liquid phase at the interface
yA – mole fraction of generic component A in the gas phase
List of Greek Letters
ϴ – scattering angle
ρg – density of bulk gas at the equilibrium pressure and temperature
ρg – density of bulk gas in the cell volume
ρh – density of sample holder
ρREF – density of bulk gas in the reference volume
ρs – density of adsorbent’s solid matrix
ρ
1. Introduction
1.1. Motivation
The Mauna Loa Observatory, Hawaii, has been monitoring atmospheric CO2 concentration since
1958, longer than in any place on the planet, and the first measurements were of 316 ppm [1]. This value is close to the tropospheric concentration of CO2 before the Industrial Revolution (280
ppm) calculated by T.J. Blasing in 1985 [2]. In May 2013, it was reported that CO2 levels near the
Observatory would soon reach a daily concentration above 400 ppm. Data disclosed from the Mauna Loa Observatory show that, in April 2017, monthly average CO2 levels were of 409 ppm,
higher than the 407 ppm in 2016. Those same data indicate that, since 2016, monthly mean values have been consistently higher than 400 ppm all year long [3].
CO2 is the main greenhouse gas (GHG) concerning the topic of global warming but other gases,
though at lower but rising concentrations on the atmosphere like CH4, N2O and CFCs, can also
contribute to this phenomenon and, consequently, lead to climate change [2, 4]. GHGs are so called because they allow incoming solar radiation to heat Earth’s surface but absorb and re-emit in all directions most of the infrared radiation emitted by the planet’s surface. Without these gases, Earth’s average temperature would be -18 °C instead of the current 15 °C [5]. In contrast, increasing concentrations of GHGs contribute to global warming.
CO2 is typically a product of combustion of carbonaceous fuels [6]. Fossil fuels are included in
this category and their consumption, along with other sources, is the leading cause for GHGs emission [7]. In 2010, about 85% of the world’s energy demand was satisfied by the burning of fossil fuels [8]. In 2014, the burning of fossil fuels dropped to 78% of the world’s energy demand due to investment in renewable energy sources [9].
Some indicators relate CO2 emissions directly with human population. At the time, population is
rising, augmenting the energy demand in several sectors of society and increasing the CO2
emissions [10]. It is worth noting that, even though 2015 and 2016 have been declared ‘the warmest years on record’ [11, 12], global emissions of CO2 have had almost no growth since
2014 [13]. Other phenomena, like El Niño, can explain the rising of global temperature in 2015 and 2016 [11].
Nevertheless, global emissions are currently above 35 Gt on CO2/year [13]. It comes with no
surprise that China, the United States of America, the European Union, India, the Russian Federation and Japan account for more than half of the global emissions of carbon dioxide [11]. These countries, including those who are European Union members, have all medium to very high Human Development Index (HDI) [14], very few are still considered developing countries [15] and they account for more than half of the planet’s population, according to World Bank 2015
along with India a newly industrialized country, and the two are the most populated countries on Earth (about 36.5% of human population) [16].
It is all but unexpected that, according to 2010 data, electricity and heat production, along with industry, make up for almost half of GHGs emission when considering the different economic sectors of society. Once agriculture, forestry and other land use are accounted as a whole, these three sectors sum 70% of global GHGs emissions. Transportation, buildings and others make up the rest of the list of GHGs emitting economic sectors [17].
Increasingly releasing GHGs will eventually lead to a chain of events that include global warming with consequent ice melting and oceans’ rise. The latter can lead to flooding of low-lying territories which could put populations and biodiversity at risk , causing shore retreat. Other possible consequences are the change in the atmosphere due to warmer seas ; warmer, more acid seas results in the loss of numerous life forms; changes in the water and nitrogen cycles can occur; wildfires can happen with more frequency and natural phenomena can be stronger; desertification can be sped up; plant cycles can change and less area for agriculture along with additional water consumption in this particular economic sector can happen, just to name some of them [18, 19]. Some of these changes are already happening with some unwanted frequency.
To attenuate the global and transversal repercussions of Mankind’s GHGs emissions, there have been drawn up some utmost important documents regarding climate change since the 1990s. The first one was The United Nations Framework Convention on Climate Change (1992), one of the three ‘Rio Convention’ adopted, entering into force in 1994 [20]. Its main goal was to ‘achieve (…) stabilization of greenhouse gas concentrations in the atmosphere at a level that would prevent dangerous anthropogenic interference with the climate system’ [21]. Recognizing that there was a problem pertaining GHGs emissions to the atmosphere, the Kyoto Protocol was signed in 1997, entering into force in 2005. The Protocol set a binding emission reduction targets for its Parties, with developed countries having ‘differentiated responsibilities’ since they play a bigger role on the GHGs emissions [22]. The Copenhagen Accord came in 2009, endorsing the continuation of the Kyoto Protocol [23]. Finally, in 2015, the Paris Agreement was adopted; 195 countries accepted the document, agreeing to limit the increase of global average temperature below 2 °C [24].
Following what was agreed on the above-mentioned documents or simply due to the increase of awareness on climate change and its risks, several different policies have emerged. One example is the imposition of a tax on the emission of a certain GHG; not only several countries in the EU have already a carbon tax [25], but the impact of fuel or carbon/GHG tax in the United States of America or China is currently being studied [26, 27, 28].
A second strategy is the exploration and investment in renewable energy sources. In 2015, new investment in renewable power and fuels reached 285.9 billion USD, growing 4.7% in regard to 2014. An interesting fact is that China, the United States of America and Japan are the top 3 countries that invested the most in renewable power and fuels; the United Kingdom and India
complete the top 5. Also comparing with 2014, renewable power capacity grew when considering every kind of renewable energy as well as fuel ethanol production, while biodiesel production decreased. China leads in hydropower, solar photovoltaic, wind power and solar water heating capacities while the United States lead the biodiesel and fuel ethanol production. Amongst these renewable energies is biogas, a mixture of mainly CH4 and CO2, whose sector has been on an
upward trend, with most of it being produced in the United States and in Europe [9]. Though it has a lower percentage of methane than natural gas, it is possible to upgrade (that is, to concentrate) methane in biogas so that it reaches natural gas standards. That can be done using different strategies, one of them being adsorption. Good adsorbents for this purpose would be in contact with an inlet of biogas and the outlet would have higher concentrations of methane, with CO2 being adsorbed by an adsorbent material.
A third approach adopted is the implementation of CCS (carbon capture and storage) technologies [29]. CCS technologies fall typically in three categories: pre-combustion, post-combustion and Oxyfuel post-combustion [30]. Separation techniques can be included in one or more capture method and they are absorption/scrubbing (physical or chemical), cryogenic distillation, membranes, gas hydrates, chemical looping, chemical mineral trapping and adsorption [29, 30]. For the latter technique, microporous materials are typically used and then a temperature swing adsorption (TSA) or pressure swing adsorption (PSA) processes are employed [30]. One recent kind of the aforementioned materials are organic frameworks (MOFs). MOFs are metal-organic crystalline materials built from the coordination of a metal ion or clus ter linked to metal-organic ligands [31]. Much research has been developed on CO2 capture/separation with this family of
materials [32]. Ionic liquids (ILs) are another kind of materials being used to capture/separate CO2
with promising results [33]. In the past few years, it was hypothesized that MOFs could be impregnated with ILs, taking advantage of the behaviour of both materials shown in terms of CO2
capture. The composite material obtained – IL@MOF – presents itself as a relevant case study when considering new materials for CCS or separation of gaseous mixtures [29]. There has been made ground-breaking work about ILs@MOF in terms of computational simulation [34] and creating the composite material itself [35]. Only four articles approach CO2 adsorption [36].
This thesis’ main goal is to open a new window of research in understanding the behaviour of several ILs incorporated in MOF Zeolitic Imidazolate Framework -8 (ZIF-8; commercial name is Basolite® Z1200 from BASF SE) and to discern the difference in the adsorption capacity and ideal CO2/CH4 selectivity of the composite material relative to the pristine ZIF-8. The cation and
anion effects of the IL were studied, as well as the effect of IL loading. Through different textural characterization techniques, such as He pycnometry, N2 adsorption-desorption isotherm at 77 K,
PXRD, FT-IR and SEM, it is possible to assess if the impregnation method of ZIF-8 was successful and determine the composite’s properties such as pore volume and solid matrix density. Their performance in gas adsorption will point to the most selective composite material and, in a bigger picture, indicate if these proposed materials have potential for gaseous mixtures separation.
1.2. Thesis Structure
This thesis is comprised by five chapters:
Chapter 1: Introduction
Chapter 2: Theoretical Background
The chapter addresses the possible gaseous mixtures that can be separated by the composite materials designed in the thesis; the theory related with the phenomena of absorption and adsorption, along with the latest developments in this research field; finally, the methodologies for the adsorption equilibria measurements alongside purification/separation methods of gaseous mixtures are referred.
Chapter 3: Materials and Methods
In this chapter, a listing of all employed chemical compounds is presented, along with an explanation of all the characterization techniques that were necessary to fully describe the developed composite materials. Also included is an explanation of the two units used for adsorption equilibrium measurements.
Chapter 4: Experimental results and Discussion
Included in this chapter are the adsorption equilibria results obtained during this thesis as well as their analysis and respective discussions. It also contains data from the different characterization techniques described in Chapter 3. ZIF-8 data are compared with open literature results to evaluate their consistency.
Chapter 5: Conclusions and future work
Finalizing this thesis is a summary of the work developed and its main conclusions. Suggestions for future work that could optimize the performance of these composite materials are left , as well as the proposal of new adsorption equilibria measurements.
2. Theoretical Background
2.1. Gaseous mixtures
Some gaseous mixtures have a proper designation, such as Mond gas [37], water gas [38], coal (or town) gas [39], syngas [40], and others. From an environmental and/or energetic standpoints, all gaseous mixtures have inherent interest but three of them stand out: flue gas, biogas and natural gas.
Flue gas in a broad sense is any kind of ‘exhaust gas from a combustion process’ [41] but is considered in the Chemical Engineer domain as mainly a mixture of N2 (an inert gas that
constitutes more than two-thirds of its composition) and CO2. It also contains particulates, H2O,
O2 and a small percentage of other gases. CO2 from these streams is typically captured using
amines; this capture method presents several drawbacks such as high energy consumption, cost increases, corrosion problems and degradation of the amines [29, 42]. Therefore, the need for new competitive capture systems [43] and impurities removal methods [44] is topical.
Biogas, a product of the anaerobic decomposition of organic matter, has in its composition 55 to 70% CH4, 30 to 45% CO2, small amounts of NH3, H2S and hydrocarbons. It may also contain
H2O, dust particles, siloxanes and trace amounts of other gases [45]. Due to the rapid
development of biofuels, biogas is in a upward trend [46] that is reflected on the number of scientific papers published (according to a ScienceDirect search, 2011 saw 1690 articles about this topic, while in 2016 more than twice that number were found, totalling 3498 articles), on the number of Master’s thesis regarding this subject [47, 48] and in the actual market. Biogas is, as flue gas, purified via amine absorption [49]. Therefore, new materials for CO2 capture/separation
can lead to a purer stream of CH4 (biogas upgrading), bringing it to natural gas standards, that
can posteriorly be used as an alternative fuel to petrol and diesel [50].
Lastly, natural gas resembles somewhat the composition of biogas with CH4 composition around
75-90%, noteworthy amounts of C2H6, C3H8 and C4H10, 1-3% of other higher hydrocarbons along
with impurities like H2O, CO2, N2 and H2S [51]. Again, amines are employed for CO2 removal and
the search for new materials and/or separation processes are being investigated. Currently , membrane technology is being tested [52] and shows improvements when compared to amines absorption. Imidazolium-based ILs are also being tested as materials capable of efficiently removing CO2 [53].
2.2. Gas Absorption
2.2.1.
Fundamentals
The term absorption used in Chemical Engineering refers to a unit operation where a gaseous mixture is contacted with an absorbent liquid so that one or more components of the mixture (absorbate) is dissolved into the liquid [54]. It is an alternative to distillation for the separation of low molar mass materials [55] and, as described, mass transfer occurs from the gas stream to the liquid (see Figure 2.1.). If mass transfer happens from the liquid stream to the gas, with liquid components separated through gas contact, the operation is called stripping [54]. Both operations are usually used for gas purification, production of gas solutions and product recovery [56].
Figure 2.1. Mass transfer of generic component A in absorption and stripping operations [57].
Depending on the nature of the interactions established between absorbent and absorbate, the operation of absorption can be divided in three categories [58]:
Physical solution: the absorbed component is more soluble in the liquid absorbent than the other gases in which it is mixed. In this case, the equilibrium concentration in the liquid phase is mainly a function of the partial pressure in the gas phase. An example of this kind of absorption is the recovery of light hydrocarbons from oil;
Reversible reaction: a chemical reaction occurs between a component in the gas phase and a component in the liquid phase, forming a compound which will exert a substantial vapour pressure of the absorbed component. An example is the absorption of carbo n dioxide making use of a monoethanolamine solution;
Irreversible reaction: an essentially irreversible chemical reaction occurs between a component of the gas phase and a component of the liquid phase. The compound formed exerts negligible vapour pressure on the absorbed component. An example is the absorption of ammonia by sulphuric acid solution, forming ammonium sulphate.
The physical fundamentals essential to the absorption process are the solubility of the absorbed gas and the mass transfer rate [56].
At equilibrium, a component of a gaseous mixture in contact with a liquid has identical fugacities in both phases. Therefore, considering ideal solutions, Raoult’s law can be applied, as described in Equation 2.1.
𝑦A =
𝑃s
𝑃𝑥A (Eq. 2.1. )
with yA as the mole fraction of generic component A in the gas phase, Ps as the vapour pressure,
P as the total pressure and xA as the mole fraction of generic component A in the liquid. If a gas
component is moderately soluble but has little to none interaction between gas and liquid phases, Henry’s law can be applicable, as described in Equation 2.2.
𝑦A =
𝐻
𝑃𝑥A (Eq. 2.2. )
with H as Henry’s constant. Comparing Equations 2.1. and 2.2., it is easy to reach Equation 2.3.
𝑦A = 𝑚eq K 𝑥A (Eq. 2.3. )
with meq K as equilibrium K value, used to represent hydrocarbon vapor-liquid equilibria in
absorption as well as distillation.
When Equation 2.1. or 2.2. is valid at constant temperature and pressure (the equivalent to constant m in Equation 2.3.), a plot of y=f(x) for a solute is linear from the origin. In other cases, this plot has a linear relationship over a limited region. Normally, for ideal solutions or non-isothermal conditions, a curving relationship between y and x is observed. When applied to an absorber design, this plot is usually called the equilibrium line.
One must not forget, for designing purposes, the rate at which the solute is transferred from the gas to the liquid phase. One of the first theoretical models describing the absorption phenomena proposed a gas-liquid-interface; at a certain distance from this interface, large fluid/bulk motions are assumed to exist distributing material rapidly and in equal manner so that no concentration gradients are formed. However, closer to the interface, the fluid motions are diminished and slow process of molecular diffusion becomes the most relevant mechanism of mass transfer, following Fick’s first law. So, the rate-governing step of the absorption phenomena is the transfer of solute through the gas and liquid films contiguous to the phase interface.
The existence of these films is a premise of the mentioned theoretical model that tried to explain and correlate experimentally measured mass transfer coefficients, the film theory (proposed by Walter G. Whitman in 1923 [59]); it is considered the classical model that tries to approximate the real situation at the interface by having hypothetical ‘effective’ gas and liquid films [56]. It is an inaccurate representation of the conditions at the gas -liquid interface, but has proved itself to be a useful correlation tool for the design of absorption and stripping equipment [58]. Its assumption is that gas and liquid are in equilibrium at the interface and that thin films separate the interfac e from the bulk of the two phases.
A comparison between the actual situation at the interface and the film theory is diagrammatically presented in Figure 2.2.
Figure 2.2. Difference between the actual mass transfer in absorption and film theory concept [58].
If a non-flowing closed system is considered, with the passage of time, a concentration profile would become straight horizontal since bulk gas and bulk liquid reached equilibrium. But in a flowing system, as liquid and gas pass each other, the bulk materials don’t have the necessary contact time to reach equilibrium (e.g., at a certain height in an absorption tower working in counter-current conditions). Solute is therefore continuously transferred from the gas to the liquid phase and concentrations gradients appear when mass transfer takes action, only at a finite rate. The rate equations for the gas and liquid films (Equation 2.4. and 2.5., respectively) show a direct proportion between said rate and the displacement from equilibrium.
𝑁A = 𝑘G(𝑝A− 𝑝Ai) = 𝑘G𝑃(𝑦A − 𝑦Ai) (Eq. 2.4. )
𝑁A= 𝑘L(𝑐Ai− 𝑐A) = 𝑘L𝜌̅(𝑥Ai− 𝑥A) (Eq. 2.5. )
with NA as the flux of generic solute A through phase interface, kG as gas-phase mass transfer
coefficient, pA as partial pressure of generic component A, pAi as partial pressure of generic
component A at the interface, yAi as mole fraction of generic component A in the gas phase at the
interface, kL as liquid-phase mass transfer coefficient, cAi as concentration of generic component
A at the interface, cA as concentration of generic component A, 𝜌̅ as mean density of liquid phase
and xAi as mole fraction of generic component A in the liquid at the interface. Both equations are
composed of mass transfer coefficients (kG andkL for gas and liquid phases, respectively) and
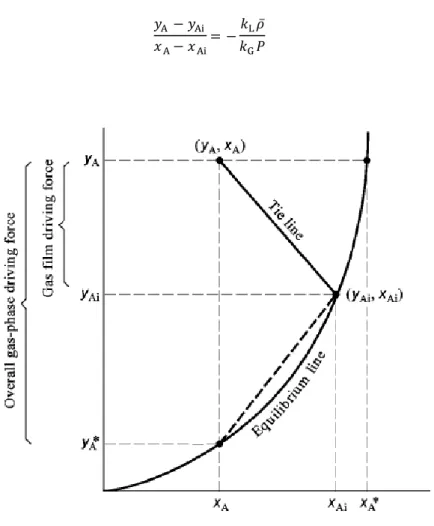
Figure 2.3. has a representation of various concentrations and driving forces in a y=f(x) diagram. The point that represents the interfacial concentrations (𝑥Ai, 𝑦Ai) must be part of the equilibrium
curve because those two concentrations are at equilibrium. The point representing the bulk concentrations (𝑥A, 𝑦A) can be anywhere above the equilibrium line for absorption and below said
curve for stripping. The slope tie line (Equation 2.6.) connecting these two points is given by Equations 2.4. and 2.5. 𝑦A − 𝑦Ai 𝑥A− 𝑥Ai = −𝑘L𝜌̅ 𝑘G𝑃 (Eq. 2.6. )
Figure 2.3. Equilibrium curve and driving forces in absorption phenomenon [56].
Relevant variables for the absorption (and stripping) process are temperature, pressure and liquid flowrate [55]. The following analysis of the effect of one of these degrees of freedom assumes that the other two are kept constant.
An increase in temperature will decrease the absorbate’s solubility in the absorbent [55], as highlighted in Figure 2.4. Absorption consequently is an exothermic process.
Figure 2.4. Solubility of some gases in water. Here, solubility is expressed as the reciprocal of Henry's law
constant [58].
An increase in pressure grants a greater solubility of the absorbate in the liquid phase. There is a practical optimal pressure since high pressures are expensive to generate, due to the energy consumption of the gas compressor [55]. Figure 2.5. illustrates how CO2 and CH4 solubilities
increase in an IL due to pressure increment.
Figure 2.5. Solubility of CO2 (circles) and CH4 (squares ) at 50 °C in 1-hexyl-3-methylimidazolium
tricyanomethanide [60].
Lastly, an increase in the liquid flowrate will lead to an increase in gas absorption. This happens due to the increased interfacial area, which is related to the absorbent’s flowrate. An increase in the interfacial area leads to an increase in mass transfer coefficients because a higher contact area between the two phases is available. Figure 2.6. shows the influence of both absorbent’s flowrate and pressure in absorption rate whilst Figure 2.7. displays the influence of the same two variables on the percentage of CO2 absorbed.
Figure 2.6. Effect of liquid flowrate and pressure on the absorption rate [61].
Figure 2.7. Effect of liquid flowrate and pressure on the percentage of CO2 absorbed [61].
Gas flowrate could also be considered an important variable for gas absorption. Just like liquid flowrate, an increase in gas flowrate leads to higher mass transfer coefficients. Whilst an increment in gas flowrate prompts an increase in the absorption rate, it also causes a decreas e in the gas phase resistance. Overall, an increase in gas flowrate has an increasing, but globally flat, effect on absorption rate, as depicted in Figure 2.8.
2.2.2.
Absorbents
Gas absorption is always possible with any absorbent-absorbate pair, since the gas phase will always be, no matter how low, soluble in the liquid phase. The chemical industry has several combinations of absorbent-absorbate for several applications, listed in Table 2.1.
Table 2.1. Absorbent/absorbate systems commonly employed in the chemical industry [56].
Treated gas Absorbed gas Absorbent Function
Coke oven gas NH3 H2O By-product recovery
Coke oven gas Benzene and toluene Straw oil By-product recovery Reactor gases in
manufacture of formaldehyde from
methanol
Formaldehyde H2O Product recovery
Drying gases in cellulose acetate fibre
production
Acetone H2O Solvent recovery
Refinery gases H2S Alkaline solutions Pollutant removal
Products of combustion SO2 H2O Pollutant removal
Products of combustion CO2 Ethanolamines By-product recovery
Ammonia synthesis gas CO Ammoniacal cuprous
chloride solution
Contaminant removal
Roast gases SO2 H2O
Production of calcium sulfite solution for
pulping
Ionic Liquids (ILs)
Among the novel alternative materials for CO2 capture, ILs have shown great potential in this area
of study. They can be used as solvents and employed in various applications, such as gas purification [29]. ILs are a subset of molten salts; the latter are salts that are in the solid state at STP conditions (0 °C, 1 bar), but enter the liquid state at elevated temperatures , whereas the former are any kind of molten salts that melt below 100 °C. This definition of IL is not exactly consensual since it is based on an arbitrary physical property (melting point). Some authors distinguish ILs and room-temperature ionic liquids (RTILs), the latter considered as having melting temperature below 25 °C [62]. Figure 2.9. shows the different categories of the aforementioned salts.
Figure 2.9. Melting point as a function of cation alkyl chain length in several 1 -n-alkyl-3-methylimidazolium
salt systems [62]. Notice the different categories delimited by the dashed lines.
All ILs are compounds made up of ionic species. They should remain in the liquid state at or below process temperature. The simplest IL contains at least one cation and one anion [29]. Figure 2.10. shows a small group of ions that make part of the ‘ILs’ world’.
Figure 2.10. Some cations and anions present in ILs [62]. From left to right, the cations (top row) are:
ammonium, pyrrolidinium, 1-methyl-3-alkylimidazolium, 1,3-bis[3-methylimidazolium-1-yl]alkane; (second row) phosphonium, pyridinium, poly(diallyldimethylammonium), metal (M+) tetraglyme. The anions contain (third row) halides, formate, nitrate, hydrogen sulfate, heptafluorobutyrate, bis(perfluoromethylsulfonyl)imide, tetrafluoroborate, (bottom row) thiocyanate, hexafluorophosphate, tris(pentafluoroethyl)trifluorophosphate, dicyanamide, poly(phosphonic acid), and tetrachloroferrate.
These compounds can also be categorized in a different manner [29]:
Room-temperature ILs, which are organic salts that melt near room temperature. They possess bulky and low-symmetry cations with a delocalized charge, whilst the anions are more symmetrical and smaller than the cations;
Task-specific ILs, that contain a functional group which is covalently combined into the cation, the anion or both ions of the IL;
Poly(IL)s, which are solids at room temperature and present high CO2 sorption capacity;
ILs based on Jessop’s ‘switchable solvent’ concept, where a non-IL becomes an IL in the presence of CO2. That formed IL can turn back to a non-IL if the CO2 is stripped out with
N2 [63].
In general, ILs are characterized as having suitable properties for several applications, such as non-flammability, negligible volatility, high thermal and electrochemical stability as well as high ionic conductivity [64]. Their high design flexibility allows to tune physical or chemical properties for a desirable application. Owing to their properties, they are used in the study of chemical reactions, catalysis, extractions, gas absorption; they also are promising materials as electrolytes for electrochemical devices, fuel cells or dye-sensitized solar cells [65].
ILs demonstrate good solvency for a wide range of substances, which can be ultimately seen as a drawback due to possible contamination. Low and uncontrolled purity percentages are also a concern in the manufacture of these compounds. In CO2 capture, the IL viscosity can largely
increase [62], and low absorption capacity at lower pressures is verified while using these materials from flue gas emitted by power plants [66]. Cost issues are also relevant: some ILs can still be costly due to their synthesis. Low gas diffusion coefficients are observed when using pure ILs [66].
2.3. Gas Adsorption
2.3.1.
Fundamentals
Adsorption is a millennial phenomenon whose first applications , unknowingly making use of adsorbent materials, can be traced to civilizations like the ancient Egyptians, Greeks and Romans [67]. In more contemporary times (1773), C.W. Scheele made the first quantitative study regarding gas uptake by a charcoal [67, 68]. Large-scale adsorption processes first appeared in the 1920’s in Germany and in the United States of America almost simultaneously; the German process was developed by Bayer AG with the purpose of removing alcohol and benzene from a gas stream while the USA-located process was implemented by the Union Carbide Corporation with the intent of recovering ethane and other higher hydrocarbons from natural gas [58].
The term adsorption refers to the enrichment of one or more components (adsorbates) of either a gas or liquid in an interfacial layer, e.g., at the surface of a solid (adsorbent) [58, 67]. Customarily, the adsorbent is a solid but can also be a liquid if the fluid phase’s components only stick to its surface [68]. When the fluid molecule approaches the solid surface, a balance is created between intermolecular attractive and repulsive forces [67]. That force field creates a low potential energy region close to the adsorbent’s surface and, with that, molecular density near the surface is normally greater than in the bulk fluid [56]. It ought to be noted that if there are already molecules adsorbed to the adsorbent’s surface, interactions adsorbent and adsorbate-adsorbate are established [67]. In a multicomponent mixture, the composition of the bulk fluid will be different from the composition on the surface layer since the components will have different affinities with the adsorbent. The relation between the affinities of different species is named selectivity and it is a parameter of great importance in adsorption applications [56]. When the adsorbate leaves the adsorbent’s surface, the opposite phenomenon of adsorption occurs and is named desorption. In reality, both phenomena occur simultaneously but at different rates. If one examines the number of molecules adsorbed and those desorbed at a given time interval, the dynamic equilibrium observed is called adsorption equilibrium [68]. Figure 2.11. illustrates adsorption and desorption processes and selectivity towards adsorbates.
Figure 2.11. Adsorption and desorption phenomena [68]. Note that Adsorptive 1 has a higher affinity with
the surface than Adsorptive 2. An adsorptive compound is an adsorbable substance in the fluid phase.
It seems apparent by now that the adsorption phenomenon is different from the absorption one. Consider a person and a cake, where the former is the support where sorption will transpire and the latter are the molecules in the fluid phase. In this representation, absorption is the equivalen t of the person eating the cake, whilst adsorption corresponds to said person being splashed in the face with the cake. In more scientific terminology, adsorption is a surface phenomenon that can happen at a given temperature and pressure, whereas absorption is a bulk (or volume) phenomenon which may or may not happen at any temperature and pressure [68].
Depending on the nature of the forces that bind the adsorbate(s) to the adsorbent’s surface, adsorption can be classified as [68]:
Physical adsorption or physisorption, in which the adsorbate is weakly bound to the surface (van der Waals and/or dispersion forces because of the induced dipole-dipole interactions). Desorption is normally reversible and no chemical reactions ensues in this kind of adsorption;
Physico-chemical adsorption, a mixed kind of adsorption characterized by weak bounds between adsorbent and adsorbates but, due to catalytic properties of the former, changes in the latter can follow (e.g., dissociation or moderately strong associations of adsorbed molecules);
Chemical adsorption or chemisorption, where strong, chemical bounds between adsorbates and adsorbent are a feature, mainly because of electron transfer. The adsorbed molecules suffer chemical reaction and the desorption phenomenon is irreversible.
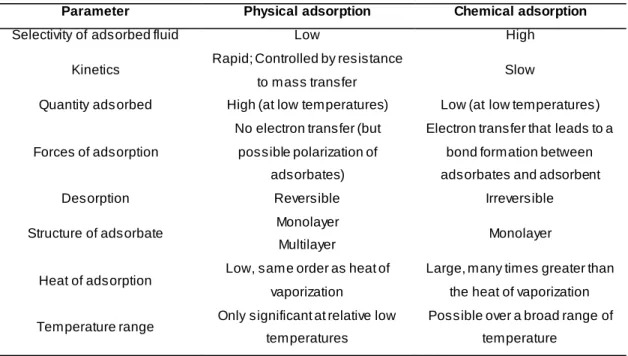
Table 2.2. summarizes the difference in the key aspects between physical and chemical adsorption.
Table 2.2. Differences regarding physical and chemical adsorption [55, 56, 68].
Parameter Physical adsorption Chemical adsorption
Selectivity of adsorbed fluid Low High
Kinetics Rapid; Controlled by resistance to mass transfer
Slow
Quantity ads orbed High (at low temperatures) Low (at low temperatures)
Forces of adsorption
No electron transfer (but possible polarization of
adsorbates)
Electron transfer that leads to a bond formation between adsorbates and adsorbent
Desorption Reversible Irreversible
Structure of adsorbate Monolayer
Multilayer Monolayer
Heat of adsorption
Low, same order as heat of vaporization
Large, many times greater than the heat of vaporization
Temperature range Only significant at relative low temperatures
Possible over a broad range of temperature
Regarding the adsorption capacity, factors related with the adsorbent (e.g., specific surface area) and with the adsorbate (e.g., the nature of the gas) must be considered. An increase in the specific surface area will lead to an increment in active adsorption centres and, consequently, a higher adsorption capacity. About the adsorbate, adsorption is related to its critical temperature (Tc).
adsorbate can happen on a higher temperature range. This is why CO2 (Tc = 31.1 °C) shows a
higher adsorption capacity than CH4 (Tc = -82.6 °C).
Nevertheless, the two variables that are of vital essence are temperature and pressure. Both influence the adsorption capacity and the amount adsorbed is generally plotted as a function of one the variables while the other is kept constant. When pressure is constant, an isobar of adsorption equilibrium is obtained. In contrast, when temperature is kept constant, the obtaining data correspond to an isotherm of adsorption equilibrium and the adsorption capacity differs with pressure. Figure 2.12. and Figure 2.13. show a typical adsorption isobar and isotherm, respectively.
Figure 2.12. Generic isobar [69].
Figure 2.13. Generic isotherms [55].
As seen in Figure 2.13., pressure increments lead to an increase in volume (or amount) of fluid adsorbed while a temperature raise originates a decrease in volume (or amount) adsorbed. Adsorption, like absorption, is therefore an exothermic phenomenon.
Lastly, if the amount of adsorbed fluid is maintained constant, plotting pressure as a function of temperature, the obtained representation is named an isostere.
Normally, adsorption data are expressed through isotherms, existing different types (for physical adsorption) of these depending on the outline they make. These are presented in Figure 2.14.
Figure 2.14. Different types of physical adsorption isotherms, according to IUPAC [70]. The arrow pointing
towards increasing relative pressure shows the adsorption curve; the arrow pointing to the decrease of relative pressure shows the desorption curve.
Physical adsorption isotherms can then be defined as [70]:
Type I, associated to microporous materials with somewhat small external surface. They are reversible and concave to relative pressure axis. They present a limiting adsorption capacity that is related to the micropore volume access . The steep uptake at very low pressures is due to strong interactions between the adsorbent and adsorbate in narrow micropores that fill quite easily. Type I(a) is verified in materials that have narrow micropores (< 1 nm) while Type I(b) is seen in materials that have broader micropores (< 2.5 nm);
Type II, related to nonporous or macroporous adsorbents. They are reversible and the shape is related to monolayer to multilayer adsorption. Point B, identified in Figure 2.14., is where normally the monolayer is completely covered. After point B, a different kind of curvature is observed and it is related with the overlap of the monolayer, thus the starting point of multilayer adsorption;
Type III, where the inexistence of point B hinders the identification of the multilayer formation. Weak adsorbent-adsorbate interactions are verified with the adsorbed molecules clustered in the most favourable sites of the nonporous or macroporous adsorbent;
Type IV, observed in mesoporous materials. The adsorption is dictated by adsorbent -adsorbate interactions as well as interactions between molecules in the condensed state.
The initial behaviour of Type II isotherms is found, with the monolayer-multilayer forming in the mesopores walls. Then, pore condensation occurs: gas condenses to a liquid-like phase in a pore at a given pressure that is inferior to the sat uration vapour pressure of the bulk liquid. This type of isotherm has a final saturation plateau that sometimes is merely an inflexion point. In Type IV(a), hysteresis follows capillary or pore condensation . This happens whenever the mesopore width surpass es a certain critical value that is intrinsic to the adsorbent and is temperature dependent. If mesopores have a smaller width, then reversible isotherms are obtained: Type IV(b);
Type V, in where weak adsorbent-adsorbate interactions are perceived (like Type III isotherms) at low relative pressures. At high relative pressures, molecular clustering followed by pore filling happens. They may describe the adsorption capacity of some microporous or mesoporous materials;
Type VI, that have a stepwise, reversible going that corresponds to a layer-by-lay er adsorption in a uniform albeit nonporous materials. The step-height is equivalent to the capacity of each layer and sharpness of the step is adsorbent and temperature -dependent.
Visible on Figure 2.14. is the possible existence of hysteresis on an adsorption equilibrium isotherm. Hysteresis is a tendency of a system to preserve its properties even in the absence of the stimulus that created them. The value of said property will lag behind changes in the effect causing it. Types IV and V physical adsorption isotherms present hysteresis (that corresponds to the desorption branch on mesoporous materials). This phenomenon materializes in the multilayer range, appearing when the amount adsorbed is not the same on the adsorption and desorption branches at a certain pressure [67], and are associated to capillary condensation [70].
Like the physical adsorption isotherms, hysteresis loops present several different s hapes, as presented in Figure 2.15. These loops are defined by IUPAC and all represent a specific kind of pore structure as well as a subjacent adsorption mechanism [70].
![Figure 2.4. Solubility of some gases in water. Here, solubility is expressed as the reciprocal of Henry's law constant [58]](https://thumb-eu.123doks.com/thumbv2/123dok_br/15133671.1011110/36.893.309.583.105.487/figure-solubility-gases-solubility-expressed-reciprocal-henry-constant.webp)
![Figure 2.6. Effect of liquid flowrate and pressure on the absorption rate [61].](https://thumb-eu.123doks.com/thumbv2/123dok_br/15133671.1011110/37.893.244.649.115.353/figure-effect-liquid-flowrate-pressure-absorption-rate.webp)
![Table 2.1. Absorbent/absorbate systems commonly employed in the chemical industry [56]](https://thumb-eu.123doks.com/thumbv2/123dok_br/15133671.1011110/38.893.126.767.300.777/table-absorbent-absorbate-systems-commonly-employed-chemical-industry.webp)
![Figure 2.15. Different types of hysteresis loops [70]. Upward arrows show adsorption branch; downward](https://thumb-eu.123doks.com/thumbv2/123dok_br/15133671.1011110/45.893.236.661.818.1104/figure-different-hysteresis-upward-arrows-adsorption-branch-downward.webp)
![Figure 3.3. Volumetric apparatus schematic [99]. V – valves; PT – pressure transducer; T – temperature transducer](https://thumb-eu.123doks.com/thumbv2/123dok_br/15133671.1011110/65.893.193.694.509.836/figure-volumetric-apparatus-schematic-pressure-transducer-temperature-transducer.webp)

![Figure 3.9. Schematic diagram of the gravimetric unit [97]. MSB – magnetic suspension balance; PT – pressure transducer; MKS - Baratron model 627D pressure transducer](https://thumb-eu.123doks.com/thumbv2/123dok_br/15133671.1011110/72.893.132.741.102.569/schematic-gravimetric-magnetic-suspension-pressure-transducer-baratron-transducer.webp)