Consequences of stock option expensing with FAS
123R in the US high-tech industry
September 2014
Word Count: 10,871
Diogo Silva Queiroga
152112173
I confirm that this is my own work and the use of all material from other sources has been properly and fully acknowledge.
2
Abstract
With significant equity incentives in its compensation structure, stock option expensing approval affects the compensation structure in the US high-tech industry. A large sample analysis shows that in response to FAS 123R in 2005, the proportion of options offered to CEOs and Top 5 Executives at high-tech firms has decreased, with significance. This in turn does not seem to change, significantly, risk-taking incentives, measured by vega, of CEOs and Top 5 Executives in this industry.
Following the same tendency, a small sample of 10 US high-tech companies presents that non-named executives and employees have suffered a decrease in options offerings from 2002 to 2006 accompanied by the introduction of restricted stock units (RSUs) and the introduction (in some cases) of a binomial option-pricing model. Contradicting this tendency non-employee directors have seen an increase in the level of options granted in the light of FAS 123R.
Key Words: FAS 123R, US, High-tech, Stock options, CEOs, Top 5
3
Table of Contents
Chapter 1 – Introduction ... 6
1.1 Motivation ... 6
1.2 Outline ... 9
Chapter 2 – Literature Review... 11
2.1 Introduction and basic concepts ... 11
2.1.1 Ownership and Convexity ... 12
2.2 Causality in vega-firm risk relation ... 14
2.3 Risk-taking incentives in banks ... 16
2.4 FAS 123 R conceptual framework ... 20
Chapter 3 – Large Sample Analysis ... 22
3.1 Introduction, data and summary statistics ... 22
3.2 Hypothesis Development ... 31
3.2.1 Post- FAS 123R and stock option usage ... 31
3.2.2 Stock option usage and risk-taking behaviour ... 33
3.3 Analysis ... 35
4
3.3.2 Changes in CEO and Top 5 Executives vega ... 41
Chapter 4 – Small Sample Analysis ... 46
4.1 Objectives and sample description ... 46
4.2 Major adjustments to stock options expensing ... 47
4.3 Stock options to non-named paid executives and employees... 50
4.4 Stock options to non-employee directors ... 54
4.5 Main takeaways ... 56
Chapter 5 – Conclusion and further remarks ... 58
Appendices ... 61
Appendix A – Variables Definition ... 61
Appendix B – Additional tests to Large Sample regression results ... 63
Appendix C – Explaining Fixed Effects Regression ... 69
Appendix D – Small Sample Analysis data ... 72
Appendix E – List of Proxy Statements used for small sample ... 73
5
Table 1 – Summary statistics, all sample years (2000-07) ... 26
Table 2 – Summary statistics pre- and post- period CEO (2000-07) ... 28
Table 3 - Summary statistics pre- and post- period Top 5 Executives (2000-07) ... 30
Table 4 – Regression Results for proportion of options (P_option) ... 39
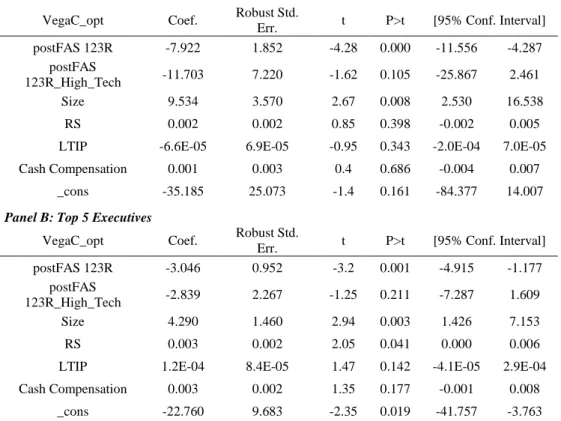
Table 5 – Regression Results for current vega (VegaC_opt) ... 43
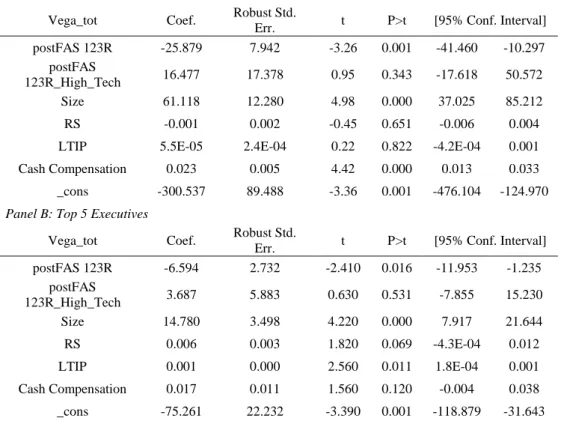
Table 6 – Regression Results for total vega (Vega_tot) ... 45
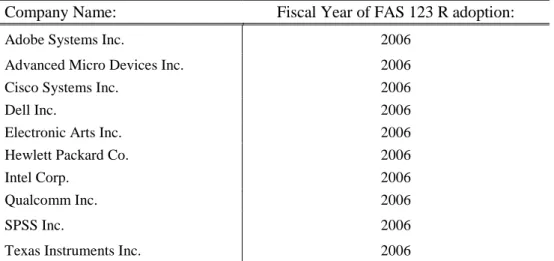
Table 7 – Companies for small sample analysis ... 47
Table 8 – Cisco Systems Inc. impact on net income FAS 123R ... 56
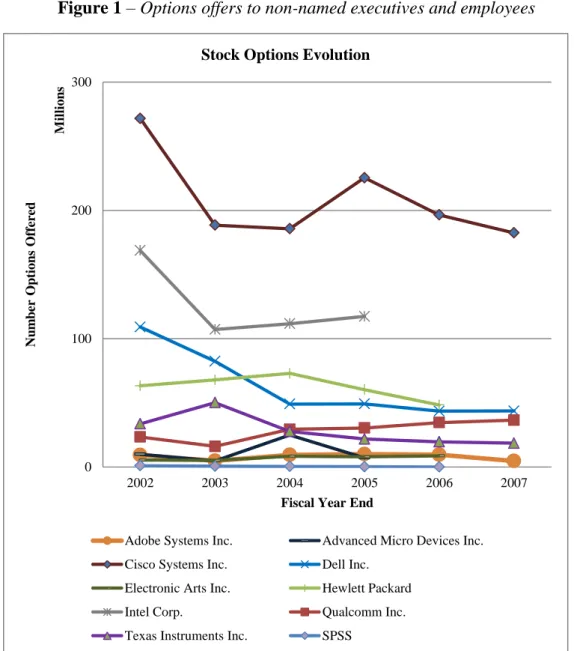
Figure 1 – Options offers to non-named executives and employees ... 51
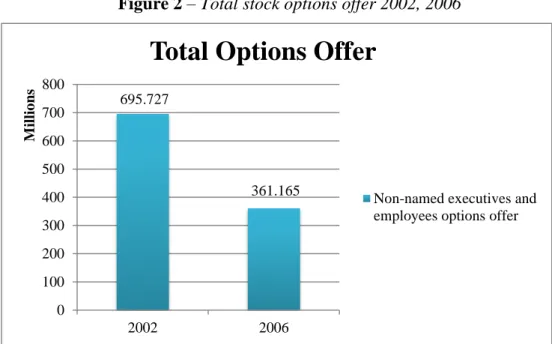
Figure 2 – Total stock options offer 2002, 2006 ... 52
6
Chapter 1 – Introduction
1.1 Motivation
With the intention of extending equity compensation studies for other influential industries, this dissertation focuses in the role of equity incentives – stock options – in US high-tech industry. The technology sector has not only revolutionized traditional business models since the internet boom in the 1990’s, but has also been linked to an interesting remuneration system aimed at creating a “bond” between the employee and the company with the use of equity – namely stock and stock options. Therefore, I intend to study how the introduction of a new regulation demanding stock options expensing – FAS 123R – affected the compensation structure in the high-tech industry and what potential consequences can it have to management’s risk-taking incentives. I will start by measuring the impact of FAS 123R on stock options offerings and risk-taking incentives for CEOs and TOP 5 Executives to further extend the analysis to lower hierarchical levels in the sector.
However before examining the influence of stock option in high-tech one has to frame the role of stock options in the overall compensation structure over the years. Generally, over the last decades one was able to witness remarkable changes over the usage of stock options has a compensation component to reward top executives. According to Murphy (2012), the 1990’s marked a time were stock-option usage more than tripled, boosting CEO pay of S&P 500 from 1990 to 1999. However the beginning of the new century was accompanied by a decrease in executives overall pay not only in the US1 but also internationally, especially
7
during the economic crises of 2008-09. In addition, new regulatory measures2 not only slowed down the usage of stock options but also substituted it as a reward mechanism for restricted stock. Actually, several streams of literature have been focusing on the fact that companies used to perceive stock as a “free grant” with no expenses attached3. As Hall and Murphy (2003) argue, as a result of a favourable accounting treatment, companies used to perceive the cost of options to be lower than its economic cost. But the array of corporate accounting scandals since the 2000s, such as the Enron corporate scandal4 and the Worldcom internal auditing fraud5, call out to the attention of regulators for improved accounting measures. Similar to this issue, Carter et al. (2007) argues that the non-expensing of stock might be one of the reasons why CEO compensation has been increasing over the years. To reduce the public scrutiny surrounding options accounting treatment, FASB stated it would start considering a regulation demanding an accounting expense of stocks6 to have tangible implementation by early 2004. This proposition has since been supported by the International Accounting Standard Board7 that aims at expensing stock in international companies. The influence of the accounting impact implicit in this regulation change seems to be something that concerns not only practitioners but also researchers. Hayes et al. (2012) and Carter et al. (2007) share the same view that accounting represents a major influencer when it comes to the design of compensation contracts. As
2 Details of regulation are described in Hall and Murphy (2003). 3 As stated in Hall and Murphy (2003).
4
For a more detailed overview of the major developments surrounding this case, more information can be found at: http://www.economist.com/node/940091
5 One of the major frauds in recent years with major implications for the auditing industry.
Overview of this case at: http://news.bbc.co.uk/1/hi/business/2066731.stm
6 Detailed description of the regulation can be found at:
http://www.fasb.org/news/nr073102.shtml
7 The IASB as always shown concern over fair value practices related to stock options
expensing. Especially, after the major accounting scandals in the US: http://online.wsj.com/news/articles/SB107713353964432916
8
Hayes et al. (2012) refer, companies foreseeing high damages in earnings arising from stock options expensing are expected to reduce more their option usage than other companies. This might lead one to question if companies that give major importance to option usage for increasing convexity will favour the accounting impact over risk-taking incentives. High-tech companies serve as a good example of this problematic, because they need to incentivise managers to take risks by
disrupting with innovative products, but also, maintain their accounts sustainable.
Considering the above mentioned, it would be interesting to understand how US companies in the technology sector, that rely heavily on stock options incentive plans to attract and retain key employees, reacted to this unfavourable accounting treatment. Additionally, it would be important to understand what are the implications of this measure on the level of convexity of compensations contracts measured by vega. This seems not only relevant for high-tech companies but also to the overall set of public corporations8. How high-tech companies changed their equity compensation plans? Will the size of stock options be reduced in compensation contracts? Will stock options grants be granted to fewer employees? Will companies make an effort to maintain management risk-taking incentives measured by vega? These are all questions that seem worth exploring.
8 By relying less in stock option grants, one would expect non-high-tech companies to be less
9
1.2 Outline
In this dissertation I analyse the impact of FAS 123R on high-tech US companies at several hierarchical levels on a large sample using an ExecuComp dataset, from 2000 to 2007. Firstly, I put my focus on the consequences of FAS 123R stock option offerings for CEOs and Top 5 Executives. I was able to understand that the proportion of options has diminished significantly on CEOs and Top 5 Executives at high-tech firms from 2005 onwards. The average CEO in a high-tech firm as suffered an incremental decrease of 10.7 percentage points in the proportion of options offered after 2005, comparing to all public companies in the sample period. Furthermore, by defining vega as my proxy for measuring risk-taking incentives I recognize that CEOs and Top 5 Executives’ current and total vega for high-tech firms do not seem to be affected with significance by this regulation change. In contrast all other companies (excluding high-tech) in my sample have seen a decrease in CEO and Top 5 Executive’s current and total vega values. This fact – that contradicts my initial hypothesis – led me to a more qualitative research on proxy statements and annual reports of high-tech companies that would enable me to have a solid interpretation of these results. This made me hypothesize that to maintain risk-taking incentives (vega values) high-tech companies recurred to other compensation mechanisms that were creating similar incentives: restricted stock units and indexed stock options are among the most used alternatives.
Finally, I decided to extend my analysis to lower hierarchical levels, with the objective of understanding if non-named executives and employees that still have a major influence at high-tech companies, have seen their level of stock options decrease. By constructing a small sample of 10 major US players in the high-tech
10
business, I realized that since 2005 companies have been reducing the amount of stock options they offer to non-employees. From this overall sample the number of options has decreased almost 52% from 695,721 to 361,165. Inclusively, foreseeing the negative effects of FAS 123R, some companies have excluded options from their compensation mechanisms. Also, it was perceptible that some companies in my sample have adopted a binomial option pricing model – instead of the Black-Scholes module – with the objective of reaching a better precision in valuing options, which is in accordance with FAS 123R principles. The last focus of my study goes to the changes in stock options offerings to non-employee directors, that apparently have seen their level of options increase within the 2002-2006 period. A fact that contradicts the overall tendency of options usage after 2005.
11
Chapter 2 – Literature Review
2.1 Introduction and basic concepts
Agency theory predicts that managers, who are provided with indirect equity holdings, such as stock options, have greater incentives to improve the economic value of the firm (Larcker and Tayan, 2011). This concept relies on the underpinnings of the principal-agent agency problem where the principal cannot perfectly observe the agents actions giving rise to an ex-ante (adverse selection) or ex-post (moral hazard) asymmetric information issue. Also, measuring incentives provided by equity components has always been undermined by endogeneity issues. As Roberts et al. (2012) put it, the major implication related to endogeneity, is that it will bias any regression results, avoiding research to measure the real magnitude of the desired object of study. Nonetheless, stock options usage as a compensation component has always been a relevant topic in academia. And, when measuring incentives from stock options (or any other equity component) researchers focus their attention into two different dimensions of the pay-for-performance relation: ownership and convexity.
12
2.1.1 Ownership and Convexity
In estimating ownership arising from stock options, one has to weight the extent to which options are in or out of the money, which can be assessed using option delta – change in the value of stock option for an incremental change in the stock price. Incentives end up to be low when options are out-of-the-money and eventually comparable to that of stocks when in the money. Aiming to study the magnitude of several incentive mechanisms in compensation policy, Jensen and Murphy (1990)9 suggest a dollar-for-dollar measure for option delta closely associated to managerial percentage ownership10: change in CEO wealth per $1,000 change in shareholder wealth. According to them, the median pay-for-performance sensitivity for stocks and stock options is $2.50 per $1,000 change in shareholder wealth. To a larger extent, the authors advocate that the pay-for-performance sensitivity has been reduced since the 1930s translated into a CEO wealth change of $3.25 for every $1,000 change in shareholders wealth11. However, Hall and Liebman (1998)12 argue that not only Jensen and Murphy’s measures rely on a time horizon associated with the burst of stock options issuance, but also that they focus entirely on CEO wealth changes relative to firm value. So, they propose an alternative way to account for option delta that takes into account the dollar change in option value with respect to a 1% change in stock price. Although they agree that pay-performance sensitivity is majorly driven by changes in the value of stock and stock options – according to them
9
Jensen and Murphy (1990) study composes Executive Compensation Surveys published by Forbes between 1974 and 1986, comprising a total of 1,688 executives from 1,068 firms.
10 Managerial percentage ownership usually refers to the effective CEO ownership that arises
from stock, restricted stock and stock options.
11
The authors justify this reduction in sensibility by hypothesizing that public and private forces might impose constrains to reduce pay-for-performance sensibility.
12 Hall and Liebman (1998) analyses runs from 1980 to 1994 and agglomerates CEO
13
stock and stock options revaluations rise median CEO wealth by $1.5 million for a 10% increase in firm value for US firms – they oppose to Jensen and Murphy (1990) reflection, arguing that CEO compensation and pay-for-performance sensitivity has increased from 1980-1994. To sustain their point they segment firms into percentiles according with their stock performance and explain that total compensation for the median CEO is $1 million if the companies’ stock has a “thirtieth percentile annual return (- 7.0 percent) and is $5 million if the firm’s stock has a seventieth percentile annual return (20.5 percent)”. This shows a great difference in pay between poor performing and good performing companies, indicating great sensibility in the pay-for-performance relation.
Although the slope of the wealth-performance relation – option delta – provides guidance in aligning incentives of managers with those of shareholders, a higher delta might expose managers to too much firm risk. This gives place to the two side-effect of the performance-based pay, arising from the risk-related agency problem: the wealth effect that aligns managers’ incentives with the interests of shareholders, versus, the risk-aversion effect arising from an increased delta that exposes risk-averse managers to more risk. As documented by Smith and Stulz (1985), risk-averse managers might avoid risky, positive net present value projects because they have much of their wealth tied to the firm. May (1995) goes even further and presents empirical findings consistent with the fact that managers with “large stock holdings undertake risk-reducing acquisitions”. This is when convexity “plays its role” in mitigating risk related agency problems arising from delta. Convexity denoted in the wealth-performance relation assesses the sensitivity of managers’ wealth to the volatility of stock price and is majorly measured through option vega: value of managers’ stock options for a given
14
change in stock-return volatility. By measuring vega of options, “as the Black-Scholes partial derivative of option value with respect to a 0.01 change in stock return volatility” Guay (1999) documents that stock options significantly influence the increase in convexity in CEO’s equity-based pay. The author’s results are even complacent with the fact that companies are willing to introduce more convexity in compensation contracts when they know beforehand that the downside of underinvestment by a risk-averse agent is too large (situation that is likely to occur for companies that have substantial investment opportunities). This association study – and not causal effect – motivated further research over the determinants of vega in an attempt to establish a causal relation between vega and corporate policies.
2.2 Causality in vega-firm risk relation
Establishing the direction of causality on the vega-firm risk relation as always proved to be a problem for research, mainly attributed to endogeneity concerns. This works the same when trying to measure the effects of vega on corporate policies or risk, which leads to the question if there is any “underlying and omitted primitive factor” that determines the association between vega and equity risk. By controlling for CEO delta and using refined modelling and econometric empirical methods to control for endogenous issues, Coles et al. (2006) make an effort to go further in research and establish causality between vega and corporate policies. By hypothesizing that higher vega values must result in higher R&D spending, less capital expenditures, decreased diversification and higher leverage, the authors claim to have discovered that a high vega leads to the implementation of riskier policy choices. Fact that leads to the general overview that a higher sensitivity to stock price volatility associated to CEO compensation
15
schemes incentivises managers to pursue riskier policy choices. Moreover, in an effort to extend risk-taking causality analysis to other corporate roles, Chava and Purnanandam (2010) centre their study in CEOs and CFOs different reactions towards financial polices when exposed to different risk-taking incentives. The study explains that CEOs risk incentives are associated with leverage and cash balances while CFOs risk motivations relate more to debt-maturity and “earnings smoothing throw accounting accruals”. It is worth to mention, that the authors come up with a different approach to establish causality by exploiting the accounting standard SFAS 123 (R) that demands stock options expensing (which made options a less attractive remuneration tool). Still, since all companies get affected by this regulation it becomes difficult to create a control group that would track the normal course of events and make it possible to establish a difference-in-difference analysis. Nonetheless, it is generally accepted that stock options influence significantly convexity levels in compensation contracts. Also as Hemmer et al. (1990) state, it seems optimal to increase convexity in manager’s contracts when there is an interaction between incentives and firm risk.
16
2.3 Risk-taking incentives in banks
Given the importance of risk-taking incentives in manager’s actions, several streams of literature were devoted to narrow down this topic and understand how key institutions with major socio-economic roles, such as banks, behave. Risk taking incentives in banks reveals itself as an interesting topic of research due to the role that deposit insurances perform as a self-guard mechanism for depositor’s savings. By reducing incentives to “run to the bank” in case of financial trouble, depositors lose as well their interest in monitoring banks activities giving rise to a moral hazard problem. Bank shareholders are then incentivised to shift risk from the bank to the deposit insurance agency by changing the incentives mechanism given to their top executives. One can actually see the issue as deposit insurances being a put option of shareholders intended to sell the banks’ assets to the deposit insurance entity. Thus, literature devoted to explain the mechanics behind compensation policies in banks is mainly surrounding two main theories: the moral hazard hypothesis stating that compensation policies in banks encourages risk taking in order to maximize the put option value embedded on fixed rate deposit insurances; and the contracting hypothesis that defends compensation policies are just the mere reflection in firm’s investment opportunities set. Based on these opposing views Houston and James (1995) devoted themselves to understand if the level and structure of pay for CEOs in banks is different from industrial firms. According to them banks seem to have a lower market-to-book ratio reflecting that investment opportunities are smaller in banks as this is a heavily regulated industry. Comparing with non-banks, banks present a lower market value of CEO stock holdings, option holdings and value of options granted per year. This appears to offer support for the contracting hypothesis claiming that
17
due to banking regulation limits the investment opportunity set decreases, leading to less need for incentive-based compensation. Also, by controlling for firm size, risk characteristics and bank charter value of 134 commercial banks, the authors’ results present more alignment with the contracting hypothesis. They observe a positive relation between CEO total stock outstanding and market-to-book, supporting the view that higher growth opportunities lead to higher ownership, and vice-versa. In addition, there seems to be no evidence that banks that appear to be “too-big-to-fail”13
receive more equity incentives. Which overall, may lead one to conclude that compensation in banks, although different, it does not incentivize CEOs to take excessive risks. Similar to this problematic John and Qian (2003) devoted themselves to understand if CEO compensation in banks was different from that in manufacturing firms. Based on the fact that banks are regulated, highly leveraged and have a deposit insurance mechanism, they compare pay-performance sensitivities in banks with the sensitivity in manufacturing companies. Using the Jensen and Murphy (1990) measure of dollar change in CEO compensation per $1,000 dollar change in shareholder value these researchers conclude that pay-for-performance sensitivity is lower in banks comparing with manufacturing companies. After regressing direct and firm-related wealth changes towards size, risk and debt ratio, John and Qian (2003) conclude that debt ratios have a significant impact in reducing the pay-performance sensitivity. Although the authors attribute the lower sensitivity to leverage, prior findings of Hirschey and Pappas (1981) or Carroll and Ciscel (1982) attribute also some responsibility to the lower pay-for-performance
13 In this study the term “too-big-to-fail” is meant to refer to banks that have such a huge
weight in the overall economy, making regulators believe that any governing body would try to avoid their collapse and prevent bankruptcy.
18
sensitivity in banks due to the role of regulation. Regulation can serve as substitute mechanism for monitoring top executives actions, which consequently may lower pay-performance sensitivity. Also, if one considers that large banks are usually monitored by several investment analysts, this can actually contribute to increase transparency levels compared to other industries. On the other hand, despite all regulatory measures, banks have been the target of public scrutiny as a consequence of the latest financial crises. Major financial institutions were struggling to survive financial distress periods while being overwhelmed with some corporate scandals violating banks regulation. This fact has called the attention of researchers and practitioners that question themselves if top executives in banking were receiving the right incentives. Some critics defend that one of the major causes was related to the poor long-term incentives put in place for top executives. The excessive bonus plans, for example, made bank CEOs to focus only on short-term performance indicators in detriment to long-term sustainability. Also, stock option plans recalled the previous moral hazard hypothesis by taking the blame of incentivizing CEOs to increase call option values of equity to a less than optimal scenario. Despite that, it is still reasonable to assume that overall equity incentives would make CEOs focus on the long-term. Following this line of thought, Fahlenbrach and Stulz (2011) became interested in understanding if bank performance throughout the financial crises had something to do with the incentives being provided by shareholders before the crisis. The focus is not in the size of compensation but on the incentives effect of the compensation. In their sample of S&P ExecuComp 95 bank holding companies and investment banks it is perceptible that the majority of CEO compensation comes from performance-based pay. The value of the equity
19
portfolio is in fact more important to CEOs comparing to non-executives that value more cash bonus awards. Hence it would be expected that CEOs with better incentive alignment – meaning more wealth tied to the firm – would take less risky investments once they had more to loss. And by risking less it could be that better performance would be expected in the future, especially in financial distress periods. Opposing to this view the authors actually state that banks with better incentive alignment perform worst during the financial crisis. Along with decreases in performance it appears that CEOs have suffered great losses on their overall wealth, with some of them increasing their percentage holdings right before the eruption of the crisis events.
20
2.4 FAS 123 R conceptual framework
Equity-based compensation accounting regulation dates as late as 1972 when the Accounting Principles Board (APB) issued APB Option 25. This piece of regulation stated that stock-based compensation should be recorded at its intrinsic value. By intrinsic value one refers to the difference between the market price of the stock and its exercise price. Also, APB 25 only demanded the expense of stock compensation if the exercise price was less than the existent price at the grant date (the date where the exercise price and the number of shares are known). However, in 1993 the Financial Accounting Standards Board (FASB) – the successor of APB – emitted a draft requiring companies to state the value of stock-option grants granted to employees as a compensation expense in the year the grant was made. This urged a round of protest from some industries – especially from the high-tech sector – that were granting large amounts of stocks options and feared a downturn on performance indicators with the reduction of earnings. With this concern in mind FASB issued a final regulation, FAS 123, that although was appealing companies to expense stock option grants, it was allowing them to use APB 25 as a reporting reference. Thus, between 1995 and 2005, companies were reporting equity-based compensation under FAS 123 having the option to expense (or not) stock-option grants.
Everything appeared to be stable when FASB decided to challenge the status quo and released an amended version of FAS 123 in 2004. This revision, named FAS 123R, forced companies to comply with the principal of fair value accounting in the Income Statement. Meaning that from June 15, 200514, all
14 Later on this date was revised for January 2006 following the polemics created by this rule
21
public companies – that do not file as a small business issuer – were obliged to expense stock-options at fair value. The major implication of this was that, before FAS 123R firms were allowed to expense stock options at its intrinsic value. Considering most companies grant their options “at the money”, firms ended up not recognising any expenses for option-based compensations in its annual reports. This (favourable) accounting treatment represented a major advantage for companies, especially if they attribute more value to the perceived cost of options than to its economic cost. In fact, Hall and Murphy (2003) argue that this practice makes the perceived cost of options to be lower than their economic cost. However, after 2005, FAS 123R mandated that all stock options must be expensed at fair value. Now, stock options are measured by fair value resulting in a compensation expense in the Income Statement. So, if firms give more value to the perceived cost (instead of economic cost) of options, they will presumably change their incentive plans and executive compensation packages to offset the disadvantages of stock options accounting treatments15. If one considers that the high-tech sector is mainly characterized by offering substantial equity awards – mainly stock and stock option – to retain key employees, FAS 123R will have a major impact on this sector’s activity. Not only in reformulating its compensation structure but also in maintaining convexity in compensation contracts with options offerings. Therefore, Chapter 3 and 4 will focus on the influence of FAS 123R in stock options usage and major implications in risk-taking incentives for all public firms with major focus in high-tech companies at several hierarchical levels: CEO; Top 5 Executives; Non-executive employees; Non-Employee Directors.
15 In relation to other equity forms of compensation they were not so majorly affected by
FAS 123R. Restricted Stock, for example, is essentially viewed “as a fixed option with an exercise price of zero” (Hayes et al. 2012), so its accounting treatment is its fair value at the grant-date. Additionally, although equity awards and long-term equity incentives awards has suffered slighter changes it did not have the same impact compared to stock options.
22
Chapter 3 – Large Sample Analysis
3.1 Introduction, data and summary statistics
I use the ExecuComp database as my source to calculate CEO and Top 5 Executives16 compensation separately. This dataset contains compensation information from fiscal year 2000 to 2012. My panel data analysis measures changes in compensation structure from 2000 through 2007. FAS 123R became mandatory for all public entities – that do not file as a small business issuers – at June 15, 200517. I decide to define the post-FAS 123R period as January 2006 to December 2007, with my pre- period being from January 2000 to December 2005. This will allow me to capture the real effect of this measure after the adjustment period that companies had to pass by in 2005. Although there were some early adopters18 already implementing this procedure in their reports, I strongly believe they are a small minority that will not influence final results. In addition, my intention is to establish the strongest relation possible between the ruling introduction, changes in options grating and consequently changes in vega. Extending my analysis further than 2007 could undermine the overall regression analysis, considering the financial crisis period that follows. Dodd-Frank Act
16 My variable for Top 5 Executives was created by sorting the data by total compensation
and generating a dummy variable that would assemble a number for 1 to 5, excluding the CEO, for the 5 highest paid executives in each firm.
17 It is worth mention that although the general rule was June, 2005 several exceptions were
opened and FAS 123R became completely mandatory for some companies in January 2006.
18
Some companies were already expensing stock options in their accounts to mitigate the abrupt change in performance indicators in 2006. Microsoft, for example, started as early as 2003. However, it is worth mention that including 2005 in the post-FAS 123R period does not change the magnitude of my results. Also, Warren Buffet was a major proponent of this law approval. So basically all the companies he was the major stockholder of companies where he was serving at the board of directors started the early adoption of FAS 123R. The Coca Cola Company, The New York Times, The Washington Post (owned by Graham Holdings Company) are some of the most sounding examples of early adoption.
23
(2010)19 combined with other legislation, introduced several changes around executive compensation that make it more difficult to extract the real effect of FAS 123R on high-tech or any other company. Also, I require that all firms have at least one year of data in the pre- and post-FAS 123R period. In resemblance to Hayes et al. (2012), I exclude financial firms – with standard industrial classification (SIC) code from 6000 to 6999 – and utility firms – with SIC code from 4900 to 4999. These firms operate in a quite specific market environment, abiding to detailed regulation and restrictions that influences their overall behaviour. As Fama and French (1992) put it, financial firms, for example, have high leverage ratios which are considered normal for the industry, but might be interpreted as financial distress comparing with other activities. So, excluding them seems to be a better option for the sake of results interpretation.
Moving on to qualitative characteristics of the data it is worth mention one detail. All of the data collected – for the proportion of salary, bonus, grants of stock options, grants of restricted stock and long-term incentive awards – does not take into consideration further changes in reporting requirements implemented by SEC within this period. In contrast to Hayes et al. (2012) I do not incorporate new disclosure rules that end up redefining some compensation components as the case of bonus20. Because I take for granted the assurance of consistency in
19 The Dodd-Frank was signed in July 2010 by President Barack Obama and is majorly
aimed at regulating financial market in an attempt to avoid another financial crisis similar to the one started in 2008. The introduction of a new independent organization to protect consumers, the extinction of the Too big to fail rule, the introduction of rules to protect investors such as “say on pay” and the introduction of tougher rules for transparency and accountability are among some of the new measures brought up by this act (www. http://www.cftc.gov/lawregulation/doddfrankact/index.htm).
20 Hayes et al. (2012) mention new disclosure rules end up reclassifying some bonuses as
non-equity incentives compensation, which changes the way this component is accounted for proxy statements.
24
measurements across time, I believe that changes within this period will not affect my main variables of study: option grants and vega.
Besides the compensation components for the CEO and Top 5 Executives I present summary statistics for high-tech firms, extracted with Compustat from 2000 to 2007. Market-to-book (MTB) is computed as the market value of equity plus total liabilities (TL), divided by total assets (TA). Research and development (RD) is deflated by Total Assets (RD/TA) and capital expenditures (CAPEX) is deflated by total assets (CAPEX/TA). Size is the logarithm of total assets and tenure represents the years the CEO is on the job.
I merge both the ExecuComp data with Compustat for the CEO in one file and similar to that for the Top 5 Executives in a separate file. In both merged files I create a dummy variable to segment the data for high-tech (High_tech) companies. High-tech companies are defined using the Fama and French classification of 48 industry groups, taking the value of 1 if the firm is operating in an industry with a four-digit SIC code equal to: 3570, 3571, 3572, 3576, 3577, 3661, 3674, 4812, 4813, 5045, 5961, 7370, 7371, 7372 or 7373.
The full sample for the CEO and Top 5 Executives, for high-tech companies is presented in Table 1. Details about the calculation of the proportion of each compensation component are presented in Appendix A. I follow previous literature (Guay, 1999; Coles et al. 2006) to compute the sensitivities of annual compensation to changes in stock price expressed by vega. Thus, current vega (VegaC_opt) is calculated as the change in value of CEO or Top 5 Executives’ annual equity-based compensation for a 0.01 change in stock price volatility. Similarly, I compute the sensitivities for the CEO and Top 5 Executives’ total
25
portfolio of current and outstanding prior grants of shares and options, expressed by Vega_tot. Detailed description about these variables follows in Appendix A, as well.
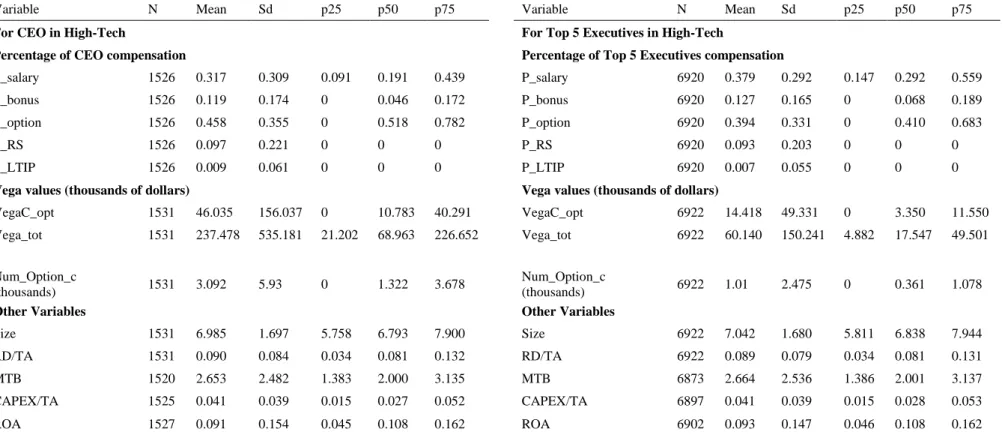
Table 1 states summary statistics from 2000-07 in high-tech firms. Firstly, I present statistics regarding the fraction of total compensation arising from each pay element. On average, stock represents the biggest proportional component (P_option) of compensation packages for CEOs in high-tech firms – 45.8 % of total compensation. The same is true for Top 5 Executives with 39.4% of stock options, on average21. In relation to incentive measures, namely vega22 both current and total vega present higher values for CEOs in high-tech, comparing with Top 5 Executives. For example, a 0.01 change in stock return volatility implies an average change in CEO current stock option value of $46,035 comparing with $14,418 for the Top 5 Executives. Being the CEO offered more stock options it would be reasonably expected higher sensitivity. Assuming as well that the CEO is responsible for taking major corporate decisions in a firm it is expected a higher pay-for-performance sensibility attached to this role, in the hopes of avoiding deviations from optimal performance levels. However, there is an important detail there is worth mention: vega values seem to present significant higher values for the average when compared to the median for CEOs and Top 5 Executives. For example, VegaC_opt for a CEO in a high-tech company is $46,035 on average when compared to $10,783 for the median. This indicates that the distribution is positively skewed.
21 Although the proportion of salary it is quite close to the same level with Top 5 Executives
receiving 37.9% of its compensation in salary.
26
Table 1 – Summary statistics, all sample years (2000-07)
Variable N Mean Sd p25 p50 p75 Variable N Mean Sd p25 p50 p75
For CEO in High-Tech For Top 5 Executives in High-Tech
Percentage of CEO compensation Percentage of Top 5 Executives compensation
P_salary 1526 0.317 0.309 0.091 0.191 0.439 P_salary 6920 0.379 0.292 0.147 0.292 0.559
P_bonus 1526 0.119 0.174 0 0.046 0.172 P_bonus 6920 0.127 0.165 0 0.068 0.189
P_option 1526 0.458 0.355 0 0.518 0.782 P_option 6920 0.394 0.331 0 0.410 0.683
P_RS 1526 0.097 0.221 0 0 0 P_RS 6920 0.093 0.203 0 0 0
P_LTIP 1526 0.009 0.061 0 0 0 P_LTIP 6920 0.007 0.055 0 0 0
Vega values (thousands of dollars) Vega values (thousands of dollars)
VegaC_opt 1531 46.035 156.037 0 10.783 40.291 VegaC_opt 6922 14.418 49.331 0 3.350 11.550 Vega_tot 1531 237.478 535.181 21.202 68.963 226.652 Vega_tot 6922 60.140 150.241 4.882 17.547 49.501 Num_Option_c (thousands) 1531 3.092 5.93 0 1.322 3.678 Num_Option_c (thousands) 6922 1.01 2.475 0 0.361 1.078
Other Variables Other Variables
Size 1531 6.985 1.697 5.758 6.793 7.900 Size 6922 7.042 1.680 5.811 6.838 7.944
RD/TA 1531 0.090 0.084 0.034 0.081 0.132 RD/TA 6922 0.089 0.079 0.034 0.081 0.131
MTB 1520 2.653 2.482 1.383 2.000 3.135 MTB 6873 2.664 2.536 1.386 2.001 3.137
CAPEX/TA 1525 0.041 0.039 0.015 0.027 0.052 CAPEX/TA 6897 0.041 0.039 0.015 0.028 0.053
ROA 1527 0.091 0.154 0.045 0.108 0.162 ROA 6902 0.093 0.147 0.046 0.108 0.162
Notes. Summary Statistics for CEO and Top 5 Executives in high-tech firms over the entire sample period. The sample contains observation from 2000 through 2007. Details about the construction of the percentage variables of each compensation component and definition of sensitivity measures of pay are presented in Appendix A. Size is the logarithmic value of total assets; RD/TA is R&D expenses deducted by total assets; MTB is the Market-to-book value; CAPEX/TA is CAPEX deducted by total assets; ROA refers to Return on Assets.
27
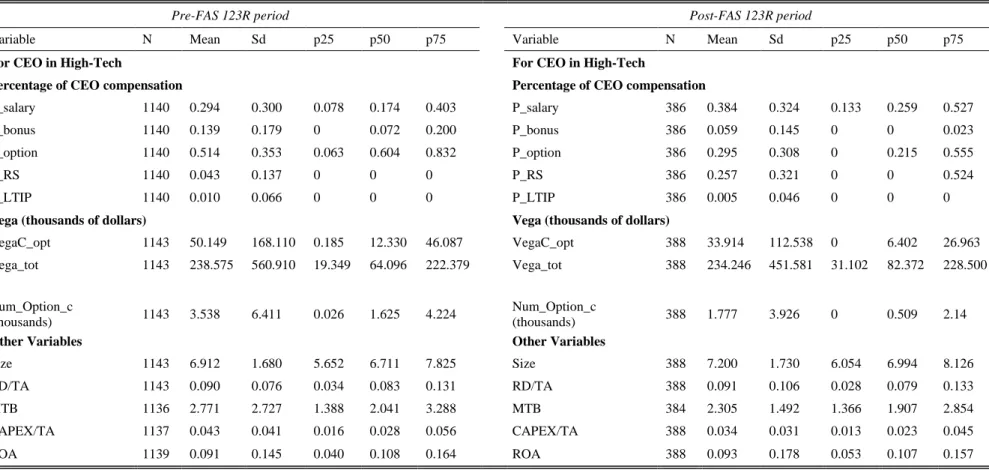
Table 2 presents summary statistics for the pre- and post-FAS 123R periods for the CEO in high-tech companies. On average, the proportion of options (P_options) for the CEO in high-tech firms seems to have diminished expressively – from 51.4% to 29.5%. The proportion of salary (P_salary) and restricted stock (P_RS) increased for the CEO in the post- FAS123R period, especially P_RS: from 4.3% to 25.7%. This might be an indication that foreseeing the accounting impact associated with options, high-tech companies decided to substitute options for other pay components. Also, median current vega has decreased for CEOs in high-tech, in the post-FAS 123R: the median CEO in an high-tech decreased current vega (VegaC_opt) by half from $12,330 to $6,402 as of a 0.01 change in stock return volatility. Considering that options are the major component in compensation that increases convexity, measured by vega, it would be reasonably expected that with the reduction of option usage vega values would decrease. In contrast, total vega (Vega_tot) for CEOs seems to have increased on median, but decreased on the average. What seems to be relevant, as well, it is the number of options granted (Num_opt_share_c) before and after FAS 123R for this industry. On average, the number of options granted to CEOs in high-tech decreased from 3,538 to 1,777. This reduction acts in favour of Hayes et al. (2012) argument stating that companies foreseeing a big accounting impact with the use of stock drove compensation to other components.
28
Table 2 – Summary statistics pre- and post- period CEO (2000-07)
Pre-FAS 123R period Post-FAS 123R period
Variable N Mean Sd p25 p50 p75 Variable N Mean Sd p25 p50 p75
For CEO in High-Tech For CEO in High-Tech
Percentage of CEO compensation Percentage of CEO compensation
P_salary 1140 0.294 0.300 0.078 0.174 0.403 P_salary 386 0.384 0.324 0.133 0.259 0.527
P_bonus 1140 0.139 0.179 0 0.072 0.200 P_bonus 386 0.059 0.145 0 0 0.023
P_option 1140 0.514 0.353 0.063 0.604 0.832 P_option 386 0.295 0.308 0 0.215 0.555
P_RS 1140 0.043 0.137 0 0 0 P_RS 386 0.257 0.321 0 0 0.524
P_LTIP 1140 0.010 0.066 0 0 0 P_LTIP 386 0.005 0.046 0 0 0
Vega (thousands of dollars) Vega (thousands of dollars)
VegaC_opt 1143 50.149 168.110 0.185 12.330 46.087 VegaC_opt 388 33.914 112.538 0 6.402 26.963 Vega_tot 1143 238.575 560.910 19.349 64.096 222.379 Vega_tot 388 234.246 451.581 31.102 82.372 228.500 Num_Option_c (thousands) 1143 3.538 6.411 0.026 1.625 4.224 Num_Option_c (thousands) 388 1.777 3.926 0 0.509 2.14
Other Variables Other Variables
Size 1143 6.912 1.680 5.652 6.711 7.825 Size 388 7.200 1.730 6.054 6.994 8.126
RD/TA 1143 0.090 0.076 0.034 0.083 0.131 RD/TA 388 0.091 0.106 0.028 0.079 0.133
MTB 1136 2.771 2.727 1.388 2.041 3.288 MTB 384 2.305 1.492 1.366 1.907 2.854
CAPEX/TA 1137 0.043 0.041 0.016 0.028 0.056 CAPEX/TA 388 0.034 0.031 0.013 0.023 0.045
ROA 1139 0.091 0.145 0.040 0.108 0.164 ROA 388 0.093 0.178 0.053 0.107 0.157
Notes. Pre- and Post- FAS 123R period for CEOs in high-tech companies. Pre-FAS 123R, is from January 2000 to December 2005. Post-FAS 123R period is defined as January, 2006 to December 2007. Details about percentage variables compensation components and definition of sensitivity measures of pay are presented in Appendix A. Size is the logarithmic value of total assets; RD/TA is R&D deducted by total assets; MTB is the Market-to-book value; CAPEX/TA is CAPEX deducted by total assets; ROA, Return on Assets.
29
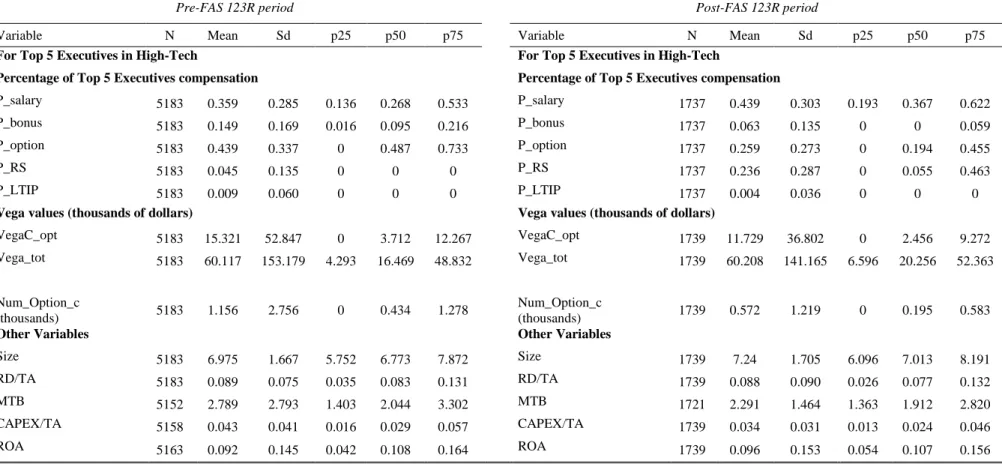
Table 3 presents summary statistics for the pre- and post- FAS 123R periods for the Top 5 Executives in high-tech. The median Top 5 Executives in high-tech firms suffered a substantial reduction in P_option they were receiving – from 43.9% to 25.9% in the post-period. In resemblance to CEOs, except from bonus (P_bonus) and long-term incentive plans (P_LTIP) all the components of pay have increased in the post- period. The increase in the level of restricted stock (P_RS), on average, seems to be quite relevant: from 4.5% to 23.6%. Top 5 Executives vega values appear to remain stable with no major changes in both periods with a slight increase for current vega (VegaC_opt). Despite the fact that the number of options (Num_Option_c) granted in both the pre- and post- period as changed substantially: from 1,156 to 572.
Overall, there is reason to believe FAS 123R introduced some changes to the structure of compensation contracts. This might indicate that companies are quite reactive to regulation that might impact accounting numbers. Specially, when the foreseeable accounting impact is expected to be high (Hayes et al. 2012). Which is the case for high-tech companies. Additionally, as one can realize the CEO is not the only one who gets majorly impacted by these changes. Top 5 Executives see their compensation changing as well. Also, regarding firm characteristics it appears no major changes occurred in this period influenced by FAS 123R. MTB ratio diminished slightly, on average. CAPEX/TA, ROA and RD expenses remained barely within the same values.
30
Table 3 - Summary statistics pre- and post- period Top 5 Executives (2000-07)
Pre-FAS 123R period Post-FAS 123R period
Variable N Mean Sd p25 p50 p75 Variable N Mean Sd p25 p50 p75
For Top 5 Executives in High-Tech For Top 5 Executives in High-Tech
Percentage of Top 5 Executives compensation Percentage of Top 5 Executives compensation
P_salary 5183 0.359 0.285 0.136 0.268 0.533 P_salary 1737 0.439 0.303 0.193 0.367 0.622
P_bonus 5183 0.149 0.169 0.016 0.095 0.216 P_bonus 1737 0.063 0.135 0 0 0.059
P_option 5183 0.439 0.337 0 0.487 0.733 P_option 1737 0.259 0.273 0 0.194 0.455
P_RS 5183 0.045 0.135 0 0 0 P_RS 1737 0.236 0.287 0 0.055 0.463
P_LTIP 5183 0.009 0.060 0 0 0 P_LTIP 1737 0.004 0.036 0 0 0
Vega values (thousands of dollars) Vega values (thousands of dollars)
VegaC_opt 5183 15.321 52.847 0 3.712 12.267 VegaC_opt 1739 11.729 36.802 0 2.456 9.272 Vega_tot 5183 60.117 153.179 4.293 16.469 48.832 Vega_tot 1739 60.208 141.165 6.596 20.256 52.363 Num_Option_c (thousands) 5183 1.156 2.756 0 0.434 1.278 Num_Option_c (thousands) 1739 0.572 1.219 0 0.195 0.583
Other Variables Other Variables
Size 5183 6.975 1.667 5.752 6.773 7.872 Size 1739 7.24 1.705 6.096 7.013 8.191
RD/TA 5183 0.089 0.075 0.035 0.083 0.131 RD/TA 1739 0.088 0.090 0.026 0.077 0.132
MTB 5152 2.789 2.793 1.403 2.044 3.302 MTB 1721 2.291 1.464 1.363 1.912 2.820
CAPEX/TA 5158 0.043 0.041 0.016 0.029 0.057 CAPEX/TA 1739 0.034 0.031 0.013 0.024 0.046
ROA 5163 0.092 0.145 0.042 0.108 0.164 ROA 1739 0.096 0.153 0.054 0.107 0.156
Notes. Pre- and Post- FAS 123R period for the Top 5 Executives in High-Tech firms. . Pre-FAS 123R, is from January 2000 to December 2005. Post-FAS 123R period is defined as January, 2006 to December 2007. Details about percentage variables compensation components and definition of sensitivity measures of pay are presented in Appendix A. Size is the logarithmic value of total assets; RD/TA is R&D deducted by total assets; MTB is the Market-to-book value; CAPEX/TA is CAPEX deducted by total assets; ROA is Return on Assets.
31
3.2 Hypothesis Development
3.2.1 Post- FAS 123R and stock option usage
Stock option offerings are the major ignition of convexity in compensation contracts. Convexity plays a role in managers’ daily lives because it gives the right incentives to maintain firm risk when deciding on financial and investment policies. Thus, by offering options to managers, shareholders try to mitigate to wealth-firm risk agency problem, incentivising management to pursue positive NPV risky projects. This fact, gains even more relevance if we consider that opposing to shareholders, managers are risk-averse undiversified individuals, who have the possibility of changing firm risk with their investment policy choices. It is empirically proven that management teams might be willing to forgo positive NPV projects if the costs to increase firm risk seem higher than the potential benefits arising from firm value. As Amihud and Lev (1981) state, risk-averse managers are likely to pursue less than optimal firm risk with the objective of protecting their own “firm-specific human capital”.
Therefore, the approval of FAS 123R favouring fair-value expensing of stock options, is seen as a negative aspect among shareholders for offering options to managers. Especially, if companies attribute more value to the perceived cost of options than to their economic cost has argued by Hall and Murphy (2003). This might have led shareholders to decrease the proportion of options offered to the CEO. Consequently, it seems relevant to understand the impact of this measure in lower levels of the hierarchical structure, namely the Top 5 Executives in the firm, excluding the CEO.
32
Furthermore, changes might have been even more severe in industries where stock option usage stands out as a major compensation component such as in the high-tech industry. Because, as Hayes et al. (2012) demonstrate, the decline in option usage with FAS 123R is higher for companies that would face higher account charges. Although firms are aware of the benefits of option usage in contracts, they give great important to the accounting impact of the regulation. Therefore, my main hypothesis is divided into two parts:
Hypothesis 1A: The changes in accounting treatment proposed by FAS
123R are associated with a decrease of stock options usage after 2005 for the CEO and Top 5 Executives in public listed companies in the US.
Hypothesis 1B: The reduction in stock options usage, for CEO and
Top 5 Executives, associated with the post-FAS 123R period will be higher for high-tech firms when comparing with other firms.
33
3.2.2 Stock option usage and risk-taking behaviour
As Smith and Stulz (1985) formalize, equity incentives in the form of stock options can increase managerial risk-taking “because increases in stock return volatility increase the value of the options”. But, one must consider the dual side effect of equity-based incentives. It is a fact that more equity in contracts helps to incentive the manager to take more risks and reach an optimal performance level. However, equity translates as well in more sensitivity of the manager’s portfolio to movements in the stock price of companies, which in turn might not be translated into more risk-taking (Hirshleifer and Suh 1992). This is the reason why, empirical researchers separate their analysis between the sensitivity of manager’s wealth to stock price, measured by delta, and the sensitivity of manager’s wealth to stock return volatility, measured by vega.
This dissertation analyses the implications of FAS 123R for high-tech companies in managers risk-taking incentives, measured by vega. As Guay (1999) and Hayes et al. (2012) have shown, vega maintains a positive relation with the use stock options. In fact, companies such as high-tech offer their management great amounts of stock options in the hopes of incentivising risk-taking translated into high vega values. High-tech companies are more avid to take risk and pursue innovative and challenging projects in the hopes of reaching a great business idea. Both the CEO and Top 5 Executives are then incentivised to pursue risky projects and their compensation contracts reflect the importance in maintaining vega value at high levels. Considering the above stated, I analyse if high-tech companies
34
will be able to maintain vega values after FAS 123R introduction. And what is the impact of this regulation in vega.
Based on the argument of Hayes et al. (2012) that companies facing more accounting charges are more inclined to reduce their option offering I hypothesize that vega will be more impacted in high-tech comparing with other public firms. This leads to my second hypothesis that is divided into 2 parts:
Hypothesis 2A – After 2005, there will be a decrease in managers’
risk-taking incentives, measured by vega, for the CEO and Top 5 Executives in public listed companies in the US.
Hypothesis 2B – The incremental decrease in managers’ risk-taking
incentives (measured by vega) will be higher for the CEO and Top 5 Executives in high-tech companies, comparing with other firms, since the decline in option usage is more pronounced in firms that potentially face higher accounting charges with FAS 123R.
35
3.3 Analysis
All the tests performed have in consideration the hypothesis developed in the previous chapter. To extract the real effect caused by this exogenous shock and avoid endogeneity issues Appendix C explains why to perform a firm fixed effects regressions that “control for any time-invariant heterogeneity across firms” (Hayes et al. 2012). The use of control variables in my regression analysis is intend to rule out the effect of predictive variables on my dependent variable and to check whether the effect of these control variables is in fact significant. Thus, by holding a set of variables constant, I isolate the effect of FAS 123R in an attempt to attribute more meaningful results to my study.
36
3.3.1 Changes in CEO and Top 5 Executives stock options
I begin by examining how options offerings to the CEO and Top 5 Executives was affected by the introduction of FAS 123R. I use a regression analysis that separately presents results for the CEO and Top 5 Executives. This regression has P_option as the dependent variable and a series of dummy and control variables.
Controlling for firm size becomes important since different companies with different size are expected to offer different amounts of stock to their executives. The sign of the relation between option offerings and size might be uncertain. There is the view that larger companies, usually facing more monitoring costs, are expected to offer more options to their employees with the aim of providing the right incentives. Core and Guay (2001) observe that companies with bigger size and more decentralized structure are expected to offer more equity incentives as a consequence of higher direct monitoring costs. Additionally, it is fair to say that larger companies enjoy more tax benefits23 by issuing and granting stocks to their employees24. Comparing with smaller firms one could argue that larger companies have more incentives to maintain their proportion of options offered, despite the upcoming unfavourable treatments. On the other hand, if we consider that larger companies offer more options they would consequently face higher accounting expenses in the event of FAS 123R approval. This can actually
23
Apple, for example, realized $3.19 billion in tax savings from stock options issuance between 2010 and 2012.
24 According to Forbes, the use of stock options in recent years made some of the
largest companies in the US to report extensive tax savings. These cases have been more pronounced in industries were stock option offerings is substantial, such as technology and investment banking. For more details: http://www.forbes.com/sites/janetnovack/2013/04/24/stock-options-meant-big-tax-savings-for-apple-and-jp-morgan-as-well-as-facebook/
37
imply a negative correlation between size and proportion of options for my sample period if companies give great importance to the accounting impact of the regulation, and if most of them are considered large companies. The inclusion of other components of the compensation scheme – cash compensation, restricted stock (RS) and long-term incentive plans (LTIP) – serve as a control mechanism for the alternative options shareholders have to deviate from option offerings. So it would be expected a negative relation between the proportion of options and cash compensation, RS and LTIP.
This regression will count with two dummy variables. The first term (postFAS 123R) serves as an indicator for the post-FAS 123R period. This variable measures the effect of FAS 123R on all firms concerning the proportion of options given to the CEO or Top 5 Executives. The second dummy, (postFAS 123R_High_Tech) is aimed at evaluating the incremental effect of FAS 123R for CEOs or Top 5 Executives in High-Tech companies in the post- period. The empirical regression is stated as follows:
(1)
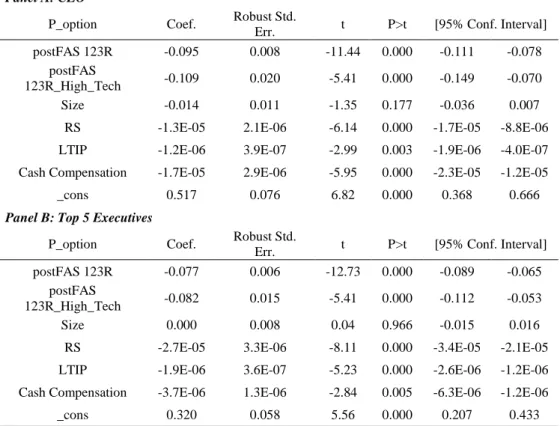
Panel A, of Table 4, presents regression results for P_option given to the CEO. The coefficient in the postFAS 123R variable is negative and statistically significant, meaning that the proportion of options offered to the CEO has diminished in the post-FAS 123R for all firms. There is a 9.5 percentage point’s decrease, on average, in the proportion of options given
38
to the CEO in the post- period. The economic significance of this result might be questionable. If we consider the average CEO in any firm, for my sample, is being offered 1,531 in current option grants, this would be translated in less 145 options in the post- period. The sign of the coefficient in the postFAS 123R_High_Tech dummy is negative and statistically significant, denoting that FAS 123R had a negative incremental effect of 10.9 percentage points, in the proportion of options offered to high-tech companies25. On average, CEOs in high-tech were being offered 3,538 options in the pre- FAS 123R period which would be translated into less 625 options after 2005. Size appears to have a negative, but not significant, relation with the proportion of options, possibly due to the fact the sample analysed contains a lot of large public companies that foreseeing the accounting costs of expensing stocks have reduced them. Cash Compensation, RS and LTIP have a negative and significant relation with P_option, although the economic significance seems to be low26. For last, the sign of the constant , (given by the designation _cons in the table) tells us that when the postFAS 123R dummy is equal to 0 one can expect a positive sign in the proportion of options of 0.517. Considering that postFAS 123R equal to 0 refers to the pre- FAS 123R period, this indicates that there is a positive and significant relation of the options offered to the CEO before FAS 123R approval27. Also, spearman’s correlation coefficient
25
These facts seem to be in accordance with the initial hypothesis developed. Maybe foreseeing the high accounting impact that could have been occurred by maintaining the same level of stock options grants, high-tech firms took the initiative to reduce options grants.
26 For example, for a 1 percentage point increase in the proportion of stock one would
predict a decrease in the proportion of restricted stock to the CEO of 0.000012.
27 This might lead one to believe that before the introduction of FAS 123R there was a
favourable accounting treatment towards options that made it more attractable to shareholders as a compensation component.
39
tests28 presented in Appendix B.1.1 do not show much correlation between variables29. In addition, variance inflation tests (VIF) presented in Appendix B.1.2 present values between 1 and 1.5 indicating a low multicollinearity 30.
Table 4 – Regression Results for proportion of options (P_option)
Panel A: CEO
P_option Coef. Robust Std.
Err. t P>t [95% Conf. Interval] postFAS 123R -0.095 0.008 -11.44 0.000 -0.111 -0.078
postFAS
123R_High_Tech -0.109 0.020 -5.41 0.000 -0.149 -0.070
Size -0.014 0.011 -1.35 0.177 -0.036 0.007
RS -1.3E-05 2.1E-06 -6.14 0.000 -1.7E-05 -8.8E-06 LTIP -1.2E-06 3.9E-07 -2.99 0.003 -1.9E-06 -4.0E-07 Cash Compensation -1.7E-05 2.9E-06 -5.95 0.000 -2.3E-05 -1.2E-05
_cons 0.517 0.076 6.82 0.000 0.368 0.666
Panel B: Top 5 Executives
P_option Coef. Robust Std.
Err. t P>t [95% Conf. Interval] postFAS 123R -0.077 0.006 -12.73 0.000 -0.089 -0.065
postFAS
123R_High_Tech -0.082 0.015 -5.41 0.000 -0.112 -0.053
Size 0.000 0.008 0.04 0.966 -0.015 0.016
RS -2.7E-05 3.3E-06 -8.11 0.000 -3.4E-05 -2.1E-05 LTIP -1.9E-06 3.6E-07 -5.23 0.000 -2.6E-06 -1.2E-06 Cash Compensation -3.7E-06 1.3E-06 -2.84 0.005 -6.3E-06 -1.2E-06
_cons 0.320 0.058 5.56 0.000 0.207 0.433
Notes. Panel A presents regression results for roughly 390 CEOs in high-tech companies. Panel B presents regression results for around 1,740 Top 5 Executives in high-tech companies. Data ranges from 2000 to 2007. Values for CEO and Top 5 Executives extracted from ExecuComp, while firm characteristics extracted from Compustat. The postFAS 123R dummy takes the value of 1 for the post-FAS 123R period for all firms in the sample and 0 otherwise. The postFAS 123R_High_Tech takes the value of 1 for all high-tech companies in the post-FAS 123R period and 0 otherwise. Control variables are described in Appendix A. Spearman Correlation and VIF tests can be found in Appendix: B.1.1; B.1.2; B.2.1; B.2.2.
Panel B, of Table 4 presents regression results for Top 5 Executives for P_option in the post-FAS 123R period. The postFAS 123R dummy reveals
28 This test is aimed at evaluating the monotonic relation between these pairs of
control variables.
29
Cash Compensation appears to be significantly correlated with size with a coefficient of 60%. Except from this all the remaining variables appear to have a correlation inferior to 35%.
40
that Top 5 Executives in all firms have received less 7.7 percentage points, on average, in options in the post period. The postFAS 123R_High_Tech, indicates high-tech companies suffered an incremental negative effect of 8.2 percentage points, in the number or options offered to Top 5 Executives after 2005. Despite the statistical significance, the results might have low economic significance. Top 5 Executives in the pre- period were receiving 1,156 options, on average, which would mean that after FAS 123R approval this result would be reduced by 177 options. Size has a positive (not significant) relation with P_option, and surprisingly, Cash Compensation is positively related to P_option, as well. Also, although, the coefficient of 0.320 is positive, it is much lower when compared to CEOs31. Spearman correlation tests for Top 5 Executives regression (Appendix B.2.1) do not indicate too much relation among variables32. Also, with a mean VIF (Appendix B.2.2) of 1.18, variables appear to have a low multicollinearity.
31
Fact, that is justifiable by previous evidence that the proportion of stock options received by CEOs in compensation contracts is much higher than for other executive roles in high-tech companies.
41
3.3.2 Changes in CEO and Top 5 Executives vega
Being stock options a major driver of convexity in compensation contracts, I will start by analysing the changes in current risk-taking incentives for the post-FAS 123R period for CEOs and Top 5 Executives.
This fixed effect regression has vegaC_opt, as the dependent variable that will serve as a proxy for management’s current risk-taking incentives. The regression presents the same dummy and control variables expressed in the previous analysis. However, some control variables have a different interpretation. As in Guay (1999) it is important to control for Size due to the circumstance that larger companies have a higher probability of adopting incentive compensation plans, such as stock option plans, which consequently increases vega values33. Also, cash compensation (salary + bonus) is controlled for due to the fact that the more cash compensation that can be invested outside the firm, the more diversified is an executive in a firm (Guay 1999)34. Restricted stock (RS) and long-term incentive plans (LTIP) represent alternative forms of compensation and serve as control variables with the same purpose as the previous regression.
33
A positive relation between Size and vega is expected.
34 This fact can actually induce a positive relation between cash compensation and
vega, due to the fact that the much diversified is an executive the more necessary to offer him/her a convex contract.