Arquipelago - Life and Marine Sciences ISSN: 0873-4704
45
Spatial and temporal distribution of bottlenose dolphins,
Tursiops truncatus, in the Madeira archipelago, NE Atlantic
A
NAD
INIS,
A.
C
ARVALHO,
F.
A
LVES,
C.
N
ICOLAU,
C.
R
IBEIRO,
M.
K
AUFMANN,
A.
C
AÑADAS&
L.
F
REITASDinis, A., A. Carvalho, F. Alves, C. Nicolau, C. Ribeiro, M. Kaufmann, A. Cañadas & L. Freitas 2016. Spatial and temporal distribution of bottlenose dolphins, Tursiops truncatus, in the Madeira archipelago, NE Atlantic. Arquipelago. Life and Marine Sciences 33: 45-54.
One of the first steps in understanding the relationships between populations and their habitats is to determine which areas they use with higher frequency. This study used systematic and non-systematic survey data from 2001-2002 and 2004-2012 to determine encounter rates and investigate temporal and spatial distribution of bottlenose dolphins around Madeira, Desertas and Porto Santo islands. A total 24,914 km of search effort was carried out and 199 sightings were recorded. Highest encounter rates were found off the east coast of Madeira and off Porto Santo. Moreover, higher encounter rates occurred over bathymetries ranging between 500-1,000 m during systematic surveys whereas in non-systematic surveys relative high encounter rates were found in depths of 2,000-2,500m. Most dolphins were found to be distributed in depths <1,000m and at no more than 10 km offshore indicating a preference for shallower waters. Dolphins were sighted during the whole year and there were no significant differences in encounter rate between months. These results suggest the existence of preferential areas for this species based on static bathymetric features. The fact that the dolphins prefer inshore areas that are more exposed to anthropogenic activities should be taken into account when discussing bottlenose dolphin conservation measures in the Madeira archipelago.
Key words: Bottlenose dolphins, conservation, nautical surveys, physiographic variables, spatio-temporal occurrence
Ana Dinis1,2,3(email: ana.dinis@ciimarmadeira.org), Madeira Whale Museum, Caniçal,
Madeira, Portugal, A. Carvalho1, F. Alves1,3, C. Nicolau1, C. Ribeiro1,3, M. Kaufmann2,3, A.
Cañadas4 & L. Freitas1,3. 1Madeira Whale Museum, Caniçal, Madeira, Portugal; 2University of Madeira, Centre of Life Sciences, Madeira, Portugal; 3CIIMAR-Madeira,
Interdisciplinary Centre of Marine and Environmental Research of Madeira, Edifício Madeira Tecnopolo, Funchal, Portugal; 4ALNILAM– Research and Conservation, Madrid,
Spain.
INTRODUCTION
Effective conservation of wild populations requires an understanding of the relationship between populations and their habitats and for that the first step is to determine which habitats are used with higher frequency (Cañadas et al. 2005). Physiographic, oceanographic and biological variables can be used as proxies for prey availability
(known to determine cetacean distribution patterns as a predator response) (de Stephanis et al. 2008), which often are not available at the required spatial resolution to be used for habitat use analysis (Redfern et al. 2006). Foraging cetaceans are known to concentrate over areas of abrupt topography, such as shelf breaks, steep slopes, canyons, shallow banks and seamounts (Baumgartner et al. 2001; Yen et al. 2004; Cañadas et al. 2005). These habitats are
Dinis et al. characterized by higher productivity, as a result of upwelling-driven nutrient availability (Genin 2004). The bottlenose dolphin, Tursiops truncatus Montagu, 1821, occurs in populations ranging from far offshore waters to coastal waters, along the continents or around islands (Forcada et al. 2004). In Madeira archipelago the bottlenose dolphin is one of the most common species (Freitas et al. 2004; Dinis et al. 2009) and one of the most sighted species by the whale-watching activity (Ferreira 2007; Vera 2012).
In Madeira archipelago, the range of anthropogenic activities is yet unknown with the exception of the whale-watching industry (Ferreira 2007; Vera 2012) and marine traffic (Cunha 2013). In the last years the demand for marine activities has increased, and the whale-watching industry has grown in the same proportion. Marine tourism operators began undertaking sightseeing trips where they also advertised whale-watching. Nowadays, there are companies exclusively dedicated to whale-watching, including 'swimming with dolphins' activities (Vera 2012). In 2013 the whale-watching activity was legally regulated imposing limits to the number of companies operating and, in 2014 limited areas of operation were established. Moreover, Cunha (2013) identified an inshore common “high used corridor” for both vessels and cetaceans, standing as a potential conflict zone.
One of the most common approaches to marine conservation is the establishment of marine protected areas (MPAs) and although their effectiveness is the subject of much debate, they are considered an important tool for conservation (Cañadas et al. 2005). In Madeira archipelago MPAs cover only the coastal waters down to 100 m depth (Menezes et al. 2011), which is hardly effective for a highly mobile species such as the bottlenose dolphin. These animals usually have ranges too large to be included within a single MPA, but addressing areas where threatening human activities significantly overlap with the population range or important habitat can contribute effectively to the species’ conservation (Silva et al. 2012). Designing protected areas requires knowledge of the spatial-temporal distribution and habitat requirements of the
population interest, in order to adjust the size of the management area to the biological needs of the target population (Silva et al. 2012). In addition, the large habitat area usually required for a species like the bottlenose dolphin can protect many other species (Hoyt 2011). Thus, these dolphins can simultaneously act as an umbrella and a flagship for the preservation of the marine environment.
This study uses long-term data to calculate encounter rates and to investigate temporal occurrence and spatial distribution of bottlenose dolphins around Madeira, Desertas and Porto Santo islands.
MATERIAL AND METHODS STUDY AREA
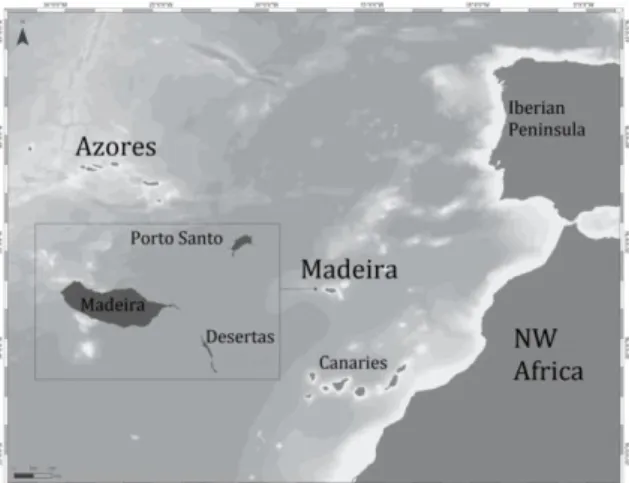
This study was conducted in the archipelago of Madeira, Portugal. The archipelago is located in the warm-temperate waters of the northeast Atlantic Ocean, at approximately 1,000 km from the European continent and 500 km from the West African coast (Figure 1). The overall study area is characterized by a narrow continental shelf, with steep submarine canyons and deep waters (ca. 1,500 m) (Geldmacher et al. 2000).
Fig. 1. Map of the Madeira archipelago in the NE Atlantic
FIELD METHODS
The Madeira Whale Museum has conducted systematic and non-systematic surveys for cetaceans within the scope of different research projects. Sightings and search effort from these
Distribution of bottlenose dolphins in Madeira archipelago
47 dedicated surveys conducted between 2001 and
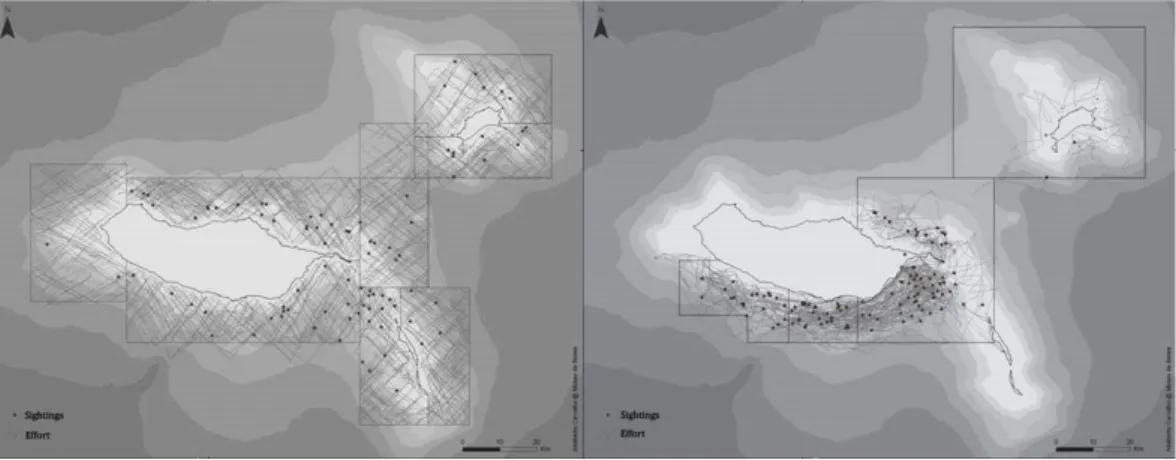
2012 (excluding 2003) were used in the analyses. Systematic nautical surveys were carried out from R/V ZIPHIUS (12 km/h) over eight established sectors (Figure 2) that covered the waters around the islands of Madeira, Desertas and Porto Santo (4,637 km2). Three observers searched the area up
to the horizon, equipped with 7x50 binoculars, at an eye-height of 5m above the sea level. Non-systematic surveys were carried out mainly from the 6.5m rigid inflatable research boat ROAZ (25 km/h), and also from R/V ZIPHIUS. These were
conducted over four pre-established sectors (Figure 2), covering the south and northeast of Madeira Island and Porto Santo. An attempt was made to cover all distances and depths within that area. An average of three observers (min. two, max. four) scanned the area by naked eye, at an eye-height of 2 m above the sea level. The track lines were registered using a Global Positioning System (GPS), and Beaufort Sea State, effort and sighting data were collected.
Fig.2. Map representing the different sectors, effort tracks and sightings for systematic surveys (left) and non-systematic surveys (right). Surveys are represented by the grey tracks, and sightings by the black dots.
DATA ANALYSIS
Search effort was quantified as the number of km covered on effort mode under Beaufort Sea State ≤3. In order to reduce bias, sightings from radio calls from other vessels were excluded. Effort and sighting data were then transferred into ArcView 9.3.1 (ESRI, Inc.), which was used for data processing.
SPATIAL DISTRIBUTION
Search effort, sighting data, and static variables such as mean depth, mean slope and minimum distance to coast were associated with each grid cell using Geographic Information System (GIS) tools. Spatial distribution was investigated by dividing the study area into a 2’ x 2’ grid of cells and calculating an encounter rate for each grid cell. Encounter rate was calculated as the number of sightings by 100 km surveyed in each grid cell. Data analysis was independent for each type of
survey due to different methodologies, and grid cells with <5 km of search effort were excluded from the analysis to avoid small sample biases (Panigada et al. 2005; de Stephanis et al. 2008; Alves 2013).
For the analysis of the encounter rate in relation to physiographic variables these were categorized into bins. Depth and distance from the coast were categorised into bins. Depth and distance from the coast were measured in metres and kilometres respectively, while slope was expressed in degrees.
TEMPORAL DISTRIBUTION
Monthly encounter rate was calculated using inter-annual data of each type of survey, after verifying there were no significant differences between years (not shown). Encounter rate was pooled by month.
Dinis et al. The Kruskal-Wallis test was used to explore if there were significant differences in the encounter rate between months for both systematic and non-systematic survey data. The Shapiro-Wilk and Levene’s tests were carried out for the ANOVA assumptions (α=0.05). All the analyses were made in R 3.0.2 software (R Development Core Team 2012).
RESULTS
EFFORT AND SIGHTINGS
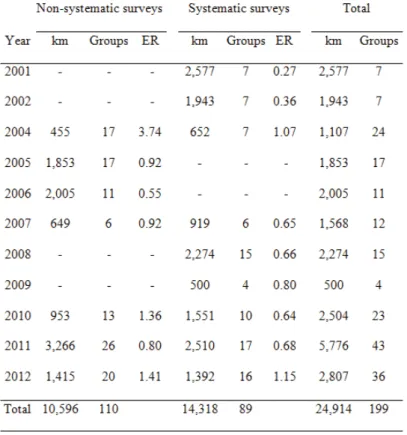
Eighty nine sightings were registered along 14,318 km of effort during systematic surveys and 110 groups of bottlenose dolphins were recorded along 10,596 km of search effort during non-systematic surveys adding up to 199 sightings and 24,914 km of search effort from 2001-2012 (Table 1).
Table 1. Kilometres (km) surveyed number of groups and encounter rate (ER) of bottlenose dolphins sighted per year and type of survey, from 2001-2002 and 2004-2012.
SPATIAL DISTRIBUTION
Search effort during surveys was not homogeneous in all sectors mainly due to weather conditions and distance from the port (Figure 2). The exclusion of the cells with ≤5 km of search effort resulted in the elimination of 288 km of transect line from non-systematic surveys, and of
109 km from systematic surveys. No sightings were eliminated by this truncation.
Dolphins were encountered in 75 of the surveyed grid cells (16%) during systematic surveys and in 56 of the surveyed grid cells (21%) during non-systematic surveys (Figure 3).
Distribution of bottlenose dolphins in Madeira archipelago
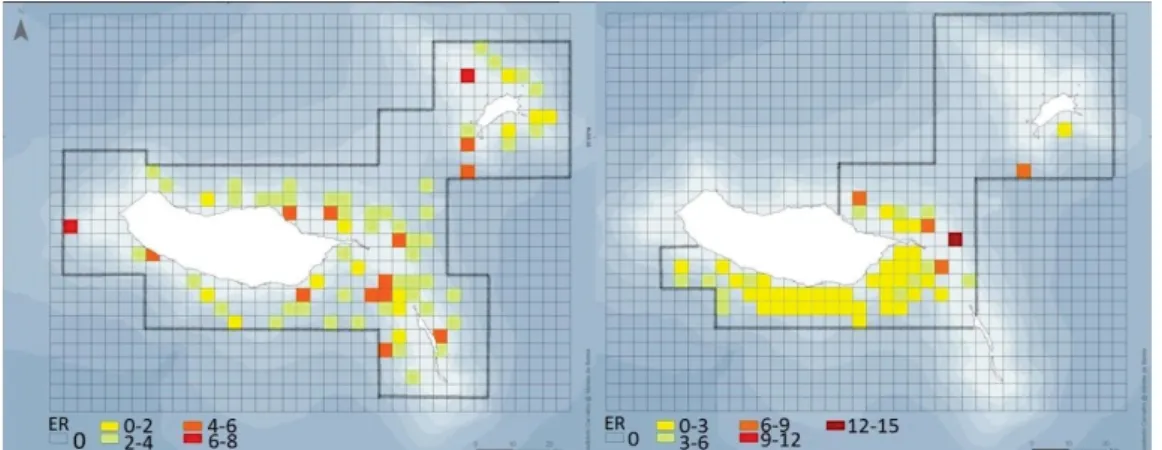
49 Fig. 3. Encounter rate (groups per 100 km) (ER) by grid cells for systematic surveys (left) and non-systematic surveys (right) over the study area.
With the exception of one grid cell in the
southwest coast of Madeira, cells with highest encounter rates were found on the east side of Madeira and in Porto Santo.
Fig. 4. Distribution of encounter rate (bars) and search effort (•) in relation to depth, distance to coast and slope, per type of survey: left- systematic surveys; right - non- systematic.
Depth 0 1000 2000 3000 4000 5000 0,00 0,20 0,40 0,60 0,80 1,00 1,20 1,40 1,60 500 1000 1500 2000 2500 3000 3500 Effo rt (Km) Encou
nter Rate (per 100
Km ) Depth (m) 0 1000 2000 3000 4000 5000 0,00 0,20 0,40 0,60 0,80 1,00 1,20 1,40 1,60 500 1000 1500 2000 2500 3000 3500 Effo rt (Km) Encou
nter Rate (per 100
Km ) Depth (m) 0 1000 2000 3000 4000 5000 0,00 0,20 0,40 0,60 0,80 1,00 1,20 1,40 1,60 5 10 15 20 25 30 Effo rt (Km) Encou
nter Rate (per 100
Km ) Distance to coast (Km) 0 1000 2000 3000 4000 5000 0,00 0,20 0,40 0,60 0,80 1,00 1,20 1,40 1,60 5 10 15 20 25 Effo rt (Km) Encou
nter Rate (per 100
Km ) Distance to coast (Km) Distance to coast 0 1000 2000 3000 4000 5000 0,00 0,20 0,40 0,60 0,80 1,00 1,20 1,40 1,60 5 10 15 20 25 Effo rt (Km) Encou
nter Rate (per 100
Km ) Slope (o) 0 1000 2000 3000 4000 5000 0,00 0,20 0,40 0,60 0,80 1,00 1,20 1,40 1,60 5 10 15 20 25 Effo rt (Km) Encou
nter Rate (per 100
Km ) Slope (o) Slope 0 0 0 0 0 1 1 1 Depth Distance to coast Slope E n cou nter rate (p er 100 k m ) E ffort ( km )
Dinis et al. The northeast of Madeira presented the cell with the highest encounter rate (ER=13.5; effort=7km) in non-systematic surveys, followed by a grid cell in the north of Porto Santo during systematic surveys (ER=7.5; effort=13km). The encounter rate distribution in relation to physiographic covariates revealed different values for systematic and non-systematic surveys for all variables, except for slope where the tendency was similar (Figure 4). Higher encounter rates occurred over bathymetries ranging between 500 and 1,000m during systematic surveys whereas in non-systematic surveys high encounter rates were also found in depths of 2,000 and 2,500m. Encounter rates decreased with distance from the coast in
systematic surveys while in non-systematic surveys the 5-10 km class showed the highest value. Lastly, encounter rate in relation to slope ranged between 5 and 20° with the highest values appearing in 5-10° and 10-15° slopes, for both types of surveys
TEMPORAL DISTRIBUTION
Effort was distributed throughout the year in both types of surveys. In systematic surveys April was the most surveyed month, and August was the month with less effort. In non-systematic surveys effort was more concentrated in spring and summer (May to September), and there was less effort in December (Figure 5).
Fig. 5. Monthly distribution of encounter rate (bars) and search effort (•) per type of survey. Top: systematic surveys; Bottom: non-systematic surveys.
In systematic surveys, encounter rate was higher in spring (May-June) and, in non-systematic sur veys April and December were the months with highest values. Late summer (August-October) presented high values for both types of surveys. Despite the heterogeneous results in encounter rate by months, the Kruskal-Wallis test showed no significant differences in encounter rate
between months for neither systematic (p=0.443) nor non-systematic surveys (p=0.172).
DISCUSSION
Using a combination of long-term (11 years) data collected during dedicated surveys (systematic and non-systematic) this study provides the first
0 500 1000 1500 2000 2500 0 0,5 1 1,5 2 2,5
Jan Feb Mar Apr May Jun Jul Aug Sep Oct Nov Dec
Months
0 500 1000 1500 2000 2500 0 0,5 1 1,5 2 2,5Jan Feb Mar Apr May Jun Jul Aug Sep Oct Nov Dec
Months
E n cou nter rate (p er 100 K) E ffort (Km )Dinis et al.
52
baseline information about the spatial and temporal occurrence of bottlenose dolphins in Madeira archipelago. The systematic surveys were designed as part of a wider project using Distance 5.0 (Thomas et al. 2010). Transects from systematic surveys were designed in such a way that every point in the study area had the same probability of being sampled. The probability of detecting cetaceans is known to decline as a function of distance from the observation platform, and so perpendicular distance is used to fit a detection function which is then used to adjust the estimated encounter rate (Hammond 2010). In this study those distances were not considered, so encounter rate was not adjusted making it impossible to infer about the overall density of dolphins in the area. Factors influencing detectability were also likely to differ between types of survey, thus affecting the comparison of encounter rates across seasons or geographic area (Silva et al. 2014). By analysing data from each survey separately and restricting effort to Beaufort Sea State ≤3 bias introduced by the factors mentioned above was reduced within and between surveys. Although sighted in every sector of the study area, bottlenose dolphins showed an overall higher encounter rate to the east of Madeira, particularly in the northeast and around Porto Santo (with the exception of one grid cell in Madeira West). When analysing probabilities of bottlenose dolphins moving within and between different sectors of the study area based on photo-identification, Dinis (2014) found dolphins had higher probabilities of remaining in the same sectors mentioned above (east of Madeira and all around Porto Santo), supporting the hypothesis that they are important for the studied population. Despite this apparent heterogeneous distribution the bottlenose dolphin is one of the most frequently sighted species of cetaceans on board whale-watching trips (Ferreira 2007) that operate mainly in the south of Madeira. This area, especially in the southeast should be carefully monitored as it is one of the areas where dolphins can be more exposed to the whale-watching activity.
The distribution of dolphins related with some physiographic variables provided some important information. The majority of dolphins was found
in depths <1,000m (for systematic surveys) and at no more than 10 km offshore (for both surveys) indicating a preference for shallower waters. In Madeira archipelago, the absence of a broad continental shelf, limits this kind of physiography to areas closer to the coast and to the channel between Madeira and the Desertas. This explains why the majority of sightings were closer to shore, despite the larger spatial coverage provided by the surveys. These findings are in accordance with what Silva et al. (2014) found in the neighbouring archipelago of Azores, and also with Baird et al. (2003; 2009) in the Hawaiian islands where bottlenose dolphins were typically found in depths of <700m. Nevertheless, there were sightings over deep bathymetries (2,000-3,000m) corresponding to associations with short-finned pilot whale, Globicephala macrorhynchus Gray 1846. Alves (2013) reported that one third of the sightings of short-finned pilot whales in the study area were in association with bottlenose dolphins, and these whales were distributed mainly over bathymetries of 2,000 to 2,500m. This suggests prey availability may play an important role in dolphin distribution (Fortuna 2006). While bottlenose dolphins inhabiting inshore and coastal waters feed mainly on benthic and demersal fish species (Barros & Odell 1990; Cockroft & Ross 1990), dolphins occurring in offshore waters forage on a wide variety of prey relying mainly on epipelagic and mesopelagic schooling fish and cephalopods (González et al. 1994; Mead & Potter 1995; Barros et al. 2000). The dolphins occurring in offshore waters seem to exhibit both strategies. Silva (2007), referring to the neighbouring archipelago of the Azores, indicated that the preference of the dolphins for shallower areas (between 100 and 600 m) in these oceanic environments is likely due to the fact that those areas provide a more suitable habitat, where dolphins can prey on demersal fish species in addition to schooling pelagic prey on open waters. Bottlenose dolphins commonly associate with environmental features known to increase biological productivity and/or promote prey aggregation (Baumgartner et al. 2001; Cañadas et al. 2002), however a full understanding of the oceanographic processes influencing the Madeiran waters is still missing (Caldeira &
Distribution of bottlenose dolphins in Madeira archipelago
Sangrà 2012). As mentioned before there is no information on the distribution of potential prey species of bottlenose dolphins in the study area, and habitat preferences of bottlenose dolphins in relation to oceanographic variables as well as other explanatory physiographic variables, that are known to influence biological productivity (and consequently prey distribution), should be further investigated.
No significant difference was found for any of the surveys in monthly encounter rate, suggesting bottlenose dolphins use the research area similarly year-round. Dinis (2014) found larger groups observed in the summer and autumn, mainly due to the presence of transient pelagic bottlenose dolphins, although there were no significant differences in group sizes across months.
Assessment of seasonality in this study seems to indicate that there is no strong seasonal fluctuation in the presence of bottlenose dolphins in Madeira archipelago waters.
CONCLUSIONS
In this study, bottlenose dolphins were regularly found in shallow areas closer to shore, suggesting the existence of biological processes influenced by bathymetry, as proposed by Silva (2007) with reference to the archipelago of the Azores. These results suggest the existence of preferred areas of habitat for this species based on static bathymetric features. This should not be interpreted as an isolated influence, as cetacean distribution is known to be affected also by hydrographic processes not dependent on local bathymetry. The preferred areas found in this study should be further investigated while monitoring the anthropogenic activities here is crucial to protect the population of bottlenose dolphins occurring in Madeira. The exposure of the near shore areas to anthropogenic activities like marine traffic or whale-watching and the presence of dolphins in these areas, should be taken into account when discussing bottlenose dolphin conservation measures in Madeira archipelago, or when discussing future MPAs for this species in this archipelago.
ACKNOWLEDGMENTS
We wish to thank João Viveiros, Miguel Silva, Hugo Vieira, Filipe Nóbrega, Carla Freitas, Ricardo Antunes, Rita Ferreira, Ana Higueras, Nuno Marques, Marianne Böhm-Beck, Jonatan Svensson, Virginie Wyss, Daniel Martins and Mafalda Ferro for field work assistance. This paper is part of the PhD thesis of Ana Dinis. Financial support: Município de Machico, LIFE and FEDER/INTERREG III-B EU programs for funding the data collection throughout the projects CETACEOS MADEIRA (LIFE99 NAT/P/006432), MACETUS (MAC/ 4.2/M10), EMECETUS (05/MAC/4.2/M10) and CETA-CEOS MADEIRA II (LIFE+ NAT/P/ 000646); Portuguese Foundation for Science and Technology (FCT) for funding the project GOLFINICHO (POCI/BIA-BDE/61009/2004). REFERENCES
Alves, F. 2013. Population structure, Habitat use and Conservation of Short-finned Pilot Whale (Globicephala macrorhynchus) in the archipelago of Madeira. PhD thesis, University of Madeira, Portugal. 180 pp.
Baird, R.W., A.M. Gorgone, D.J. McSweeney, A.D. Ligon, M. H. Deakos, D.L. Webster & G.S. Schorr et al. 2009. Population structure of island associated dolphins: evidence from photo-identification of common bottlenose dolphins (Tursiops truncatus) in the main Hawaiin Islands. Marine Mammal Science 25: 251-274.
Baird, R.W., D. Webster, J. Aschettino, G. Schorr & D.J. McSweeney 2013. Odontocete Cetaceans Around the Main Hawaiian Islands: Habitat Use and Relative Abundance from Small-Boat Sighting Surveys. Aquatic Mammals 39(3): 253-269. Barros, N.B. & D.K. Odell 1990. Food habits of
bottlenose dolphins in the Southeastern United States. Pp. 309-328 in: Leatherwood, S. & R. R. Reeves (Eds). The Bottlenose Dolphin Academic Press, Inc. London. 653 pp.
Barros, N.B., E.C.M. Parsons & T.A. Jefferson 2000. Prey of offshore bottlenose dolphins from the South China Sea. Aquatic Mammals 26: 2-6. Baumgartner, M.F., K.D. Mullin, L.N. May, & T.D.
Leming 2001. Cetacean habitats in the northern Gulf of Mexico. Fishery Bulletin 99: 219-239. Caldeira, R. & P. Sangrá 2012. Complex geophysical
wake flows: Madeira Archipelago case study. Ocean Dynamics 62: 683-700.
Dinis et al.
54
Cañadas, A., R. Sagarminaga, R. de Stephanis, E. Urquiola & P.S Hammond 2005. Habitat preference modelling as a conservation tool: Proposals for marine protected areas for cetaceans in southern Spanish waters. Aquatic Conservation: Marine and Freshwater Ecosystems 15: 495-521. Cockcroft, V.G. & G.J.B. Ross 1990. Food and feeding
of the Indian Ocean bottlenose dolphin off Southern Natal, South Africa. Pp. 295-308 in: Leatherwood, S. and R. R. Reeves (Eds) The Bottlenose Dolphin Academic Press, Inc. London. 653 pp.
Cunha, I. 2013. Marine traffic and potential impacts towards cetaceans within the Madeira EEZ: a pioneer study. MSc Thesis, University of Oporto, Portugal. 140 pp.
de Stephanis, R., T. Cornulier, P. Verborgh, J.S. Sierra, N.P. Gimeno, C. Guinet 2008. Summer spatial distribution of cetaceans in the Strait of Gibraltar in relation to the oceanographic context. Marine Ecology Progress Series 353: 275-288.
Dinis, A. 2014. Ecology and conservation of bottlenose dolphins in Madeira archipelago, Portugal. PhD thesis, University of Madeira, Portugal. 157 pp. Dinis, A., C. Ribeiro, C. Nicolau, F. Alves, A.
Carvalho & L. Freitas 2009. Common bottlenose dolphin (Tursiops truncatus) occurrence,
distribution and conservation status in Madeira Archipelago (Portugal). SC/61/SM13, 61st Annual meeting of the International Whaling Commission (IWC). Funchal 2009.
Ferreira, R.B. 2007. Monitorização da actividade de observação de cetáceos no Arquipélago da Madeira, Portugal. MSc thesis, Universidade de Lisboa, Faculdade de Ciências, Portugal. [Monitoring the whale-watching activity in Madeira archipelago, Portugal; in Portuguese]. 53 pp.
Forcada, J., M. Gazo, A. Aguilar, J. Gonzalvo & M. Fernández-Contreras 2004. Bottlenose dolphin abundance in the NW Mediterranean: addressing heterogeneity in distribution. Marine Ecology Progress Series 275: 275-287.
Fortuna, C.M. 2006. Ecology and conservation of
bottlenose dolphins (Tursiops truncatus) in the north-eastern Adriatic Sea. PhD thesis, University
of St. Andrews. 256 pp.
Freitas, L., A. Dinis, F. Alves, F. Nóbrega 2004. Cetáceos no Arquipélago da Madeira. Museu da Baleia, Machico, Madeira, Portugal. [In Portuguese].
Geldmacher, J., P. Van Den Bogaard, K. Hoernle & H.U. Schmincke 2000. The 40Ar/39Ar age dating of the Madeira Archipelago and hotspot track (eastern North Atlantic). Geochemistry,
Geophysics, Geosystems 1: 1999GC000018. Genin, A. 2004. Bio-physical coupling in the formation
of zooplankton and fish aggregations over abrupt topographies. Journal of Marine Systems 50: 3–20. González, A.F., A. López, A. Guerra & A. Barreiro
1994. Diets of marine mammals stranded on the northwestern Spanish Atlantic coast with special reference to Cephalopoda. Fisheries Research 21: 179-191.
Hammond, P.S. 2010. Estimating the abundance of marine mammals. Pp. 42-67 in: Boyd, I., D. Bowen & S. Iverson (Eds). Marine Mammal Ecology and Conservation. A handbook of techniques. Oxford Press. 480 pp.
Hoyt, E. 2011. Marine Protected Areas for Whales, Dolphins and Porpoises: a World Handbook for Cetacean Habitat Conservation and Planning. (2nd edition). Earthscan, New York. 477 pp.
Mead, J.G., C.W. Potter 1995. Recognizing two populations of the bottlenose dolphin (Tursiops truncatus) off the Atlantic coast of North America: morphological and ecological considerations. IBI Reports 5: 31-44.
Menezes, D., I. Freitas, M. Domingues & P. Oliveira 2011. Madeira Natural Paradise. Secretaria Regional do Ambiente e dos Recursos Naturais: Serviço do Parque Natural da Madeira. 130 pp. Panigada, S., G.N. di Sciara, M.Z. Panigada, S. Airoldi,
J.F. Borsani JF & M. Jahoda 2005. Fin whales (Balaenoptera physalus) summering in the Ligurian Sea: Distribution, encounter rate, mean group size and relation to physiographic variables. Journal of Cetacean Research and Management 7: 137-145.
Redfern, J.V., M.C. Ferguson, E.A. Becker, K.D. Hyrenbach, C. Good, J. Barlow, K. Kaschner et al. 2006. Techniques for cetacean-habitat modeling. Marine Ecology Progress Series 310: 271-295. Silva, M.A. 2007. Population Biology of bottlenose
dolphins in the Azores archipelago. University of St. Andrews: PhD Thesis. 254 pp.
Silva, M.A., R. Prieto, I. Cascao, M.I. Seabra, M. Machete, M.F. Baumgartner & R.S. Santos 2014. Spatial and temporal distribution of cetaceans in mid-Atlantic waters around the Azores. Marine Biology Research 10(2): 123-137.
Silva, M.A., R. Prieto, S. Magalhães, M.I. Seabra, M. Machete & P. Hammond 2012. Incorporating information on bottlenose dolphin distribution into Marine Protected Area design. Aquatic Conservation: Marine and Freshwater Ecosystems 22: 122-133.
Thomas, L., S.T. Buckland, E.A. Rexstad, J. L. Laake, S. Strindberg, S. L. Hedley, J. R.B. Bishop, T. A. Marques & K. P. Burnham. 2010. Distance
Distribution of bottlenose dolphins in Madeira archipelago software: design and analysis of distance sampling
surveys for estimating population size. Journal of Applied Ecology 47: 5-14.
Vera, A.H. 2012. Quantification of the exposure of cetacean individuals to whale-watching vessels through the photo-identification technique in the South coast of Madeira Island (Portugal). BSc Degree, Faculty of Biology, University of Murcia,
Spain. 65 pp.
Yen, P.P.W., W.J. Sydeman & K.D. Hyrenbach 2004. Marine bird and cetacean associations with bathymetric habitats and shallow-water topographies: implications for trophic transfer and conservation. Journal of Marine Systems 50: 79–99. Received 27 Nov 2015. Accepted 19 Feb 2016. Published online 8 Aug 2016.