COMPETITIVENESS OF PORTUGUESE EXPORTS IN THE LAST
DECADE
Dos-Santos, Maria José Palma Lampreia1; Diz, Henrique2;
1Researcher DINÂMIA'CET-IUL–ISCTE and Assistant Professor ESCS-School of
Communication and Media Studies- IPL, Portugal, mjpls1963@gmail.com
2Faculty of Economics and Management, Lusofona University of Porto, ULP, Porto, Portugal,
diz.henrique@gmail.com
Abstract
The economic and financial crisis that has been affecting the world economy since 2008 affected the European countries in different ways. Portugal, a small peripheral country with a widely open economy suffered the consequences derived from the crisis that were amplified by a strong imbalance of the public accounts, large public and private debts, and insufficient levels of competitiveness of its industries and services. In order to aim at re-establishing the capability to grow, a restrictive budget procedure and changes in labour laws were put in place. Therefore, the economy may only significantly grow through an important increase in exports, sine internal consumption, both public and private, will continue to decrease.
This paper aims at evaluating the competitiveness of the major Portuguese exports at world level during the decade 2005-2014, analyzing the main groups of products. The methodology use was based on the Revealed Comparative Advantage (RCA). Results show that Portugal overtook the situation of a non-competitive to a competitive country in exports. However, the effect of the crisis can be seen from the fact that the value of exports decreased more than the rest of the world, as a consequence of the imbalance of public finances and of the restrictive political and fiscal measures taken to overcome the situation. From these results one may conclude that there is a need to increase the level of performance of the Portuguese economy, namely through measures aimed at growth in competitiveness, in internationalization, and thus including education, training and research.
Keywords : Revealed Comparative Advantage; Portugal; exports; competitiveness.
COMPETITIVENESS OF PORTUGUESE EXPORTS IN THE LAST
DECADE
Abstract
The economic and financial crisis that has been affecting the world economy since 2008 affected the European countries in different ways. Portugal, a small peripheral country with a widely open economy suffered the consequences derived from the crisis that were amplified by a strong imbalance of the public accounts, large public and private debts, and insufficient levels of competitiveness of its industries and services. In order to aim at re-establishing the capability to grow, a restrictive budget procedure and changes in labour laws were put in place. Therefore, the economy may only significantly grow through an important increase in exports, sine internal consumption, both public and private, will continue to decrease.
This paper aims at evaluating the competitiveness of the major Portuguese exports at world level during the decade 2005-2014, analyzing the main groups of products. The methodology use was based on the Revealed Comparative Advantage (RCA). Results show that Portugal overtook the situation of a non-competitive to a competitive country in exports. However, the effect of the crisis can be seen from the fact that the value of exports decreased more than the rest of the world, as a consequence of the imbalance of public finances and of the restrictive political and fiscal measures taken to overcome the situation. From these results one may conclude that there is a need to increase the level of performance of the Portuguese economy, namely through measures aimed at growth in competitiveness, in internationalization, and thus including education, training and research.
Keywords: Revealed Comparative Advantage; Portugal; exports; competitiveness.
Introduction
Portugal is in the middle of an economic and financial crisis originated in overwhelming public and private debt that were mainly the consequence of several factors: excessive internal demand, from private and public consumption, favoured by easy access to citizen´s and state debt; and a trade deficit that has been developing during the last decades.
This situation was aggravated with the impact of the subprime crisis in 2008 that sent the global economy to one of the worst recessions of the last decades. The causes, generally attributed by the majority of the authors to the speculative bubble in the United States and which reached mortgage market at high risk, are in fact, according these authors the result of
an imbalance between the public finances of the largest economies and the real economy accumulated in the years before the crisis broke out in the summer 2007.
The intense processes of trade liberalization and financial globalization have been the channels through which the crisis itself has spread, not only in the advanced economies but in the emerging and developing countries as well. The latter are becoming more and more integrated into the world economy but they are strongly dependent on the developed countries. This has triggered a recession process that is globally synchronized but also strongly asymmetrical, due to the differences in the productive structures of the countries, in the wealth accumulated and in the degree of their integration into the world economy. As a small and peripheral country, with a very open economy highly dependent on imports, with a diminutive average growth rate, Portugal was inevitably affected.
The additional effect of these external and internal factors led the country to a situation where it was no longer possible to ensure funding for its needs in the open markets and resulted in the intervention of the European Commission, the European Central Bank and the International Monetary Fund. A memorandum of understanding was signed between the Portuguese authorities and these international institutions. It brought financial assistance to the country but forced the execution of a hard adjustment program based on cuts in public expenses, both current and in investment, increases in taxes, decrease in salaries, liberalisation of labour laws aimed at increasing the flexibility of the labour market and decrease in unit production costs, and, finally, on the privatisation of the companies that still have public participation in their capital structure. Although the program ended in 2014, its effects are still present in the low salaries and high unemployment. And the fiscal measures taken continue in place to ensure that the route to public budget equilibrium continues to be followed and the competitiveness of the country keeps its trend to grow.
The majority of the researchers and politicians agree that the growth of the Portuguese economy has to be mainly based through the increase in exporting capability resulting from higher competitiveness either based on salary moderation and increased added value of the products. Therefore, the question we aim to answer in this work is: how can the Portuguese exports overtake the negative economic cycle that resulted from the economic and financial crisis that hit the country after the subprime episode of 2008. This paper aims at evaluate the competiveness of the main Portuguese exports at world level in the decade 2005-2014, based on the principal groups of goods with major impact on international trade.
The specific objectives are then: i) to estimate the impact of the subprime crisis in the Portuguese economy at the level of the behaviour of the Portuguese exports, especially ii) how did the private exporting firms responsible for the main exporting groups react? and iii) what may be their future contribution as far as competitiveness and contribution to growth of the Portuguese economy is concerned?
The paper aims to contribute to the literature in two ways. First in order to contribute to define a strategy for further expansion of Portuguese exports in international trade. Second to provide guidance to the Portuguese policy makers in order to increase the attractiveness conditions and technological development of the Portuguese exporter industry.
The evolution of main socio- economic indicators and the impacts of the
crisis in Portuguese economy
There is almost unanimity among different authors about the systemic effects of the subprime crisis in 2008 that led to a decrease in the rate of growth of the global economy (Crescimanno et al. 2014; Sanidas & Shin 2010; Thomé & Soares 2015). Their severity depended upon the economic structure and the financial situation of the countries, as well as the economic fragility associated with the structural, productive and financial structure and the different degrees of integration with the main global economies
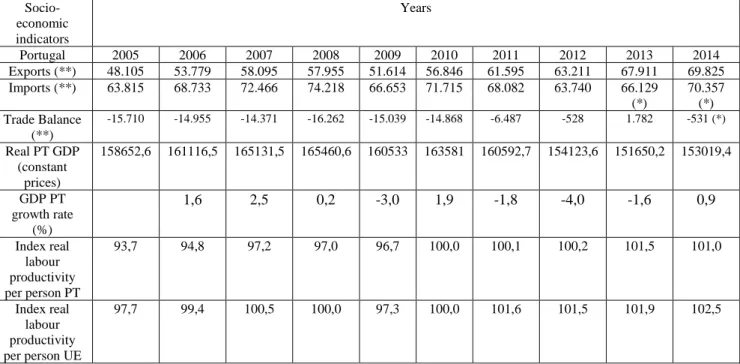
Table 1 presents the evolution of the main socio-economic Portuguese indicators during the 2005-2014 decade. Their analysis shows that, similarly to what happened in general with other European countries, the crisis became evident in its effects in Portugal in 2009, two years after the speculative crash in the United States, determining tendencies to negative variations of the GDP that were still in place in 2013. The largest deteriorations in this decade occurred in 2009 and 2012. In parallel, the Debt to GDP ratio reached 94%, as illustrated in Table 2, in the three year period 2011-2013, clearly above the established Maastricht criteria of a maximum of 60%. To this contributed, in 2009, not only the direct effects of the subprime crisis, but also the adoption of a restrictive budget policy and the excessive private and public debt, that resulted in diminishing household and public demand with consequences on domestic procurement and production.
However, the Portuguese economy seems to be recovering from the effects of the crisis and subsequent measures: the rate of growth of the GDP was 0.9% in 2014 and the International Monetary Fund predicts growths of 1.5% and 1.6% of GDP for 2015 and 2016, respectively.
Contributions to this result may have come from the decrease of all the expenses components of the GDP associated to a substantial increase in the exports as a result of the consolidation program that was undertaken in the four previous years.
The results in Table 1 also show that during the decade under analysis the trade balance was always negative, with the exception of 2013. Note that the value for 2014 is still provisional. To this result contributed the decrease in imports as from 2009 resulting from lower family income and company and public investment, and a simultaneous increase in the value of exports. It was then possible to change from a negative trade balance of -15 710 M euro in 2005 to a positive result of 1 782 M euro in 2013.
As for other socio-economic indicators, one may see that the index real labour productivity per person in Portugal is similar to the one found in other European Countries. On average, the differences are situated between one or two percentage points during the period under consideration. And that is a significant result.
Table 1. Evolution of some socio-economic Portuguese indicators (Source: authors calculations from OECD database,
2015; World Banc database, 2014; Eurostat database, 2015) Euro, millions (**)
Socio-economic indicators Years Portugal 2005 2006 2007 2008 2009 2010 2011 2012 2013 2014 Exports (**) 48.105 53.779 58.095 57.955 51.614 56.846 61.595 63.211 67.911 69.825 Imports (**) 63.815 68.733 72.466 74.218 66.653 71.715 68.082 63.740 66.129 (*) 70.357 (*) Trade Balance (**) -15.710 -14.955 -14.371 -16.262 -15.039 -14.868 -6.487 -528 1.782 -531 (*) Real PT GDP (constant prices) 158652,6 161116,5 165131,5 165460,6 160533 163581 160592,7 154123,6 151650,2 153019,4 GDP PT growth rate (%) 1,6 2,5 0,2 -3,0 1,9 -1,8 -4,0 -1,6 0,9 Index real labour productivity per person PT 93,7 94,8 97,2 97,0 96,7 100,0 100,1 100,2 101,5 101,0 Index real labour productivity per person UE 97,7 99,4 100,5 100,0 97,3 100,0 101,6 101,5 101,9 102,5
Table 2 presents the evolution of Portuguese debt to GDP during the period 2005-2014. Results show that in the actual macroeconomic frame, the Debt to GDP ratio is around 130%. Therefore, one may conclude that the budgetary policy will remain restrictive in the years to come. It should be remembered that the monetary policy is decided by the Eurogroup and
applied by the Portuguese government in the terms of the subsidiarity principle in the EU. It is therefore predictable that economic growth in Portugal may only occur as a consequence of an increase in exports or in direct foreign investment in the production of transactional goods. That is a reason for the analysis of the competitiveness of current Portuguese exports.
Table 2. Evolution of Portuguese debt to GDP (Source: authors calculations from World Banc database, 2015)
Three-year mobile average Portugal 2004-2006 2005-2007 2006-2008 2007-2009 2008-2010 2009-2011 2010-2012 2011-2013 2012-2014 2013-2015 Debt to GDP 62,8 63,9 68,3 71,7 83,7 94 111,1 125,8 129,7 130,2 (*2015 prevision)
Literature review
Trade models of classical and neo-classical theory (Ricardo, 1817; and 1951; and Ohlin, 1933) state that a country has a comparative advantage, i.e., favourable economic conditions that determine that is capable of producing a particular product / sector with relatively lower costs to export this product, while other countries have comparative disadvantages over the first. Then, one of the most powerful propositions of classical trade theory is that the pattern of international trade is determined by comparative advantage. Also, the international trade model of David Ricardo states that international trade is due to the differences in labour productivity between countries. However, the Heckscher-Ohlin model explains the existence of international trade based on differences in factor endowments and respective intensities. More recently, main authors also included the biggest industrial and technological transformation from the last centuries. Palley (2011), argues there is a new emphasis on the fact that comparative advantage in the modern world is created and not endowed. In the 18th century world, trade was driven by the search for exotic spices and raw materials. At that time, climate and natural resource endowments significantly determined the pattern of comparative advantage (in a traditional sense) and little could be done to alter this pattern. In today’s economy, comparative advantage (in a broader sense) is driven by technology, and technology can be importantly influenced by human action and policy.
Despite the numerous scientific advances in theories of international trade, RCA and its developments continue to be the largely used for studies involving different countries and products. There are several ways of using the RCA indices in analysing trade performance. The most common are to simply examine whether a given country has a comparative advantage in a given sector or sectors by comparing the calculated value and the comparative advantage neutral point, that is designated a country level (Sanidas & Shin 2010; Ferto & Hubbard 2003). According to the last author, these studies, specifically, can have a particular importance to the policymaking activities related to trade patterns at the country level, as it is the aim of the present study. Beyene (2014) also presented the main works due in this RCA level study and some gaps on these studies. However most of the authors will continue using the present method in order to better give some recommendations for decision makers.
Trade models of classical and neo-classical theory (Ricardo, 1817; and 1951; and Ohlin, 1933) state that a country has a comparative advantage, i.e., favourable economic conditions that determine which is capable to produce a particular product / sector relatively more costs low export this product, while other countries have comparative disadvantages over the first. Then, one of the most powerful propositions of classical trade theory is that the pattern of international trade is determined by comparative advantage. Also, the international trade model of David Ricardo states that international trade is due to the differences in labour productivity between countries. However, the Heckscher-Ohlin model explains the existence of international trade based on differences in factor endowments and respective intensities. More recently, main authors also agree and include the biggest industrial and technological transformation from the last centuries. Accordingly, Palley (2008), argues there is a new emphasis on the fact that comparative advantage in the modern world is created and not endowed. In the 18th century world, trade was driven by the search for exotic spices and raw materials. At that time, climate and natural resource endowments significantly determined the pattern of comparative advantage (in a traditional sense) and little could be done to alter this pattern. In today´s economy, comparative advantage (in a broader sense) is driven by technology, and technology can be importantly influenced by human action and policy.
There are several ways of using the RCA indices in analysing trade performance. The most common ways are to simply examine whether a given country has a comparative advantage in a given sector or sectors by comparing the calculated value and the comparative advantage neutral point, that is designated a country level. According to Beyene (2014) and Sanidas & Shin (2010), the RCA index analysis can be doing at 3 different level, namely, country-level; regional-level; and, trans-regional level. The first one, according the authors can sometimes “have limited their scope to the country level. These studies, specifically, can have a particular importance to the policymaking activities related to trade patterns at the country level”.
For Beyene (2014), the regional-level RCA studies means “the assessment of competitiveness has also been undertaken at a relatively wider scope that extends beyond a single country. And for trans-regional RCA study means the “The scope of studies on competitiveness can be expanded beyond a specified region to assess its status vis-à-vis other regions in the world. The authors also review the main previous works on each RCA level study.
Methodological Approach
Revealed Comparative Advantage (RCA) is a commonly used economics tool that makes use of trade patterns to identify the specific sectors, product groups, or commodities for which a country or region has comparative advantage (Beyene 2014) H. The method first created by Balassa (1965) had successive improvements by the author and by others, namely, Vollarth (1991 and Esmaeili (2014) by the use of Relative Trade Advantage index (RTA) one of the
export comparative advantage indices, which was used for the first time by to evaluate the export yield of country and different goods. (Amirteimoori1, and Chizari, 2008; Crescimanno et al. 2014)
According to Balassa (1977, 1979, 1986), to identify the sectors or products that have revealed comparative advantage, we need to compare the manufactured trade products in a country or region level with the world average for the same products. Thus, the RCA method is the ratio of the specific export manufactured products at a country level and around the world. In the model, the numerator includes total exports from a country of a particular commodity or group of products as a share of its total exports, and the denominator is the total world exports of that product or group of products as part of their total world exports. The analysis of Balassa work (1977; 1979 and 1986) reveals successive adjustments in the RCA index. On the present work we use the RCA initial formula by Balassa (1965) index, defined as:
j ij j i ij i ij ij t t t t RCAX
X
X
X
/ ( / ( Where:X means the exports, the indices i and j indicates, respectively, the product or sector and the
country analyzed.
iX
ijmeans the total exports of a country j in the period t
jX
ijmeans the world exports of product or commodities i in the period tX
iji j
means the total of world exports in the period tThe RCA index results may ranges between zero (0) and positive infinitive (+∞).A country has revealed comparative advantage in the specified sector or product if the RCA result value exceeds the unit (1).
The RCA model proposed that it might not be necessary to include all constituents affecting a country’s comparative advantage. Instead, it suggested that comparative advantage should be "revealed" by observed trade patterns, and in line with the theory, one needs pre-trade relative prices, which are not observable. Thus, inferring comparative advantage from observed data is called "revealed" comparative advantage (RCA). In practice, this is a commonly accepted method of analyzing trade data (Utkulu and Seymen, 2004; Amirteimoori, and Chizari, 2008) In the current paper an analysis of the initial Balassa (1965) formula was made, since the work was carried out at the 2-digit level intra-industry trade. So, according to Erlat and Erlat (2008)
the present method is adjusted, because other methods that include imports, for example, Lafay (1992), may very well indicate only for the 3-digit level of intra-industry trade.
Another contribution from Lafay (1992) to the deepening of the analysis of the evolution of world trade for a certain product that would enable the evaluation if a certain country had lost or gained space in the international market would be the performance index. This indicator tries to express the deviation that occurs between exports from a determined product in a region i to another region j and the one that would have occurred with the same participation in the market in the initial period. In the present case, it is considered that this analysis is not justified, since Portugal generally has a small contribution to the world market, when compared to other countries, namely from southern Europe. Instead, a proxy was used: the national and international performance of the same groups of products exported in an identical period to the analysis.
Information and data
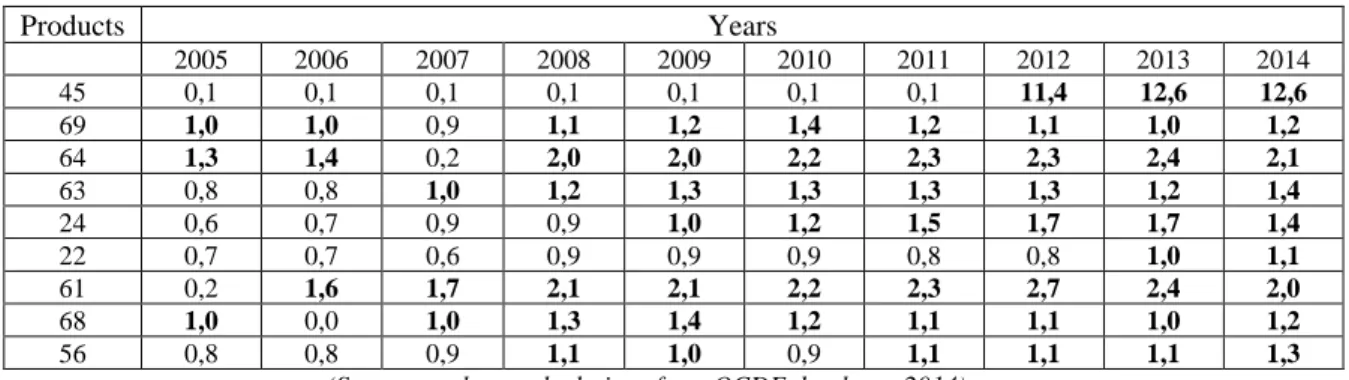
In the present study, the sectors/groups that were analysed to determine the world competitiveness of the Portuguese exports were taken from GEE/GEPARI (2010). The main criteria was the weight in world exports. They are, in general, related to the clusters previously identified by Porter, in 1992, at the request of the Portuguese government (Mira Amaral, 2014; Porter, 1998). Adopting the nomenclature adopted in international trade, the products are, in decreasing importance in Portuguese world exports: 45 - Cork and his works; 69 - ceramic products; 64 - Footwear, gaiters and the like, and parts thereof; 63 - Other made up textile articles; sets; articles of textile materials, footwear, hats and headgear, used; rags; 24 - Tobacco and manufactured tobacco substitutes; 22 - Beverages, spirits and vinegar (we may refer that the present group is almost formed by wine across the world and water for lusophones countries in Africa continent (Angola mainly); 61 - Apparel and clothing accessories, knitted or crocheted; 68 - Articles of stone, plaster, cement, asbestos, mica or similar materials; 68 - Folders (ouates), felt and nonwovens; twine, cordage, ropes and cables; articles thereof. We may refer that the value of exports of olive oil has considerably increase in the last years, but the added value still continues to be low, in part because there is some export in bulk. Due to this situation, the decision was taken not to analyze olive oil and this group of agro industry products. Information and data comes from OCDE database at national level and from COMTRADE database from United Nations at an international level.
Table 3 presents the results of RCA index in Portugal from 2005 to 2014 for the main world exports. The results confirm an increased competitiveness of Portuguese exports to the rest of the world, mainly verified in the period 2012-2014 with a special emphasis in the last two years during which all products under consideration present comparative advantages. However, the analysis of the first period of three years (2005-2007) reveals the practical inexistence of competitiveness of Portuguese exports and reveal competitive disadvantages. At that time only ceramics, footwear and the whole 64 products included in the group, stones (68) and part of the textiles were seen as competitive in international trade. Between 2007 and 2009, improvement was verified only in small groups, as ornamental stones. But they have since maintained the same level, despite a small increment at the end of the period.
The results of the products related to the clusters previously identified by Porter showed a strong shift towards higher competitiveness. Competitive advantages are relevant at the end of the period under scrutiny. Cork, for example, reaches a RCA value of 12.6, the highest of all Portuguese world exports. Ornamental stones, textile components, shoe ware and similar products that have very close RCA levels. Drinks have very good competitiveness levels, especially considering that they have been increasing since 2009, despite a small drop in the last year.
However, an analysis of movable averages is more adequate for the analysis, in order to avoid productive changes related to climatic conditions that influence, for example, production and consumption of alcoholic drinks, namely wine.
Table 3. Revelead comparative advantages in Portugal from 2005 to 2014 for mainly exports
Products Years 2005 2006 2007 2008 2009 2010 2011 2012 2013 2014 45 0,1 0,1 0,1 0,1 0,1 0,1 0,1 11,4 12,6 12,6 69 1,0 1,0 0,9 1,1 1,2 1,4 1,2 1,1 1,0 1,2 64 1,3 1,4 0,2 2,0 2,0 2,2 2,3 2,3 2,4 2,1 63 0,8 0,8 1,0 1,2 1,3 1,3 1,3 1,3 1,2 1,4 24 0,6 0,7 0,9 0,9 1,0 1,2 1,5 1,7 1,7 1,4 22 0,7 0,7 0,6 0,9 0,9 0,9 0,8 0,8 1,0 1,1 61 0,2 1,6 1,7 2,1 2,1 2,2 2,3 2,7 2,4 2,0 68 1,0 0,0 1,0 1,3 1,4 1,2 1,1 1,1 1,0 1,2 56 0,8 0,8 0,9 1,1 1,0 0,9 1,1 1,1 1,1 1,3
(Source: authors calculations from OCDE database, 2014)
Table 4 presents, respectevely, theresults of the annual growth rate of Portuguese and world exports during the period of 2005-2014 as a proxi of perfomamce analysis. During the present period the annual grow rate has a general tendency of decreasing, despite the the cyclical movements. This tendency accomplish boths Portuguese and world exports. The sistemic efects of the economic world crisis also reflets and explain the results.
The the annual perfomance Portuguese exports across the world is around the double of the value from world exports, mainly on the final of the period and for the mediterranean products, or clusters that were previously identify by Porter (1998) in the Portuguese economy. This means that Portugal still maintains an adequate perfomance level compared to the rest of the world. For exports like cork and similar manufactured products, that occours because Portugal still maintains the first position of producer, transformer and exporter. As far as the other groups of Portuguese exports are concerned, the majority of them come from “clusters” with associated brands and marketing strategies for homogenous groups of consumers. That means that the export products competitiveness is the result of quality and not quantity, as all the authors refer and is confirmed here.
Table 4. Annual Growth rate of Portuguese (PT) and world exports 2005-2014 (Source: authors calculations from OECD database, 2014) Products Years (PT) 2005 2006 2007 2008 2009 2010 2011 2012 2013 2014 45 -5,8 11,8 5,4 -47,0 10,1 34,8 -13,2 13,2 0,0 69 -1,4 2,2 2,1 -21,4 13,5 -15,4 -99,2 -8,0 -2,7 64 10,0 -87,9 1022,5 -10,3 9,3 8,2 -99,2 23,7 -27,1 63 4,7 23,0 11,1 -5,4 -1,2 5,1 -99,2 7,0 -3,2 24 25,7 13,5 -6,8 16,8 5,0 26,0 -99,0 4,0 -50,2 22 4,2 8,0 17,7 -8,6 -0,9 -6,5 -99,0 20,7 -4,9 61 954,0 13,4 15,0 -9,8 1,5 4,7 -99,2 7,9 -19,3 68 -99,0 11672,7 11,2 -18,1 -10,4 -4,1 -99,2 1,9 -8,1 56 12,1 6,2 9,6 -22,5 -0,3 16,0 -99,2 18,6 -13,4
Products Years (World)
2005 2006 2007 2008 2009 2010 2011 2012 2013 2014 45 2,6 6,0 -20,7 -21,0 7,0 7,5 27,8 -18,9 -26,9 69 9,6 14,5 -17,2 -24,6 6,9 9,7 24,6 -15,3 -44,1 64 7,7 10,5 -10,0 -14,7 9,9 17,7 15,2 -5,9 -39,0 63 6,5 9,6 -10,4 -11,2 6,7 13,8 15,1 -4,9 -41,2 24 10,2 -3,4 -9,1 -2,9 0,9 15,7 17,8 -14,9 -56,0 22 11,7 21,0 -18,9 -11,9 10,0 17,9 32,1 -17,4 -41,1 61 5,8 9,5 -5,8 -12,8 5,7 11,3 6,5 -3,5 -32,1 68 13,3 13,7 -12,4 -22,2 11,8 14,2 20,4 -11,8 -45,5 56 11,3 7,4 -11,0 -15,5 14,7 13,6 12,4 -10,1 -42,6
(Source: authors calculations from OCED database, 2014)
Table 4 presents a comparative analysis of growth rate as a proxy of the performance of Portuguese and World exports before and after the subprime crisis,. This analysis covers the periods from from 2005 to 2008 and from 2008 to 2014, as well as the overall rate of growth over the decade analised at national and worldwide level. The results from the comparative analysis of the subprime pre-crisis period, reveals that globally, both Portugal and the rest of the world showed positive growth rates during this period for the all the manufactured products, except in Portugal for footwear, whose industry, to the opposite Porter's recommendations was still dominated in the past, by a wide range of companies, many of which later failed , due the lack of investment in know-how, research and development. To
point out a growth rate of over 1000% during this period by the textiles in Portugal, whose industry due to the increasing liberalization of markets within the CMOs for textile, had already led to the failure the low know-how campanies like happens with the footwear sector before. Even so, the high performance of Portugueses textiles, also due to the high quality of the textile industry, though in a restricted way, which leads to the core of the multinational firms sector to middle-income segments of the market make use of the country, in the form of outsoorcing when it is required higher quality of production.
Despite that, i.e., although Portugual registered an annual growth rate much higher than that of world exports in the period 2005-2008, yet still has a long way in order to accomplish the world's exports perfomamce. These results can be confirmed when looking at national versus global developments since the sub-prime crisis globally over the last decade. These results are even worrying for Portugal, because, in general, the Portuguese exports reach perfomamce loss levels of around -100% in all product groups analyzed for the period from 2009-2014. That loss of performance can not be explained only by the impact of the subprime crisis in the world economy. So, during the same period, the world economy suffers only about 15% of export reduction for the most products analyzed, with a maximum value of one quarter (only for ceramic products), i.e., the actual world economy, suffered less impact than those who were felt in Portugal.
This Portuguese exports decreasing tendency is explaining by the highest exposure of of the country not only to world crisis but due the exposure to the internal economic and financial excessive public debt. So, the subprime crisis coupled with the weakness of the Portuguese public accounts had very negative effects which are also reflected in the real Portuguese economy more sharply than globally at world level.
For the Portuguese case, this sharp decline in export growth and, in parallel, a substantial increasing of exports competitiveness as the results of RCA index , means that the country is focusing on innovation, R&D, but the size of the country and the educational levels and entrepreneurs still continue low compared to the goals of the Strategy Europe 2020-.2020. So, the country needs to do a reinforcement on investment on education, training, excellence, entrepreneurship and I&D. Otherwise, in the future, we may even jeopardize the competitiveness that we can currently make for the analyzed products.
Despite the comparative analysis of the overall growth rate of exports during the decade under study, was result in a loss of Portuguese exports perfomamce in all product groups analyzed compared with world exports, although the perfomamance of the last ones also have decreased as a result of the effects of the economic crisis and the global decline in demand. That means that the decline of Portuguese exports resulted in a lower volume and a higher value, and, in this way broke up competititividade of Portuguese exports, is also observed that this increase in the competitiveness of Portuguese case, has not been the enough given the performance of world exports.
Table 5. Growth rates of Portuguese exports and the world exports before and after the subprime crisis
Products Growth rate of Portuguese exports 2005-2008 Growth rate of Portuguese exports 2008-2014 Growth rate of World exports 2005-2008 Growth rate of World exports 2008-2014 Growth rate of Portuguese exports 2005- Growth rate of World exports 2005-2014 45 5,34 -22,82 2,60 -20,96 -14,3 -40,5 69 0,74 -99,44 9,65 -24,61 -99,4 -45,7 64 -86,63 -99,22 7,74 -14,75 -98,8 -21,8 63 28,83 -99,19 6,46 -11,20 -98,8 -27,5 24 42,66 -99,22 10,18 -2,95 -99,0 -51,7 22 12,56 -99,08 11,70 -11,85 -98,8 -19,5 61 1094,91 -99,31 5,84 -12,75 -90,4 -21,9 68 19,41 -99,49 13,29 -22,25 -99,3 -35,1 56 19,13 -99,26 11,26 -15,50 -99,0 -32,0
(Source: authors calculations from OECD database, 2014)
Conclusions
This paper has examined the competitiveness of Portuguese exports and the ways in which it changed in the face of the economic and financial crisis, using the RCA index. The sharp fall in the world demand for the exports, associated to the "Portuguese clusters of manufactured products", led to a decrease in Portuguese exports, which was much higher than the decrease seen worldwide, despite the deal, some products Mediterranean typically manufactured, such as cork and its derivatives and alcohol formed almost exclusively by wine. Otherwise such causes in the real Portuguese economy may not be appropriate in a particular way to the impacts of the subprime crisis, but mainly to the financial imbalance of Portuguese public finances. This study also shows that economic growth in Portugal should mostly occur by way of increase in exports, due to financial problems created by excessive public debt of the past, with future repercussions, only likely to solve if there is noticeable economic growth in Portugal.
However subprime crisis and national competitiveness of exports are interrelated. This relationship have particularly importance to the countries like Portugal which are a small open economy with insufficient recourses to satisfy the consumer and investment demand within the country, thus need to import in order to add value to export products and use the income received for financing import and other operational activities as well as develop the country’s total economy.
From the point of view of macroeconomic theory the organization of financial markets faces a trade-off between liquidity and investment: on the one hand, they stimulate the development of productive activity by making the most liquid assets, freeing therefore the investor the irreversibility of the investment; on the other, it increases the speculative possibilities of earnings.
The results suggests the urgent need for strong commitment of the Portuguese public policies focus on economic growth, competitiveness and internationalization of the Portuguese economy on the strategic sectors. EU funds from Multiannual Financial Framework 2014-2020 should be refocused and reinforced to support investment on research and development. Portuguese economic and legal policies should also focus and create conditions to facilitate the overall level of the country on the attractiveness of foreign direct investment.
References
Amirteimoori, S. and Chizari, A. H. (2008). An Investigation of Comparative Advantage of Pistachio Production and Exports in Iran. J. Agric. Sci. Tech., 10: 395-403.
Balassa, B. (1965). “Trade liberalisation and "revealed" comparative advantage”. The Manchester school of economic and social studies, 33, 99-123.
Balassa, B. (1977). 'Revealed comparative advantage revisited: an analysis of relative export shares of the industrial countries”, 1953-1971. The Manchester school of economic and social studies, 45, 327-344.
Balassa, B. (1986), “Comparative Advantage in Manufactured Goods: A Reappraisal”, Review of Economics and Statistics, Vol. 68, No. 2, May, pp. 315-319.
Beyene, H.G., 2014. Trade Integration and Revealed Comparative Advantages of Sub-Saharan Africa and Latin America & Caribbean Merchandise Export. The International
Trade Journal, 28(5), pp.411–441. Available at:
http://www.tandfonline.com/doi/abs/10.1080/08853908.2014.952851.
COMTRADE: UN COMTRADE database (2015). United Nations Commodity Trade Statistics Database. ( http://comtrade.un.org/data/ acessed om 12/02/2015).
Crescimanno, M., Galati, A. & Bal, T., 2014. The role of the economic crisis on the competitiveness of the agri-food sector in the main Mediterranean countries. Agricultural Economics (Czech Republic), 60(2), pp.49–64.
Esmaeili, A., 2014. Revealed Comparative Advantage and Measurement of International Competitiveness for Dates. Journal of International Food & Agribusiness Marketing, 26(3), pp.209–217. Available at: http://www.scopus.com/inward/record.url?eid=2-s2.0-84904342300&partnerID=tZOtx3y1 [Accessed April 29, 2015].
Ferto, I. & Hubbard, L.J., 2003. Revealed Comparative Advantage and Competitiveness in Hungarian Agri-food Sectors. World Economy, 26(2), pp.247–259. Available at: http://search.proquest.com/docview/56158249?accountid=13042\nhttp://oxfordsfx.hoste. Hailay Gebretinsae Beyene (2014) Trade Integration and Revealed Comparative Advantages of Sub-Saharan Africa and Latin America & Caribbean Merchandise Export, The International Trade Journal, 28:5, 411-441, DOI: 10.1080/08853908.2014.952851
GEE|GPEARI BMEP – Boletim Mensal da Economia Portuguesa (2010). “Análise da Competitividade das principais exportações Portuguesas”, nº 12, sp.
INE – Instituto Nacional de Estatística (2014), “Contas nacionais – Agregados
Macroeconómicos, available at:
https://www.ine.pt/xportal/xmain?xpid=INE&xpgid=ine_cnacionais (accessed 12
January 2014).
Lafay, G. (1992). The measurement of revealed comparative advantages. In: DAGENAIS, M. G. & MUET, P.-A. (eds.) International Trade Modelling. London: Chapman & Hall. OECD database. (2015). Database various years (https://data.oecd.org/ acessed in
2/02/2015).Ohlin, B. G. (1933). Interregional and international trade, Cambridge : (1957 printing), Harvard Univ. Press.
Palley, T. I. (2008). Institutionalism and New Trade Theory: Rethinking Comparative Advantage and Trade Policy. Journal of Economic Issues (Association for Evolutionary Economics), 42, 195-208.
Porter, M. E. (1998). "Clusters and the new economics competition". Harvard Business Review. Reprint 98609.
Ricardo, D. 1817/1951. On the principles of political economy and taxation. In: SRAFFA, P. (ed.).The works and correspondence of David Ricardo, Vol.1. Cambridge, UK: Cambridge University Press.
Sanidas, E. & Shin, Y., 2010. Comparison of Revealed Comparative Advantage Indices with Application to Trade Tendencies of East Asian Countries. Department of Economics, Seoul National University, 2010, pp. 1-57, pp.1–57.
Thomé, K.M. & Soares, A.B.P., 2015. International market structure and competitiveness at the malted beer: from 2003 to 2012. Agricultural Economics (Zemědělská ekonomika), 61(4), pp.166–178. Available at: http://www.scopus.com/inward/record.url?eid=2-s2.0-84928116882&partnerID=tZOtx3y1 [Accessed April 29, 2015].
Vollrath T.L. (1991). “A theoretical evaluation of alternative trade intensity measures of revealed comparative advantage. Weltwirtschaftliches Archiv, Vol.127, pp. 265–280.