Universidade de Trás-os-Montes e Alto Douro
The importance of IMU devices as a kinematic
analysis complement in javelin throw
- Versão Final -
Master Thesis
International Master in Performance Analysis of Sports
Candidate: Flávia Rodrigues da Costa
Supervisor: Professora Dra. Eduarda Maria Coelho
Co-supervisor: Professor Dr. Orlando Fernandes
Universidade de Trás-os-Montes e Alto Douro
The importance of IMU devices as a kinematic
analysis complement in javelin throw
Master Thesis
International Master in Performance Analysis of Sports
Candidate: Flávia Rodrigues da Costa
Supervisor: Professora Dra. Eduarda Maria Coelho
Co-supervisor: Professor Dr. Orlando Fernandes
Declaração
Nome: Flávia Rodrigues da Costa Nº C.C: 14578685
Telemóvel: 934656829
Correio eletrónico: [email protected]
Mestrado: MSc. Internacional em Análise de Performance Desportiva
Título da dissertação: The importance of IMU devices as a kinematic analysis
complement in javelin throw
Orientadora: Professora Dra. Eduarda Maria Coelho Co-orientador: Professor Dr. Orlando Fernandes Ano de conclusão: 2020
Declaro que a presente dissertação é fruto de um trabalho efetuado por mim e pelos meus orientadores. O conteúdo inerente é de cariz original sendo todas as fontes devidamente consultadas e citadas tanto no correr de texto bem como na bibliografia final. Por fim, declaro que o mesmo trabalho não foi apresentado em nenhuma outra instituição para obtenção de grau académico.
In all science, error precedes the truth, and it is better it
should go first than last.
Agradecimentos
À Professora Eduarda por, para além de ser orientadora, ser uma amiga com a qual posso sempre contar.
Ao professor Orlando, que com toda a sua calma e compreensão, me ajudou e ensinou que há sempre solução para os obstáculos que se atravessam no caminho.
Ao Paulo Oliveira pela paciência e por ter estado sempre ao meu lado desde o início do processo. O Paulo tem as valências que qualquer profissional que se preze deseja ter – dedicação e competência!
Ao João, o meu companheiro de mestrado, por estar sempre comigo nas alegrias e nas adversidades, e por ser um excelente amigo! Percorremos meio mundo juntos e vivemos momentos que vamos, sem qualquer dúvida, levar para a vida. À Inês por ser a minha incondicional companheira, amiga de todas as horas, que com a palavra certa na hora certa, acreditou sempre em mim e me ensinou a ser melhor.
Às minhas amigas da Vibratuna que estão e estiveram sempre comigo ao longo desta caminhada, tornando-a mais fácil de percorrer!
Por fim, um agradecimento especial à minha mãe, ao meu pai e ao meu irmão por serem os meus pilares e me suportarem em todos os sentidos possíveis!
TABLE OF CONTENTS
Declaração i
Agradecimentos iii
List of Figures vi
List of Tables vi
List of Abbreviations and symbols vii
Background ix
CHAPTER 1 1
Abstract 2
1.1. Introduction 3
1.2. Methodology 5
1.2.1. Protocol and Registration 5
1.2.2. Selection Criteria 5 1.2.3. Literature Search 6 1.2.4. Quality Assessment 6 1.2.5. Data Extraction 7 1.3. Results 7 1.3.1. Study Selection 7
1.3.2. Methodological Quality Score 19
1.4. Discussion 19
1.4.1. Impulse, delivery and release phase 21
1.4.2. Release Velocity (V0) 24
1.4.3. Release Height (H0) 27
1.4.4.1. The release angle 30
1.4.4.2. The attitude angle 31
1.4.4.3. The attack angle 32
1.4.4.4. Sideslip 34
1.5. Limitations 35
1.6. Conclusions and Implications 35
CHAPTER 2 37 Abstract 38 2.1. Introduction 39 2.2. Methodology 42 2.2.1. Participants 42 2.2.2. Data collection 43
| THE KINEMATIC ANALYSIS APPLIED TO JAVELIN THROW: A SYSTEMATIC REVIEW
| THE IMPORTANCE OF THE IMU DEVICES AS A COMPLEMENTARY INFORMATION TO CINEMATIC ANALYSIS ON JAVELIN THROW
2.2.2.1. Instruments 43
2.2.2.2. Procedures 44
45
2.2.3. Data reduction and analysis 45
2.2.4. Statistical analysis 45
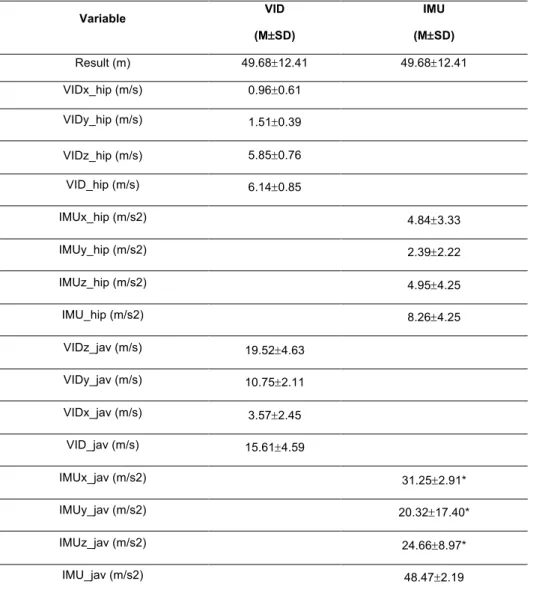
2.3. Results 46
2.4. Discussion 56
2.5. Limitations 58
2.6. Conclusions and practical application 58
3. References 59
List of Figures
Figure 1 – PRISMA (Preferred Reporting Items for Systematic reviews and
Meta-Analyses) flowchart. Javelin Throw analysis. ... 8
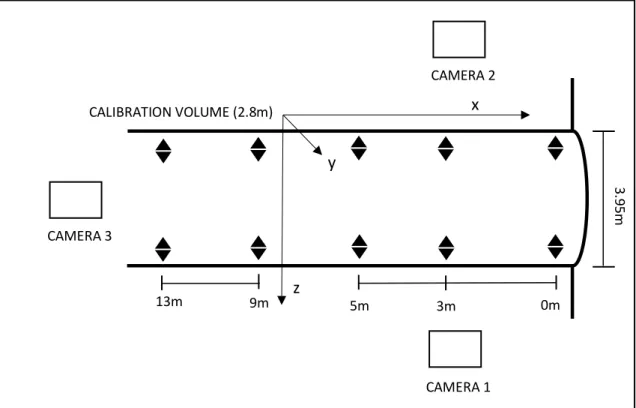
Figure 2 - IMU device Vmax Pro by Blaumann & Meyer - Sports ... 43 Figure 3 - Cameras and calibration set-up for data collection ... 45
List of Tables
Table 1 - Description of the included studies and methodological quality score,
n=26 ... 8
Table 2 – Methods, main results and relevant conclusions of the included
studies, n=26 ... 11
Table 3 – Main parameters results overview ... 18 Table 4 - Descriptive statistics of the studied variables ... 47 Table 5 - Hip video results of the maximum velocity vectors and velocity
resultant ... 48
Table 6 - Hip IMU results of the maximum acceleration vectors and resultant
acceleration ... 50
Table 7 - Javelin video results of the release velocity vectors and resultant
velocity ... 52
Table 8 - Javelin IMU results of the release acceleration vectors and resultant
acceleration ... 54
Table 9 - Pearson’s and Spearman’s correlation between the results (distance
throw) obtained in training and the velocity results acquired from the video and the acceleration results obtained from the IMU ... 55
List of Abbreviations and symbols
IAAF International Association of Athletics Federation
PRISMA Preferred Reporting Items for Systematic Reviews and
Meta-Analyses
IMU Inertial Measurement Unit
2D Two-dimensional
3D Three-dimensional
DLT Direct Linear Transformation
nm non-mentioned m male f female V Velocity T Time H Height V0 Release velocity H0 Release height Ð0 Release angle Dist Distance Sup Superior DS Double support CM Center of mass
VIDx_hip video hip’s maximum antero-posterior velocity
VIDy_hip video hip’s maximum proximo-distal velocity
VIDz_hip video hip’s maximum medio-lateral velocity
VIDv_hip Video hip’s resultant velocity
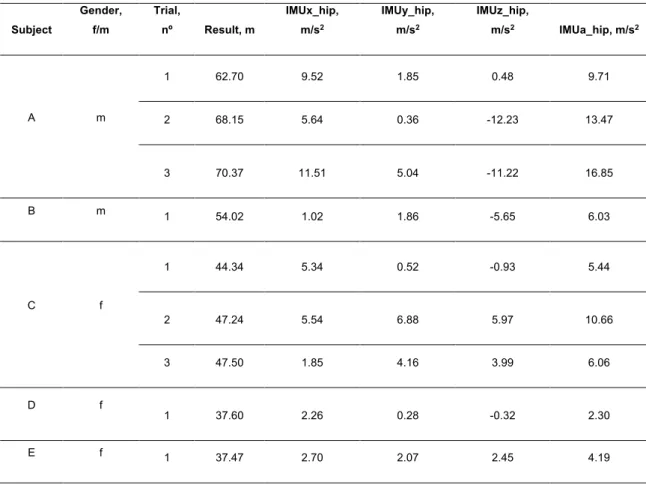
IMUx_hip IMU hip’s maximum antero-posterior acceleration
IMUy_hip IMU hip’s maximum proximo-distal acceleration
IMUz_hip IMU hip’s maximum medio-lateral acceleration
IMUa_hip IMU hip’s resultant acceleration
VIDy_jav video javelin’s maximum proximo-distal velocity
VIDz_jav video javelin’s maximum medio-lateral velocity
VIDv_jav Video javelin’s resultant velocity
IMUx_jav IMU javelin’s maximum antero-posterior acceleration
IMUy_jav IMU javelin’s maximum proximo-distal acceleration
IMUz_jav IMU javelin’s maximum medio-lateral acceleration
IMUa_jav IMU javelin’s resultant acceleration
r Pearson’s correlation or Spearman’s correlation coefficient
p p-value, statistical significance
M Mean
Background
The javelin throw is one of the four athletics throwing events and it’s recognized by its technique complexity (Hassan, 2015). As any other athletic throw, the main purpose of javelin throwing is to enable the implement to land as far as possible from the foul line (Bartonietz, 2000). The discipline movement characteristics indicate an acyclic translator motion (Frane, Borović, & Foretić, 2011) demanding a great ballistic capacity by enhancing predominately the explosive muscular ability of the thrower (Hassan, 2015). The javelin throw can be deconstructed in distinctive phases: the approach, transition, block and release, and follow-through. The first phase is the run-up which anticipates the javelin’s withdrawal. At this point, the thrower starts to develop and storing all the body velocity and kinetic energy which is transferred to the throw itself. The transition or crossover phase prepares the thrower for an optimal upper body control and it’s characterized by an active action of hip and legs. The penultimate step, meaning the impulse stride, at its final instant, it’s a vigorous forward drive of the final left leg (delivery) followed by the block and respective release. The block and release are the energic culminate of the preceding phases (Brown, Webb, & Sing, 2000). Regardless the thrower’s body and implement weight, the human body velocity is an extremely crucial factor at the beginning of the delivery, shaping the kinetic energy accumulated on the previous phases (Bartonietz, 2000). Therefore, the final throw phases imply a great physical and physiological load on the thrower’s body, especially at the block instant (Frane et al., 2011). Accordingly, the javelin throw is considered one of the most complex athletics events (Silvester, 2003). Throughout time, investigators have tried to understand this sport and its technique aiming the improvement of performance (distance). Traditionally, the release parameters have been recorded with high-speed filming/video-shooting (Viitasalo et al., 2003), using a two-dimensional or three-dimensional analyses of the collected information (Best, Bartlett, & Morriss, 1993; Campos, Brizuela, & Ramón, 2004; Campos, Brizuela, Ramón, & Gámez, 2002; Campos, Navarro, Vera, & Llobregat, 1994; Hussain & Bari, 2012; Jung, Kim, Kang, Chae, Lim, Yoon & Lee, 2012; Kaur & Deol, 2016; Leigh et al., 2013; Liu, Leigh, & Yu, 2010, 2014; Mero, Komi, Korjus, Navarro, & Gregor, 1994; Morriss, Bartlett, & Fowler, 1997; Saratlija, Zagorac, & Babić, 2013; Panoutsakopoulos &
Kollias, 2013) Nevertheless, these methods are considered slow ways to provide feedback for coaches and athletes (Viitasalo et al., 2003). According to Hubbard and Alaways (1989) in a training environment, information must be understandable and accessible within a relatively short period of time, so that the following throws’ technique can be upgraded based on the information taken from the previous one. That’s why recently, wearable technologies for monitoring human movement have become undoubtedly popular (Knight et al., 2007). Athletes are starting to set a growing role on the use of wearable sensor technology, since it enhances immediate feedback on workloads and technique (Li et al., 2016). Developments on these equipment have allowed individual athletes, team sports, physicians to monitor the motion associated (Loader et al., 2012), workload (Mooney et al., 2011; Varley et al., 2012) and biomarkers (Foster et al., 2010) in attempts to enhance performance and avoid injury. Lately, the Inertial Measurement Unit (IMU) based sensors have emerged to quantify human movement. IMU used in a biomechanical context are either build on accelerometers alone, a grouping with gyroscopes or a combination with both gyroscopes and magnetometers (Wirth et al., 2019). The IMU sensors have been validated for biomechanical analysis in areas like gait analysis (Kavanagh & Menz, 2008), swimming biomechanics (Magalhaes, Vannozzi, Gatta, & Fantozzi, 2015) and running kinematics (Provot, Chiementin, Oudin, Bolaers, & Murer, 2017). However, there are no studies on javelin throw using IMU devices. The present dissertation aims to review the studies related with javelin throw’s kinematic analysis in order to recognize what has been investigated and what’s lacking to improve performance assessment. Finally, after overviewing the past of javelin’s throw analysis, a new technology was applied to evaluate javelin’s throw kinematic parameters, aiming the future utilization on training and competition contexts.
Chapter 1
The kinematic analysis applied to javelin throw: a systematic
review
Flávia Costa1, Eduarda Coelho1, Orlando Fernandes2 e Paulo Oliveira3,4
1University of Trás-os-Montes and Alto Douro, Portugal
2University of Évora at Évora, Portugal
3Polytechnic Institute of Leiria, Portugal
The kinematic analysis applied to javelin throw: a systematic
review
Flávia Costa1, Eduarda Coelho1, Orlando Fernandes2 e Paulo Oliveira3,4
1University of Trás-os-Montes and Alto Douro at Vila Real, Portugal
2University of Évora, Portugal
3Polytechnic Institute of Leiria, Portugal
4Federação Portuguesa de Atletismo
Abstract
Introduction: The javelin throwing is a peculiar discipline in which the thrower intents to transfer the greatest acceleration from the run-up to the javelin at the instant of release. Javelin throw and biomechanics have kept a strong relationship, assisting on understanding its technique and its connection with performance outcomes. The present review aims to complete a deep overview of the studies related to javelin throw’s kinematic analysis, understand how javelin’s technical information has been assessed, and highlight future perspectives on kinematic tools for javelin’s evaluation. Methods: The PRISMA (Preferred Reporting Items for Systematic Reviews and Meta-Analyses) principles were followed in this review. PubMEd/MEDLINE, World Wide Science and IAAF’s research database. Results: Distance: Elite male=: 81.22 ± 4.01 m; Elite female= 60.98 ± 2.35 m; Non-elite male: 50.84 ± 13.6 m; Non-elite female: 34.83 m. Release Velocity: Elite male= 28.24 ± 0.87 m/s; Elite female= 23.53 ± 1.27 m/s; Non-elite male= 18.58 ± 4.33 m/s; Non-elite female= 17.42 m/s. Release Height: Elite male= 1.94 ± 0.08 m; Elite female= 1.82 ± 0.06 m; Non-elite male= 1.99 ± 0.13 m; Non-elite female= 1.89 m. Release Angle: Elite male: 34.38 ± 2.22º; Elite female: 35.52 ± 3.28 º; Non-elite male: 36.4º; Non-elite female: 44.2º. Conclusions: The release velocity is considered the most important parameter determining the distance thrown. The studies on javelin throwing use the video recording to analyze its kinematic parameters. Several parameters do not describe a linear efficiency tendency and show that different throwing techniques end out to be similarly effective.
1.1. Introduction
Some athletic throwing events, namely javelin throw, are characterized as acyclic translator movements (Frane et al., 2011). In a kinesiological view, throws are defined as ballistic movements, characterized by a great agonists activation which is followed by its relaxation and finishes with a de-acceleration of the agonists related with the antagonists’ action or passive extension of the connective tissues (Harasin, 2002). Specifically, the javelin throw stands out from the other throws by its overarm throwing feature, and accordingly, it is mandatory to throw over the shoulder or upper part of the throwing arm (Bartonietz, 2000; Van den Tillaar, 2005).
The javelin’s competition take place in particular standardized conditions (e.g. weight of implements, run-up characteristics) defined by the International Association of Athletics Federations (IAAF) (Harasin, 2002). During the competitions, the participants are ranked according to the distance accurately measured in meters (Harasin, 2002). Hence, the outcomes are objective and devoid of any kind of judge evaluation (Harasin, 2002). The implement weight is relatively small comparing with the other throws (600 gr for women and 800 gr for men) (Frane et al., 2011). Several authors have separated the javelin into distinct phases and different nomenclatures are utilized. Commonly, the throw is divided into: the approach phase (cyclic and acyclic phases), followed by the delivery phase (impulse phase, delivery phase and release phase) and finally, the follow through (recovery) (Bennet et al., 2017a; Jung et al., 2012; Menzel, 1986; Morriss & Bartlett, 1996).
The javelin throwing is a peculiar discipline in which the thrower intents to transfer the greatest acceleration from the run-up to the javelin at the moment of release (Silvester, 2003). The final throw phase represents a great physical and physiological challenge, especially when the thrower suddenly stops running and blocks (Frane et al., 2011). Accordingly, the javelin throw is one of the most complexes athletics events (Silvester, 2003). Given its complexity, investigators have studied this event, trying to understand its technique to improve the distance thrown (Viitasalo et al., 2003). The outcome distance depends on the values of the release parameters and the flight aerodynamics (Viitasalo et al., 2003).
Javelin throw and biomechanics have kept a strong relationship, since the biomechanics assist on understanding its technique and its connection with performance indicators (Viitasalo et al., 2003). Several studies evaluated parameters such as pull distance and steps length/duration (Jung et al., 2012; Mero et al., 1994); also release angle, attack angle, and body segments angles (e.g. tilt, rotation, abduction and extension) (Jung et al., 2012; Liu et al., 2010, 2014; Saratlija et al., 2013; Panoutsakopoulos & Kollias, 2013) release velocity (horizontal, vertical and/or lateral) (Mero et al., 1994; Viitasalo et al., 2003) and release height (Jung et al., 2012; Panoutsakopoulos & Kollias, 2013); angular velocity (Liu et al., 2014) and velocity of the segments (e.g. elbow, shoulder and hip) (Campos et al., 2004, 2002). The majority of previous studies carried out their analysis through video analysing software, using a two-dimensional or three-dimensional kinematic analysis (Best, Bartlett, & Morriss, 1993; Campos, Brizuela, & Ramón, 2004; Campos, Brizuela, Ramón, & Gámez, 2002; Campos, Navarro, Vera, & Llobregat, 1994; Hussain & Bari, 2012; Jung et al., 2012; Kaur & Deol, 2016; Leigh et al., 2013; Liu et al., 2010, 2014; Mero et al., 1994; Morriss, Bartlett, & Fowler, 1997; Saratlija et al., 2013; Panoutsakopoulos & Kollias, 2013). A different method was used by Viitasalo, Mononen and Norvapalo (2003) reporting a research based on an Infrared Photocell Gate to measure the release parameters on the foul line. Hence, the literature available is mainly video analysis based. According to Bartlett and Best (1988), the three-dimensional analysis is recommended to improve technique’s feedback. Traditionally, the release parameters have been recorded using high-speed filming/video-shooting. However, this method turns out to be a slow way to provide feedback for coaches and athletes (Viitasalo et al., 2003). As alleged by Hubbard and Alaways (1989) in a training context, information must be accessible within a relatively short period of time, so that the following throws’ technique can be upgraded based on the information taken from the previous one. That’s why in the past few years, wearable technologies for monitoring human movement have become undoubtedly popular (Knight et al., 2007). A trend has started to rise around athletics environment to monitor performance during real-time activities (Li et al., 2016). Devices, such as accelerometers, turn out to be an attractive instrument for detection and measurement of human motion (Knight et al., 2007).
The aim of the present review is to complete a deep overview of the studies related with javelin throw’s kinematic analysis in order to recognize what’s been investigated and what’s lacking to improve performance assessment. Are there studies that use new technologies? Are these new technologies helpful to improve feedback’s celerity and maintain/improve its quality? Thus, this review intents to understand the past to identify the emergent necessities and trends of new technology.
1.2. Methodology
1.2.1. Protocol and Registration
The PRISMA (Preferred Reporting Items for Systematic Reviews and Meta-Analyses) principles were followed in this review. The PRISMA philosophy includes 27-item checklist and a four-phase flow diagram which aims to help authors reporting systematic reviews and meta-analysis (Moher, Liberati, Tetzlaff, Altman, & The PRISMA group, 2010).
1.2.2. Selection Criteria
Studies investigating javelin throw were included if they met the following criteria: (1) kinematical analysis of javelin; (2) analysis of javelin’s parameters mainly at the last phases; (3) body segments contributions and its connection with the outcome; (4) relationship between the kinematic parameters and the performance; (5) written in English or Portuguese; (6) published in a peer-published journal or official reports from the International Association of Athletics Federations (IAAF).
Studies were excluded if they met one or more of the following reasons: (1) not written in English; (2) not published in a peer journal or non-official reports from the International Association of Athletics Federations (IAAF); (3) not about javelin throw’s analyses itself.
1.2.3. Literature Search
A systematic and computerized search of PubMEd/MEDLINE and World Wide Science was conducted using the key-words “javelin throw”, “javelin throw analysis”, “javelin throw kinematics” and “javelin throw biomechanics”. Also, in the International Association of Athletics Federations’s (IAAF) Research Database website are available official biomechanical reports of the latest World Championships which are additional relevant data on javelin throw. After literature search completion, a screening was performed to retrieve relevant publications.
1.2.4. Quality Assessment
All pertinent studies were submitted into a formal methodological assessment by two independent reviewers. There’s no validated quality assessment protocol appropriated for this study area (i.e. sports performance) (Costa, Balasekaran, Vilas-Boas, & Barbosa, 2015), therefore the methodological quality of each paper was evaluated by Downs and Black (1998) quality index which is divided on the following categories: Reporting (10 items), External validity (3 items), Internal validity - Bias (7 items), Internal validity - Confounding (6 items) and Power (1 item). Subsequently, the index is composed by 27 items where each answer is scored 0 or 1, except for one item in the Reporting subscale which scored 0 to 2 and the single item on the Power scored 0 to 5. The total maximum score is 32 (Downs & Black, 1998). However, in order to adapt the index to this study field, some adjustments were implemented and the following items weren´t considered: (i) item 5, item 14, item 15, item 17, item 21, item 22, item 23, item 24, item 25 (Macadam, Cronin, & Feser, 2019; Moens et al., 2019) and item 27 (Feitosa, Correia, Barbosa, & Castro, 2019; Macadam et al., 2019) were not contemplated; (ii) the words ‘patient’ was replaced by ‘participant’ and ‘treatment’ by ‘testing’ (Feitosa et al., 2019). This modified version attributes a score value of 0 or 1 on the index reduced subcategories: Reporting (9 items), External validity (3 items), Internal validity - (5 items). A total score <10/17 was considered as low quality and scores ³10/17 were assumed to
be high quality (Macadam et al., 2019; Moens et al., 2019) and studies with higher total scores were assumed to have a greater value (Feitosa et al., 2019). When required, disagreements between reviewers were solved by dialogue and consensus.
1.2.5. Data Extraction
The data collection was independently performed by one author in its master thesis context. The point of this search was to collect what has been studied around the javelin throw, which technologies have been used to access performance and what’s emerging around the human movement analysis which can be applied on the javelin throw.
1.3. Results
1.3.1. Study Selection
The literature search throughout database identified 45 studies. Full-text analysis of 33 studies was performed, with 26 studies meeting inclusion criteria defined previously on this systematic review (Figure 1).
Ide nt if ic at ion Sc re en in g El ig ib il it y Inc lud ed
Records identified through database searching
(n=45)
Records after duplicates removed (n=43) Records screened (n=33) Studies included in qualitative synthesis Records excluded (n=10) Full-text articles excluded with reasons
(n=7)
29: not written in English or Portuguese 27: did not measure javelin’s parameters or
athlete’s performance 21: not a study 20: mathematical
simulation 15: doesn’t present the
results 12: not a study 11: did not measure javelin’s parameters or Full-text articles
assessed for eligibility
Table 1 - Description of the included studies and methodological quality score, n=26
Sample, n Context Age, yrs
(M±SD) Gender, f/m Aim Quality score (Aleksić-Veljković et al., 2012) 10 Serbian and 3 elite javelin throwers Javelin throwers of the 2011 Serbian Cup Final (Novi Sad) and javelin throwers of the 2011 World Championships (Daegu) 18.3; 27.6 f Determine differences in kinematic parameters between the elite competitors in the World Championship 2011 and Serbian Cup competitors in 2011. 13 (Bartlett et al., 1996) 6 novices and 6 over 50m
Novice and club throwers groups carried out on a Tartan javelin runway at the University of Innsbruck, Austria, in 1992. Elite group from the 1993 AAA National Championships (England) nm m Determine differences between values of 3D release parameters for male javelin throwers of different skills levels and relate these features with javelin throw technique.
12
(Bennett, Walker, Bissas, & Merlino, 2017a) 13 javelin throwers 2017 IAAF World Championships, London nm m Analyze biomechanically the Men’s final in London’s World Championship 2017 9
(Bennett, Walker, Bissas, & Merlino, 2017b) 12 javelin throwers 2017 IAAF World Championships, London nm f Analyze biomechanically the Women’s final in London’s World Championship 2017.
9
(Best et al., 1993) 5 male 4 female
1991 World Student Games, Sheffield.
nm m & f
Obtain accurate 3D release parameters values for elite javelin throwers in a top-level competition; relate these features with javelin throw technique; compare 2D with 3D data. 9 (Campos et al., 2004) 7 1999 World Athletics Championships, Sevilla nm m Compare throwers individual models in the light of the documented data available on the biomechanical analysis of javelin throw. 11 (Campos et al., 2002) 8 spanish and 7 elite Spanish National Athletic Championship in
nm m Compare the differences between Spanish javelin 11 Figure 1 – PRISMA (Preferred Reporting Items for Systematic reviews and Meta-Analyses) flowchart. Javelin Throw analysis, n=26
Valencia 2001 and World Athletic Championships in Sevilla 1999
throwers and a group of world class javelin throwers.
(Campos et al.,
1994) 2
Currently, the best Spanish javelin throwers
nm m
Find out significant relations between given parameters; understand the influence that each of them has in performance.
9
(Hassan, 2015) 20 Sport Students
selected randomly 18 ± 0.7 m
Identify the use of biomechanical simulation system to evaluate physical variables in javelin throw.
12
(Hussain & Bari,
2012) 6
Javelin throwers from Aligarh Muslim University in All- India Athletic meets from 2008 to 2010.
21.87 ± 1.64 m
Investigate the relationship between the result and the kinematic parameters of javelin throw to clarify the individuality of the movement.
12
(Ito, Ishikawa, Isolehto, Komi & Murakami, Tanabe, 2006) 8 elite and 49 Japanese javelin throwers 2005 IAAF World Championships, Helsinki and the Japanese throwers participated in four domestic athletic meetings
nm m
Clarify the characteristics of the throwing movement in the javelin by investigating the relationships between kinematic parameters of the movement and the distance thrown. 12 (Jung et al., 2012) 8 2011 IAAF World Championships, Daegu nm f
Provide data on the throwing skills of world class athletes and analyse the kinematic variables for the women’s javelin.
12
(Kaur & Deol, 2016) 5
India inter university level from Punjabi University
18-25 m
Investigate the relationship between the result and the kinematic parameters of javelin throw to clarify the individuality of the movement.
11
(Komi & Mero, 1985) 5 male 6 female javelin throwers 1984 Olympic
Games, Los Angeles nm m & f
Examine the biomechanical features of male and female in Los Angeles Olympic Games to offer coaches’ more information.
12
(Kunz & Kaufmann, 1983) 12 decathletes and 2 javelin throwers National Swiss Decathlon Competition in 1978, Weinfelden 19-27 m Correlate biomechanical factors and maximal distance thrown. 11
(Lehmann, 2010) 12 male 13 female javelin throwers 2009 IAAF World Championships, Berlin nm m & f
Give a guidance for coaches and athletes to prepare for future high-level competitions. Parameters describing the throwing technique were averaged for the two groups of finalists and compared to find those that explained the differences in the final displacements.
10
(Leigh et al., 2013) 40 female 40 male
USATF
Championships from 2007 to 2010
nm m & f
Calculate the upper extremity kinetics of elite javelin throwers to determine associations between javelin technique variables and upper extremity kinetic variables.
13
(Liu et al., 2010) 30 male 30 female
Elite javelin throwers who competed in the 2007 and 2008 USA Track and Field Outdoor National Championships
nm m & f
Analyze the sequences of lower and upper extremity segments and joints angular motions in javelin throw.
12
(Liu et al., 2014) 32 male 30 female
Elite javelin throwers who competed in the 2007 and 2008 USA Track and Field Outdoor National Championships
nm m & f
Determine the effects of sequence initiations of trunk and arms angular motions and the sequence of maximum trunk and arm angular velocities in javelin’s throw. 13 (Mero et al., 1994) 11 male 11 female 1992 Olympic Games, Barcelona 26 ± 3.2; 27.1 ± 4.7 m & f
Investigate body segment contributions in male and female javelin throwers. 13
(Morriss, Bartlett, & Fowler, 1997) 12 elite javelin throwers 1995 IAAF World Championships, Gothenburg nm m
Accurately record the biomechanical parameters and provide a better understanding how release speeds are achieved.
10 (Panoutsakopoulos & Kollias, 2013) 16 IAAF competitions held in Greece between 2006 and 2009 28.5 ± 4.3 f
Quantify the spatio-temporal and kinematical parameters of the delivery phase and release parameters of the javelin throw executed by top female athletes in competition.
(Panoutsakopoulos, Vujkov,
Kotzamanidou, & Vujkov, 2016)
7
Young Club level Serbian javelin throwers
19 ± 1.0 m
Investigate the correlation of the parameters with the throwing distance of young javelin throwers. 12 (Saratlija et al., 2013) 16 European Junior Championships 2009, Novi Sad 17-19 m
Define the influence of the kinematic parameters in the javelin throw outcomes. 13
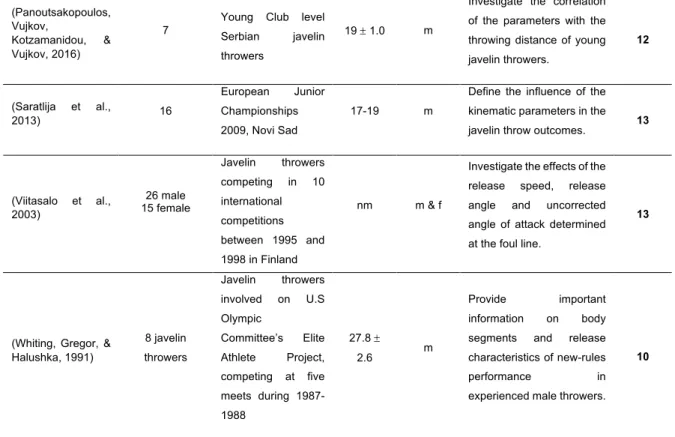
(Viitasalo et al., 2003) 26 male 15 female Javelin throwers competing in 10 international competitions between 1995 and 1998 in Finland nm m & f
Investigate the effects of the release speed, release angle and uncorrected angle of attack determined at the foul line.
13
(Whiting, Gregor, & Halushka, 1991) 8 javelin throwers Javelin throwers involved on U.S Olympic Committee’s Elite Athlete Project, competing at five meets during 1987-1988 27.8 ± 2.6 m Provide important information on body segments and release characteristics of new-rules performance in experienced male throwers.
10
* nm – non-mentioned; m – male; f – female.
Table 2 – Methods, main results and relevant conclusions of the included studies, n=26
Method Main results Conclusions
(Aleksić-Veljković et al., 2012)
Serbian Cup: 1 CASIO FX high speed camera (300 fps) placed laterally to the runway filming the impulse stride, delivery stride and release. 2D kinematic analysis with HUMAN software. (M ± SD): Result= 34.83 ± 6.72 m, V0= 17.42 ± 3.74 m/s, H0= 1.89 ± 0.09 m, Ðattitude= 43.7 ± 6.11 º, Ð0= 44.2 ± 5.67 º, Ðattack= 0.9 ± 0.88 º, Timpulse stride= 347.4 ± 42.40 ms, Tdelivery stride= 180.1 ± 37.71 ms, Trelease= 153 ± 25.9 ms,
Dist.impulse stride= 1.55 ± 0.33 m,
Dist.delivery stride= 1.19 ± 0.21 m
In order to ensure a proper training load, it’s necessary to understand the biomechanical and neuro-muscular demands of this athletic discipline. The results and information about movement parameters should be used more often by the coaches.
(Bartlett et al., 1996)
Novice and standard athletes: 2 PANASONIC F15 Video Cameras (50 fps). Video recording digitized using Peak Performance System (3D analysis).
Elite athletes: 2 PHOTOSONICS 1PL high-speed Video Cameras (100 Hz) (M ± SD) Elite: Result= 74.7 ± 1.77 m; V0= 27 ± 0.9 m/s; Ð0= 37.1 ± 2.56º; Ðattack=0.34 ± 4.31º, Ðyaw=-3.27 ± 3.07º. (M ± SD) Standard: Result= 45.8 ± 5.53 m; V0= 18.2 ± 1.35 m/s; Ð0= 32.3 ± 3.62º;
Greater throw distances were largely attributable to greater release speeds. The other release parameters where significant differences between groups were found was the yaw angle. With regard to aspects of throwing technique, the increase in release speed with increasing skill across the groups was related to greater run-up speeds and greater peak speeds of the throwing arm
Ðattack=1.83 ± 3.31º, Ðyaw=-2.33 ± 2.53º. (M ± SD) Novice: Result= 29.8 ± 3.81 m; V0= 15.3 ± 1.44 m/s; Ð0= 33.4 ± 5.08º; Ðattack=-1.7 ± 1.46º, Ðyaw=-9.64 ± 4.9º.
segments relative to center of mass during the delivery stride. The significantly longer acceleration paths for the elite throwers were also important to generate greater release speeds.
(Bennett, Walker, Bissas, & Merlino, 2017a)
3 high speed cameras SONY PXW-FS7 (150 Hz, 1/1250 shutter, ISO: 2000/4000, FHD: 1920x1080 px) to provide 3D footage. Videos imported to SIMI MOTION and manually digitized to obtain kinematic data. All points tracked 15m before the foul line and 10 frames after release. DLT algorithm was used to reconstruct the real-world 3D coordinates from individual camera’s x and y image coordinates. (M ± SD): Result: 84.36 ± 4.17 m; V0= 27.93 ± 0.71 m/s, H0= 1.99 ± 0.12 m, Ðattitude= 39.58 ± 4.15 º, Ð0= 34.39 ± 2.66 º, Ðattack= 5.19 ± 3.65 º, Ðsideslip= 14 ± 4.24 º, Ðtrunk= 58.7 ± 6.82 º, Ðupperarm= 47.72 ± 8.49 º, Ðforearm= 61.89 ± 6.15 º, Timpulse stride= 361.66 ± 51.47 ms, Tdelivery stride= 203.54 ± 38.69 ms, Trelease= 128.77 ± 12.49 ms,
There is a very strong correlation (0.85) between distance thrown and release velocity. However, the data shows that gold medal winner with 28.48 m/s did not generate the fastest release velocity; the bronze medallist produced the fastest release velocity javelin at 29.17 m/s with the 5th placed athlete delivering the second fastest release velocity at 28.55 m/s. Clearly, other key factors influenced how far their respective javelins flew.
(Bennett, Walker, Bissas, & Merlino, 2017b)
3 high speed cameras SONY PXW-FS7 (150 Hz, 1/1250 shutter, ISO: 2000/4000, FHD: 1920x1080 px) to provide 3D footage. Videos imported to SIMI MOTION and manually digitized to obtain kinematic data. All points tracked 15m before the foul line and 10 frames after release. DLT algorithm was used to reconstruct the real-world 3D coordinates from individual camera’s x and y image coordinates. (M ± SD): Result: 63.37 ± 2.36 m; V0= 24.32 ± 0.99 m/s, H0= 1.86 ± 0.1 m, Ðattitude= 40.73 ± 5.73 º, Ð0= 34.86 ± 3.33 º, Ðattack= 6.08 ± 6.05 º, Ðsideslip= 8.89 ± 9.07 º, Ðtrunk= 58.38 ± 5.24 º, Ðupperarm= 42.18 ± 14.14 º, Ðforearm= 55.16 ± 8.03 º, Timpulse stride= 366 ± 35.83 ms, Tdelivery stride= 200 ± 32.46 ms, Trelease= 140.5 ± 12.09 ms,
Dist.impulse stride= 1.68 ± 0.25 m,
Dist.delivery stride= 1.59 ± 0.21 m
In terms of release velocity, gold medal winner had the highest recorded velocity of the finalists generating 26.42 m/s, this was 1.14 m/s faster than 4th place (28 m/s)
and 1.51 m/s quicker than silver medallist who released the javelin at 24.91 m/s. There are many physiological and psychological factors that are unknown or very difficult to quantify that can positively or negatively impact a performance on the day of the competition.
(Best et al., 1993)
2 PANASONIC 1PL high-speed Video Cameras (100 Hz). Peak Performance System was used for calibration. The 3D world coordinate of 18 points was reconstructed using DLT algorithm. The smoothed coordinates were transferred to Peak Performance Technologies 3D Motion Analysis System. Analysis of release, temporal and kinematic parameters. Men (M ± SD): Result: 80.45 ± 6.7 m; V0= 28.4 ± 2.26 m/s Women (M ± SD): Result: 59.29 ± 2.19 m; V0= 24.47 ± 0.23 m/s
Analysis of javelin throw kinematics from 3D perspective provides a far more detailed assessment of technique than the 2D.
The majority of release parameters values of 2D and 3D are similar. However, other important parameters, such as sidleslip, cannot be assessed with 2D analysis.
(Campos et al., 2004) 2 synchronized SVHS Panasonic Video Cameras (50 fps). 3D (M ± SD): Result: 86.46 ± 2.32 m; V0= 29 ± 0.63 m/s, H0= 1.97
Each athlete has its particular technique, timings and individualities. Nevertheless,
photogrammetric analysis. Modulated reference system for spatial calibration. Kinescan 8.3 (IBV) software for the digitizing.
± 0.13 m, Ðattitude= 36.34 ± 5.36
º, Ð0= 33.5 ± 4.11 º, Ðattack=
2.84 ± 5.31 º
these individual patterns are conditioned by efficient filters. There are minimum requirements needed to throw the javelin at a long distance. All individualities affect the kinetic chain at the final release phase. The aspects that distinguish the best thrower from the other is that he throws in a more rectilinear way and at higher position. His path of acceleration is also longer, and his release conditions are more appropriate.
(Campos et al., 2002)
2 synchronized S-VHS Video Cameras (50 fps). 35 variables were analysed and compared between groups. 3D photogrammetric technique. World Class >80 m (M ± SD): Result: 86.45 ± 2.31 m; V0= 28.91 m/s, H0= 1.97 m; National <75 m (M ± SD): Result: 68.39 ± 2.78 m; V0= 24.80 m/s, H0= 1.90 m Significant statistical differences in: V0, Vpeak elbow,
Vpeak shoulder, Shoulder/hip axis
rotation at release, Ðrigh knee at release, H0, Vvertical at release,
Vhorizontal at release, Ðelbow at delivery
The major differences occur at the final throw phases. World class athletes have a greater ability to use power of the body to accelerate the javelin. When compared with Spanish athletes, world class group evidenced javelin speed, shoulder and elbow speed, rotation lines of hips and shoulders, extension of elbow at release, throw position, increase of speed on the final phases
(Campos et al., 1994)
2 high speed cameras (200f fps). The DLT was used to calculate 3D coordinates. This study includes mechanical variables (position and velocity of the markers, left knee angle, shoulder as hip lines in the horizontal plane) and statistic variables (discrete sets of data to the value of the variable in different throws).
The only significant value corresponds to the negative index between T1 and T2 – r=
0.67, p=0.004
T1 – corresponds to the
moment when the left foot touches de ground at the beginning of the final throwing phase; T2 – corresponds to the
moment where the tense arch is generated.
In order to improve performance, the athlete should: on one hand, try to get the tense arch position as soon as possible and, on the other hand, try to make the last phase of the moment as long as possible.
(Hassan, 2015)
Simulation system: steel rods, litter sled, LAVEG laser velocity device and DAS3 software. V0 (release
velocity), acceleration due to gravity and correlate this with a predicted distance.
rrelease velocity = 0.84 The introduction of information technology
into the sports performance environment appears to be a positive, although not always essential, step towards achieving an effective and efficient way of learning
(Hussain & Bari, 2012)
1 Video Camera Legaria CANON (50 Hz), placed perpendicularly to the runway. Correlation between release parameters, pull distance, pull time, segment angles, with thrown distance.
rinitial velocity = 0.764; p< 0.001
rpull distance = 0.415; p< 0.001
rapproach run v. = 0.722; p< 0.001
Insignificant rHo, rÐ0, rÐ attack
To improve javelin’s performance, authors advice an achievement of positive acceleration during running approach, an effective thrusting with the right leg on the penultimate stride, and carry the javelin with an optimal angle on the last strides
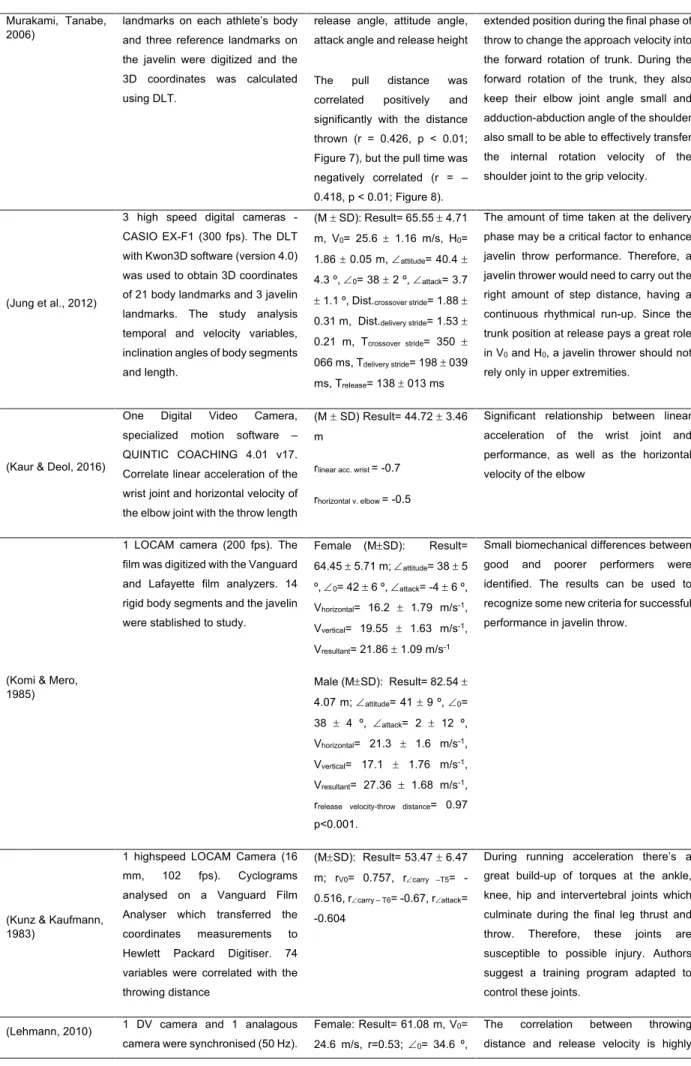
(Ito, Ishikawa, Isolehto, Komi &
2 video cameras (200 fps for Japanese and 60 fps for the World Championships). 24 reference
non-significant correlations were obtained between the distance thrown and the
Elite athletes compared with the Japanese: approach with faster velocity and keep the front knee angle in the
Murakami, Tanabe, 2006)
landmarks on each athlete’s body and three reference landmarks on the javelin were digitized and the 3D coordinates was calculated using DLT.
release angle, attitude angle, attack angle and release height The pull distance was correlated positively and significantly with the distance thrown (r = 0.426, p < 0.01; Figure 7), but the pull time was negatively correlated (r = – 0.418, p < 0.01; Figure 8).
extended position during the final phase of throw to change the approach velocity into the forward rotation of trunk. During the forward rotation of the trunk, they also keep their elbow joint angle small and adduction-abduction angle of the shoulder also small to be able to effectively transfer the internal rotation velocity of the shoulder joint to the grip velocity.
(Jung et al., 2012)
3 high speed digital cameras - CASIO EX-F1 (300 fps). The DLT with Kwon3D software (version 4.0) was used to obtain 3D coordinates of 21 body landmarks and 3 javelin landmarks. The study analysis temporal and velocity variables, inclination angles of body segments and length.
(M ± SD): Result= 65.55 ± 4.71 m, V0= 25.6 ± 1.16 m/s, H0=
1.86 ± 0.05 m, Ðattitude= 40.4 ±
4.3 º, Ð0= 38 ± 2 º, Ðattack= 3.7
± 1.1 º, Dist.crossover stride= 1.88 ±
0.31 m, Dist.delivery stride= 1.53 ±
0.21 m, Tcrossover stride= 350 ±
066 ms, Tdelivery stride= 198 ± 039
ms, Trelease= 138 ± 013 ms
The amount of time taken at the delivery phase may be a critical factor to enhance javelin throw performance. Therefore, a javelin thrower would need to carry out the right amount of step distance, having a continuous rhythmical run-up. Since the trunk position at release pays a great role in V0 and H0, a javelin thrower should not
rely only in upper extremities.
(Kaur & Deol, 2016)
One Digital Video Camera, specialized motion software – QUINTIC COACHING 4.01 v17. Correlate linear acceleration of the wrist joint and horizontal velocity of the elbow joint with the throw length
(M ± SD) Result= 44.72 ± 3.46 m
rlinear acc. wrist = -0.7
rhorizontal v. elbow = -0.5
Significant relationship between linear acceleration of the wrist joint and performance, as well as the horizontal velocity of the elbow
(Komi & Mero, 1985)
1 LOCAM camera (200 fps). The film was digitized with the Vanguard and Lafayette film analyzers. 14 rigid body segments and the javelin were stablished to study.
Female (M±SD): Result= 64.45 ± 5.71 m; Ðattitude= 38 ± 5 º, Ð0= 42 ± 6 º, Ðattack= -4 ± 6 º, Vhorizontal= 16.2 ± 1.79 m/s-1, Vvertical= 19.55 ± 1.63 m/s-1, Vresultant= 21.86 ± 1.09 m/s-1 Male (M±SD): Result= 82.54 ± 4.07 m; Ðattitude= 41 ± 9 º, Ð0= 38 ± 4 º, Ðattack= 2 ± 12 º, Vhorizontal= 21.3 ± 1.6 m/s-1, Vvertical= 17.1 ± 1.76 m/s-1, Vresultant= 27.36 ± 1.68 m/s-1,
rrelease velocity-throw distance= 0.97
p<0.001.
Small biomechanical differences between good and poorer performers were identified. The results can be used to recognize some new criteria for successful performance in javelin throw.
(Kunz & Kaufmann, 1983)
1 highspeed LOCAM Camera (16 mm, 102 fps). Cyclograms analysed on a Vanguard Film Analyser which transferred the coordinates measurements to Hewlett Packard Digitiser. 74 variables were correlated with the throwing distance
(M±SD): Result= 53.47 ± 6.47 m; rV0= 0.757, rÐcarry –T5=
-0.516, rÐcarry – T6= -0.67, rÐattack=
-0.604
During running acceleration there’s a great build-up of torques at the ankle, knee, hip and intervertebral joints which culminate during the final leg thrust and throw. Therefore, these joints are susceptible to possible injury. Authors suggest a training program adapted to control these joints.
(Lehmann, 2010) 1 DV camera and 1 analagous camera were synchronised (50 Hz).
Female: Result= 61.08 m, V0=
24.6 m/s, r=0.53; Ð0= 34.6 º,
The correlation between throwing distance and release velocity is highly
All the valid throws were analysed. The distances were calculated just for the 9 finalists in their best attempts.
r=0.09; Ðattitude= 41 º, Ðsideslip=
10.8 º, Dist.impulse stride= 1.89 m,
Dist.delivery stride= 1.81 m
Male - Places 1-3: Result=86.11 m, V0= 29.3 m/s,
Ð0= 35.3 º, Ðattitude= 37.5 º,
Ðsideslip= 12.5º, Dist.impulse stride=
2.36 m, Dist.delivery stride= 1.84 m
Timpulse stride= 320 ms, Tdelivery stride= 193 ms, Trelease= 93 ms.
Places 4-11: Result= 80.46 m, V0= 28.9 m/s, Ð0= 32.8º,
Ðattitude= 36.9º, Ðsideslip= 14.1º,
Dist.impulse stride= 2.09 m,
Dist.delivery stride= 2.00 m Timpulse stride= 268 ms, Tdelivery stride= 195
ms, Trelease= 105 ms,
significant, but slightly lower than expected. There is no correlation between throwing distance and angle of release.
(Leigh et al., 2013)
2 HD Digital Video Cameras (59.94 fps) (placed behind and on the side of the runway). Manually digitized 24 body and javelin landmarks to obtain 2D coordinate data. DLT was used to produce 3D data.
Female: Results from 42.16-66.67 m; V0= 23 ± 1.4 m/s; Ð0=
33 ± 3º
Male: Result from 60.61-91.29 m; V0= 27.2 ± 1.1 m/s; Ð0= 34
± 3º
Greater shoulder and elbow forces and torques may be associated with injuries. For variables that imply greater forces and torques, athletes should do a proper injury prevention work.
(Liu et al., 2010)
2 HD video cameras (60 fps, 1/1000 shutter) filming the last cross-steps and the delivery stride. Data collected during 2007 and 2008 USA Track & Field Outdoor National Champ. The best trial of each athlete was used. 2D analysis with DLT for real time 3D coordinates.
Upper extremity’s sequence of female athletes: 1. Upper trunk forward rotation; 2. Right foot touchdown; 3. Left foot touchdown; 4. Shoulder abduction; 5. Shoulder horizontal adduction, elbow extension, shoulder internal rotation; 6. Wrist flexion, release of javelin.
Upper extremity’s sequence of male athletes: 1. Upper trunk forward rotation; 2. Right foot touchdown; 3. Left foot touchdown, shoulder horizontal adduction; 4. Shoulder abduction; 5. Elbow extension, shoulder internal rotation; 6. Wrist flexion, release of javelin.
Beginnings of upper extremity segments and joint angular motions of elite javelin throwers don’t follow a proximal-to-distal sequence, unlike maximum upper extremity joint center linear velocities as suggested in literature for javelin throwing. Male and female employed different sequences of lower and upper extremities.
(Liu et al., 2014)
2 HD video cameras (60 fps, 1/1000 shutter) filming the last cross step and the delivery stride. Calibration frame with 24 control points indicated by Peak Performance system (Englewood,
Duration of single support and delivery (M±SD):
Short distance groupfemale=
0.383 ± 0.033; Short distance groupmale= 0.367 ± 0.029; Long
Javelin throwers in short and long distance employed similar sequences of initiations of trunk and arm angular motions and maximum angular velocities. The opposite happens between male and female athletes, describing different parameters.
EUA). 21 critical body landmarks, front edge of the grip, the tail and tip of the javelin. MOTUS videographic data acquisition system for 2D. Linear transformation from 2D to 3D.
distance groupfemale= 0.378 ±
0.031; Long distance groupmale= 0.354 ± 0.044.
The sequence of initiations of trunk and arm angular motions and the sequence of maximum angular velocities in javelin throwing are different.
(Mero et al., 1994)
2 NAC Cameras placed back and sideward (100 fps). 18 segments and 20 points were defined (body and javelin). The DLT was used to calculate 3D coordinates of digitized body and javelin landmarks. Female M±SD): Result= 60.5 ± 4.04 m; H0= 1.75 ± 0.06, Ð0=34 ± 4º, Ðattitude=40 ± 5º, Ðattack=6 ± 7º, V0-horizontal=18.7 ± 2.4 m/s, V0-vertical= 12.8 ± 1.4 m/s, V 0-lateral=-3.1 ± 2.3 m/s, V 0-resultant=23 ± 1.9 m/s, Last step
length=1.5 ± 0.1 m, T1st contact to DS= 210 ± 37 ms, TDS to release= 141 ± 13 ms, Pulldistance= 1.57 ± 0.1 m Male (M±SD): Result= 80.47 ± 4.21 m; H0= 1.81 ± 0.04, Ð0=32 ± 3º, Ðattitude=31 ± 6º, Ðattack=-1 ± 6º, V0-horizontal=23.9 ± 0.9 m/s, V0-vertical= 14.9 ± 1.5 m/s, V 0-lateral=-0.8 ± 2 m/s, V 0-resultant=28.3 ± 0.9 m/s, Last step length=1.8 ± 0.1 m, T1st contact to DS= 221 ± 22 ms, TDS to release= 135 ± 12 ms, Pulldistance=
1.8 ± 0.11 m
Both men’s and women’s grip of javelin and body center of mass exhibited a curved pathway to the right from the left foot during the final foot contact. The position of the body center of mass decreased at the beginning of the final foot contact, but after decrease period it began to increase. Simultaneously with the increase, the peak joint center speed occurred in a proper sequence from proximal to distal segments and finally to the javelin at release. Release speed correlated significantly with the throwing distance in both genders.
(Morriss, Bartlett, & Fowler, 1997)
2 Photosonics 1PL high speed cine cameras (100 Hz or 200 Hz). All the coordinates were digitized by projecting the frame onto a TDS HR48 digitising tablet interfaced to an Acorn Archimedes 440 microcomputer running software. The three-dimensional world coordinates of the eighteen points, defining a 14 segments performer model, plus the tip, grip and tail of the javelin were reconstructed using DLT algorithm. (M±SD): Result= 81.89 ± 3.54 m, V0= 28.78 ± 0.8 m/s, Ð0= 38 ± 2.17 º, H0= 1.97 ± 0.13 m, Ðattack= -3.42 ± 3.53 º, Ðsideslip= 7± 4,47º
The medalists were able to achieve the higher release speeds. A very good understanding of an athlete’s javelin throwing technique is needed to design specific training exercises. Otherwise, the muscles that the athlete uses to apply force to the javelin may not receive the appropriate training stress and, consequently, not aid the thrower’s performance.
(Panoutsakopoulos & Kollias, 2013)
1 stationary JVC GR-D720E digital video camera (50 fps, shutter speed of 1/4000). A single camera set-up was used since 2D methods have been found adequate. 2D-DLT where x-axis was parallel to the runway and the y-axis perpendicular and vertical to the
x-(M±SD, r): Result: 59.22 ± 4.42 m; V0= 22 ± 0.8 m/s, r= 0.909; H0= 1.8 ± 0.08 m, r= 0.225; Ðattitude= 41 ± 5.2 º, r= -0.02, Ð0= 36 ± 3.9 º, r= -0.231, Ðattack= 5 ± 6.7 º, r=0.116; Tdelivery stride= 0.201 ± 0.031 s, r= -0.196; Trelease= 0.134 ± 0.018
Release velocity was found highly correlated with the throwing distance. Also, the support knee angle has a significant correlation with the performance outcome. These findings suggest that the distance of the throw is highly enhanced by the speed implemented on the javelin at the release.
*r – correlation; p – statistical significance; V – velocity; Sup. – superior; V0 – release velocity; H0 – release height; Ð0 – release
angle; Dist. – distance; T – time; DS – double support; DLT – direct linear transformation, 3D – three dimensional, 2D – two-dimensional, fps – frame per second.
axis. 26 throws analyzed and 22 anatomical body points digitized.
s, r= -0.286; Tdelivery phase= 0.335 ± 0.033 s, r= -0.284; Dist.delivery stride= 1.40 ± 0.14 m (Panoutsakopoulos, Vujkov, Kotzamanidou, & Vujkov, 2016)
2 JVC Digital Video Cameras (100 fps) (behind and on the side of the runway). Data collected during competition with 12 reference markers to produce 2D coordinates with 2D-DLT analysis. Spatial parameters: delivery stride length, distance to foul line, right knee angle, etc. Release parameters: V0,
H0, Ð0, Ðattack
(M±SD): Result: 46.43 ± 4.89 m; V0 = 16 ± 1.4 m/s; H0 = 2.08
± 0.1 m; Ð0 = 36.4 ± 5.3 º;
Ðattack = 2.1 ± 6.6 º
Confirms the importance of V0 on the
javelin’s performance. It is suggested that young javelin throwers training should focus on performing the release of javelin with a better leg braking action and a definitive proximal-to-distal segmental sequence of the throwing side
(Saratlija et al., 2013)
3 VHS (50 fps) cameras placed behind and both sides of the javelin runway. Correlate 17 variables with throw length
(M±SD): Result= 67.27 ± 3.94 rrelease speed = 0.9
rfast front sup. leg = 0.4
Javelin release speed has the most important role, followed by fast front support leg. The results can be used in kinesiology practice, especially in the process of young throwers technique learning
(Viitasalo et al., 2003)
Photocell gate to measure release parameters almost in real time. The gate consists of 2 infrared invisible walls two meters apart, perpendicular to the throwing direction. The correlation between some parameters and the result was calculated. (M ± SD, r) Male: Result= 79 ± 2.91 m; V0= 27.1 ± 0.7 m/s, r= 0.750; Ð0= 32.7 ± 2.6 º, r= -0.750; Ðattack= 2.3 ± 4.8 º, r= -0.145. Female: Result= 59.04 ± 2.6 m; V0= 23 ± 0.7 m/s, r= 0.780; Ð0= 31.7 ± 2.5 º, r= -0.216; Ðattack= 6.6 ± 6.9 º, r= -0.033.
Release speed was found to have the highest correlation with the result.
(Whiting, Gregor, & Halushka, 1991)
1 high speed camera PHOTOSONICS (100 fps, 16 mm). Serial film frames were digitized with NUMONICS 1200 (IBM PC-XT) to provide location of the javelin’s tip, grip and tail and the athlete’s elbow, shoulder, hip, knee and ankle. Result= 75.84 ± 3.32 m, Ð0= 36 ± 4 º, Ðattack= 1 ± 5 º, Ðattitude= 37 ± 5 º, V0= 29.6 ± 1.8 m/s, Velbow= 7.9 ± 1.1 m/s, Vshoulder= 4.8 ± 0.8 m/s, Vhip=
2.9 ± 0.6 m/s, Dist.last step= 1.73
± 0.14 m, T1st contact to DS= 224 ±
17 ms, TDS to release= 115 ± 12
ms
Careful individual assessment is required, specially at elite level. The complexity of the event and particular sensitivity of the final result demands it.
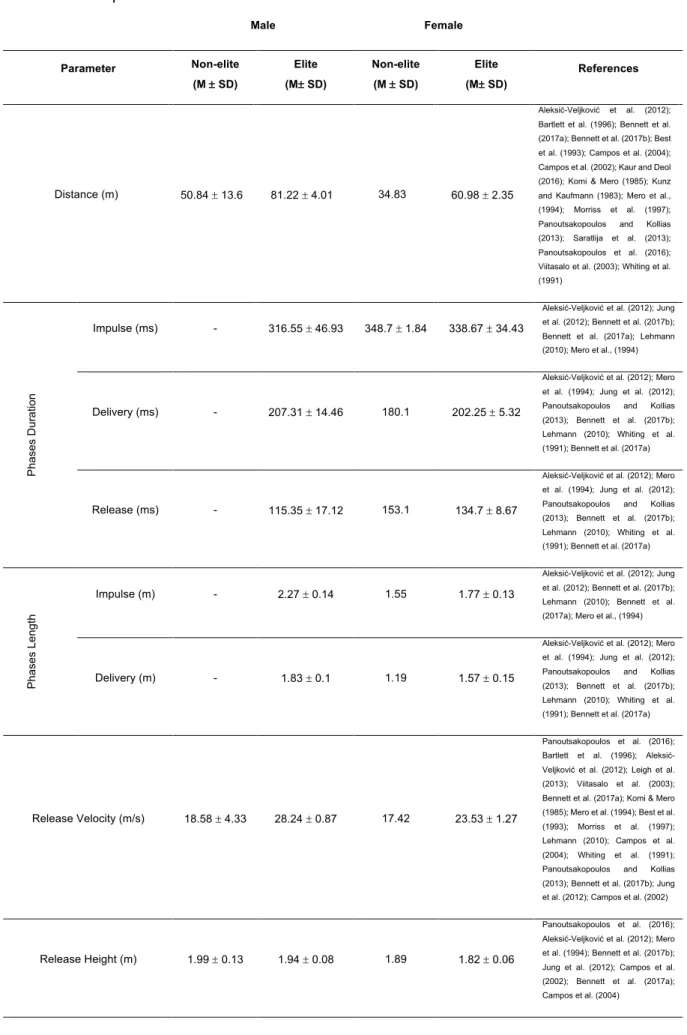
Table 3 – Main parameters results overview Male Female Parameter Non-elite (M ± SD) Elite (M± SD) Non-elite (M ± SD) Elite (M± SD) References Distance (m) 50.84 ± 13.6 81.22 ± 4.01 34.83 60.98 ± 2.35 Aleksić-Veljković et al. (2012); Bartlett et al. (1996); Bennett et al. (2017a); Bennett et al. (2017b); Best et al. (1993); Campos et al. (2004); Campos et al. (2002); Kaur and Deol (2016); Komi & Mero (1985); Kunz and Kaufmann (1983); Mero et al., (1994); Morriss et al. (1997); Panoutsakopoulos and Kollias (2013); Saratlija et al. (2013); Panoutsakopoulos et al. (2016); Viitasalo et al. (2003); Whiting et al. (1991) Ph a se s Du ra tio n Impulse (ms) - 316.55 ± 46.93 348.7 ± 1.84 338.67 ± 34.43
Aleksić-Veljković et al. (2012); Jung et al. (2012); Bennett et al. (2017b); Bennett et al. (2017a); Lehmann (2010); Mero et al., (1994)
Delivery (ms) - 207.31 ± 14.46 180.1 202.25 ± 5.32
Aleksić-Veljković et al. (2012); Mero et al. (1994); Jung et al. (2012); Panoutsakopoulos and Kollias (2013); Bennett et al. (2017b); Lehmann (2010); Whiting et al. (1991); Bennett et al. (2017a)
Release (ms) - 115.35 ± 17.12 153.1 134.7 ± 8.67
Aleksić-Veljković et al. (2012); Mero et al. (1994); Jung et al. (2012); Panoutsakopoulos and Kollias (2013); Bennett et al. (2017b); Lehmann (2010); Whiting et al. (1991); Bennett et al. (2017a)
Ph a se s L e n g th Impulse (m) - 2.27 ± 0.14 1.55 1.77 ± 0.13
Aleksić-Veljković et al. (2012); Jung et al. (2012); Bennett et al. (2017b); Lehmann (2010); Bennett et al. (2017a); Mero et al., (1994)
Delivery (m) - 1.83 ± 0.1 1.19 1.57 ± 0.15
Aleksić-Veljković et al. (2012); Mero et al. (1994); Jung et al. (2012); Panoutsakopoulos and Kollias (2013); Bennett et al. (2017b); Lehmann (2010); Whiting et al. (1991); Bennett et al. (2017a)
Release Velocity (m/s) 18.58 ± 4.33 28.24 ± 0.87 17.42 23.53 ± 1.27
Panoutsakopoulos et al. (2016); Bartlett et al. (1996); Aleksić-Veljković et al. (2012); Leigh et al. (2013); Viitasalo et al. (2003); Bennett et al. (2017a); Komi & Mero (1985); Mero et al. (1994); Best et al. (1993); Morriss et al. (1997); Lehmann (2010); Campos et al. (2004); Whiting et al. (1991); Panoutsakopoulos and Kollias (2013); Bennett et al. (2017b); Jung et al. (2012); Campos et al. (2002)
Release Height (m) 1.99 ± 0.13 1.94 ± 0.08 1.89 1.82 ± 0.06
Panoutsakopoulos et al. (2016); Aleksić-Veljković et al. (2012); Mero et al. (1994); Bennett et al. (2017b); Jung et al. (2012); Campos et al. (2002); Bennett et al. (2017a); Campos et al. (2004)
An
g
le
Release (º) 36.4 34.38 ± 2.22 44.20 35.52 ± 3.28
Panoutsakopoulos et al. (2016); Aleksić-Veljković et al. (2012); Mero et al. (1994); Campos et al. (2004); Leigh et al. (2013); Bennett et al. (2017a); Bennett et al. (2017b); Jung et al. (2012); Komi & Mero (1985); Lehmann (2010); Panoutsakopoulos and Kollias (2013); Viitasalo et al. (2003)
Attitude (º) - 36.98 ± 3.84 43.7 39.93 ± 1.36
Aleksić-Veljković et al. (2012); Komi & Mero (1985); Jung et al. (2012); Mero et al. (1994); Bennett et al. (2017b); Panoutsakopoulos and Kollias (2013); Campos et al. (2004); Whiting et al. (1991); Bennett et al. (2017a)
Attack (º) 2.1 2.06 ± 2.05 0.9 3.89 ± 4
Panoutsakopoulos et al. (2016); Aleksić-Veljković et al. (2012); Komi & Mero (1985); Jung et al. (2012); Mero et al. (1994); Bennett et al. (2017b); Panoutsakopoulos and Kollias (2013); Campos et al. (2004); Whiting et al. (1991); Bennett et al. (2017a); Viitasalo et al. (2003)
Sideslip (º) -5.99 ± 5.17 8.87 ± 7.38 - 9.85 ± 1.35
Bartlett et al. (1996); Bennett et al. (2017a); Bennett et al. (2017b); Lehmann (2010); Morriss et al. (1997)
1.3.2. Methodological Quality Score
Quality assessment scores of the 26 papers included ranged from 9 to 13, reaching an average score of 11.42 out of 17. This value indicates a high methodological quality of the articles included on the present review (Table 1).
1.4. Discussion
On the past few decades, sports sciences have been focusing on optimizing the javelin throw’s technique as well as its training methods (Hassan, 2015). The evaluation of elements which define a technical pattern of each athlete is a crucial step in sports training (Campos et al., 1994). Interests in the complex javelin’s technique has led the modern analysts to develop methods in order to provide coaches and athletes a more flexible way to view the throw (Best et al., 1993). In the past few years, the research on javelin throwing biomechanics has basically focused on the throwers’ technique and on the aerodynamics of the
instrument. The experimental designs on javelin throw kinematics are predominantly established throughout video recordings and 2D or 3D motion analysis (Viitasalo et al., 2003). The present review summarizes the literature that’s surrounding the javelin throw analysis. Thus, the biomechanical description of kinematic parameters its explored in several studies by analysing elite male athletes (Bennett et al., 2017a; Campos et al., 2004, 1994; Morriss et al., 1997; Saratlija et al., 2013; Whiting et al., 1991), non-elite male athletes (Hassan, 2015; Hussain & Bari, 2012; Kaur & Deol, 2016; Panoutsakopoulos et al., 2016), elite/non-elite women athletes (Aleksić-Veljković et al., 2012; Bennett et al., 2017b; Jung et al., 2012; Panoutsakopoulos & Kollias, 2013), both genders (Best et al., 1993; Komi & Mero, 1985; Leigh et al., 2013; Liu et al., 2010, 2014; Mero et al., 1994; Viitasalo et al., 2003) or comparing different skill levels (Aleksić-Veljković et al., 2012; Bartlett et al., 1996; Campos et al., 2002; Kunz & Kaufmann, 1983). Also, different methods are register by using distinct ways to record and process the data. While some studies choose for 2D analysis (Aleksić-Veljković et al., 2012; Panoutsakopoulos & Kollias, 2013; Panoutsakopoulos et al., 2016) since they found this method to be adequate for evaluating basic javelin parameters, another studies choose the 3D analysis (Bennett et al., 2017b, 2017a; Best et al., 1993; Campos et al., 2004, 2002, 1994; Leigh et al., 2013; Liu et al., 2010, 2014; Mero et al., 1994; Morriss et al., 1997) to improve technique feedback by getting a far more detailed evaluation of technique (Best et al., 1993). Hence, the three-dimensional method have an important role analyzing parameters, such as sideslip, which cannot be analyzed in 2D (Bartlett et al., 1996). There is no record of studies where wearable sensors are used to study javelin’s throw performance. The biomechanics has mostly been investigated the final throw phases, especially the implement release parameters (Viitasalo et al., 2003). According to Bartonietz (2000), the distance thrown is, to a large degree, determined by the release velocity, the height of release and the angle of release, which means the direction of the velocity of release. Accordingly, the reviewed articles report that the most commonly analyzed kinematic parameters are release velocity, release height, sideslip, attitude, attack and release angles, duration and distance of the steps/phases (see Table 3).
1.4.1. Impulse, delivery and release phase
The javelin approach run, including the impulse stride, has the role to create optimal conditions for delivery (Bartonietz, 2000). By definition, to a right-handed athlete, the impulse stride is considered the moment from the penultimate left foot to the final right foot contact (Bennett et al., 2017a). Moreover, literature frequently analyzes the duration and the length of the impulse stride, which implies an important role in those parameters. Regardless the individual technical characteristics, all coaches and athletes should aim to develop a method intending to improve efficiency by reducing the velocity loss after planting the rear foot (Bartonietz, 2000). According to literature, longer throws are achieved with higher speed and longer impulse strides. Another important instant, which is also part of the approach-run and contributes in a large scale to the release speed, is the delivery stride, also known as bracing stride (Bartlett & Best, 1988; Bartonietz, 2000). At this moment, the javelin is accelerated to maximum speed and then the release of the implement happens (Liu et al., 2010). According to Bartonietz (2000), the delivery phase is described as the movement following the moment of planting the rear leg, after the impulse stride, until the implement’s release. However, is often seen in literature the separation of this phase in two distinct sub phases - the delivery and the release phase. Thus, the delivery phase is the moment from the final right foot contact to the final left foot contact and the release lays from the time of the final left foot contact until the javelin’s release (Bennett et al., 2017a). A desirable flat planting of the last left foot contact demands a long delivery stride. Consequently, less-qualified throwers, in comparison with more qualified athletes, tend to have shorter delivery strides with steeper ground reaction forces (Menzel, 1986). A longer delivery stride contributes to a better use of inertial forces and enhances performance (Aleksić-Veljković et al., 2012). An additional concept is mentioned by Jung et al. (2012) called power stride. The power stride is attained when the delivery stride holds a wide base and efficiently sends power from the ground to the javelin (Jung et al., 2012). According to the literature available on this review, a study performed by Hussain and Bari (2012) indicates that the approach run velocity as a correlation of 0.722 (p<0.001) with the thrown distance. Therefore, it becomes important to