arXiv:1407.7494v1 [hep-ex] 28 Jul 2014
EUROPEAN ORGANISATION FOR NUCLEAR RESEARCH (CERN)
CERN-PH-EP-2014-139
Submitted to: JHEPSearch for new particles in events with one lepton and missing
transverse momentum in
pp
collisions at
√
s
= 8
TeV
with the
ATLAS detector
The ATLAS Collaboration
Abstract
This paper presents a search for new particles in events with one lepton (electron or muon) and missing transverse momentum using 20.3 fb−1of proton–proton collision data at√s = 8 TeVrecorded
by the ATLAS experiment at the Large Hadron Collider. No significant excess beyond Standard Model expectations is observed. A W′ with Sequential Standard Model couplings is excluded at the 95%
confidence level for masses up to 3.24 TeV. Excited chiral bosons (W∗) with equivalent coupling
strengths are excluded for masses up to 3.21TeV. In the framework of an effective field theory limits are also set on the dark matter–nucleon scattering cross-section as well as the mass scale M∗ of the unknown mediating interaction for dark matter pair production in association with a leptonically decayingW.
c
Prepared for submission to JHEP
Search for new particles in events with one lepton and
missing transverse momentum in pp collisions at
√
s
= 8 TeV with the ATLAS detector
The ATLAS Collaboration
Abstract: This paper presents a search for new particles in events with one lepton
(electron or muon) and missing transverse momentum using 20.3 fb−1 of proton–proton
collision data at √s = 8 TeV recorded by the ATLAS experiment at the Large Hadron
Collider. No significant excess beyond Standard Model expectations is observed. A W′
with Sequential Standard Model couplings is excluded at the 95% confidence level for
masses up to 3.24 TeV. Excited chiral bosons (W∗) with equivalent coupling strengths are
excluded for masses up to 3.21 TeV. In the framework of an effective field theory limits are
also set on the dark matter–nucleon scattering cross-section as well as the mass scale M∗
of the unknown mediating interaction for dark matter pair production in association with a leptonically decaying W .
Contents
1 Introduction 1
2 The ATLAS detector 3
3 Trigger and reconstruction 3
4 Monte Carlo simulation 4
5 Event selection 7
6 Statistical analysis and systematic uncertainties 10
7 Results 12
8 Conclusions 22
1 Introduction
High-energy collisions at CERN’s Large Hadron Collider (LHC) provide new opportunities to search for physics beyond the Standard Model (SM). This paper describes such a search in events containing a lepton (electron or muon) and missing transverse momentum using 8 TeV pp collision data collected with the ATLAS detector during 2012, corresponding to a total integrated luminosity of 20.3 fb−1.
The first new-physics scenario that is considered in this paper is the Sequential
Stan-dard Model (SSM), the extended gauge model of ref. [1]. This model proposes the existence
of additional heavy gauge bosons, of which the charged ones are commonly denoted W′.
The W′ has the same couplings to fermions as the SM W boson and a width that increases
linearly with the W′ mass. The coupling of the W′to W Z is set to zero. Similar searches [2–
7] have been performed using √s = 1.96 TeV p¯p collision data by the CDF Collaboration,
√
s = 7 TeV pp collision data by the ATLAS Collaboration as well as √s = 7 TeV and
√
s = 8 TeV data by the CMS Collaboration.
The second new-physics scenario that is considered originates from ref. [8] and proposes
the existence of charged partners, denoted W∗, of the chiral boson excitations described
in ref. [9]. The anomalous (magnetic-moment type) coupling of the W∗ leads to kinematic
distributions significantly different from those of the W′ as demonstrated in the previous
ATLAS search [7] that was performed using 7 TeV pp collision data collected in 2011
corresponding to an integrated luminosity of 4.7 fb−1. In the analysis presented in this
paper the search region is expanded to higher masses and the sensitivity is considerably improved in the region covered by the previous search.
The third new-physics scenario considered is of direct production of weakly interacting candidate dark matter (DM) particles. These particles can be pair-produced at the LHC,
pp → χ ¯χ, via a new intermediate state. Since DM particles do not interact with the
detector material, these events can be detected if there is associated initial-state radiation
of a SM particle [10–13]. The Tevatron and LHC collaborations have reported limits on
the cross-section of p¯p/pp → χ ¯χ + X where X is a hadronic jet [14–16], a photon [17,
18], a hadronically decaying W or Z boson [19] or a leptonically decaying Z boson [20].
Previous LHC results have also been reinterpreted to set limits on the scenario where X is a leptonically decaying W boson [21]. This analysis is the first direct ATLAS search for this case. Limits are reported for the DM–nucleon scattering cross-section as well as the mass
scale, M∗, of a new SM–DM interaction expressed in an effective field theory (EFT) as a
four-point contact interaction [22–27]. As discussed in the literature, e.g. refs. [28,29], the EFT formalism is not always an appropriate approximation but this issue is not addressed any further in this paper. Four effective operators are used as a representative set based
on the definitions in ref. [13]: D1 scalar, D5 vector (both constructive and destructive
interference cases are considered, the former denoted by D5c and the latter by D5d) and D9 tensor.
The analysis presented here identifies event candidates in the electron and muon chan-nels, sets separate limits and then combines these assuming a common branching fraction for the two final states. The kinematic variable used to identify the signal is the transverse mass
mT=
q
2pTETmiss(1 − cos ϕℓν), (1.1)
where pT is the lepton transverse momentum, ETmiss is the magnitude of the missing
trans-verse momentum vector and ϕℓν is the angle between the pT and ETmiss vectors.1
The main background to the W′, W∗and DM signals comes from the tail of the m
T
dis-tribution from SM W boson production with decays to the same final state. Other relevant backgrounds are Z boson production with decays into two leptons where one lepton is not reconstructed, W or Z production with decays to τ leptons where a τ subsequently decays to either an electron or a muon, and diboson production. These are collectively referred to as the electroweak (EW) background. There is also a contribution to the background from
t¯t and single-top production, collectively referred to as the top background, which is most
important for the lowest W′/W∗ masses considered here, where it constitutes about 10% of
the background after event selection in the electron channel and 15% in the muon channel. Other relevant strong-interaction background sources occur when a light or heavy hadron decays semileptonically or when a jet is misidentified as an electron or muon. These are referred to as the multi-jet background in this paper.
1ATLAS uses a right-handed coordinate system with its origin at the nominal interaction point in the centre of the detector and the z-axis along the beam pipe. Cylindrical coordinates (r, ϕ) are used in the transverse plane, ϕ being the azimuthal angle around the beam pipe. The pseudorapidity η is defined in terms of the polar angle θ by η = − ln tan(θ/2).
2 The ATLAS detector
The ATLAS detector [30] is a multi-purpose particle physics detector with a
forward-backward symmetric cylindrical geometry and nearly 4π coverage in solid angle. The AT-LAS detector has three major components: the inner tracking detector (ID), the calorimeter and the muon spectrometer (MS). Tracks and vertices of charged particles are reconstructed with silicon pixel and silicon microstrip detectors covering |η| < 2.5 and straw-tube transi-tion radiatransi-tion detectors covering |η| < 2.0, all immersed in a homogeneous 2 T magnetic field provided by a superconducting solenoid. The ID is surrounded by a hermetic calorime-ter that covers |η| < 4.9 and provides three-dimensional reconstruction of particle showers. The electromagnetic calorimeter is a liquid argon (LAr) sampling calorimeter, which uses lead absorbers for |η| < 3.2 and copper absorbers in the very forward region. The hadronic sampling calorimeter uses plastic scintillator tiles as the active material and iron absorbers in the region |η| < 1.7. In the region 1.5 < |η| < 4.9, liquid argon is used as the active material, with copper and/or tungsten absorbers. The MS surrounds the calorimeters and consists of three large superconducting toroid systems (each with eight coils) together with multiple layers of trigger chambers up to |η| < 2.4 and tracking chambers, providing precision track measurements, up to |η| < 2.7.
3 Trigger and reconstruction
The data used in the electron channel were recorded with a trigger requiring the presence
of an energy cluster in the EM compartment of the calorimeter (EM cluster) with ET >
120 GeV. For the muon channel, matching tracks in the MS and ID with combined pT >
36 GeV are used to select events. In order to compensate for the small loss in the selection
efficiency at high pT due to this matching, events are also recorded if a muon with pT >
40 GeV and |η| < 1.05 is found in the MS. The average trigger efficiency (measured with respect to reconstructed objects) is above 99% in the electron channel and 80%–90% in the muon channel for the region of interest in this analysis.
Each EM cluster with ET> 125 GeV and |η| < 1.37 or 1.52 < |η| < 2.47 is considered as an electron candidate if it is matched to an ID track. The region 1.37 ≤ |η| ≤ 1.52 exhibits degraded energy resolution due to the transition from the central region to the forward regions of the calorimeters and is therefore excluded. The track and the cluster must satisfy a set of identification criteria that are optimised for the conditions of many proton–proton collisions in the same or nearby beam bunch crossings (in-time or out-of-time pile-up, respectively) [31]. These criteria require the shower profiles to be consistent with those expected for electrons and impose a minimum requirement on the amount of transition radiation that is present. In addition, to suppress background from photon conversions, a hit in the first layer of the pixel detector is required if an active pixel sensor is traversed. The electron’s energy is obtained from the calorimeter measurements while
its direction is obtained from the associated track. In the high-ET range relevant for this
in the central region and 1.8% in the forward region [32]. These requirements result in about a 90% identification efficiency for electrons with ET> 125 GeV.
Muons are required to have a pT > 45 GeV, where the momentum of the muon is
obtained by combining the ID and MS measurements. To ensure an accurate measurement of the momentum, muons are required to have hits in three MS layers and are restricted to the ranges |η| < 1.0 and 1.3 < |η| < 2.0. Some of the chambers in the region 1.0 < |η| < 1.3 were not yet installed, hence the momentum resolution of MS tracks is degraded in this region. Including the muon candidates with an η-range 2.0 < |η| < 2.5 would lead to an
increase in the signal selection efficiency of up to 12% for lower W′ masses and of up to
3% for a W′ mass of 3 TeV. However, the background levels in the signal region would
increase by more than 15%. Therefore, the previously stated η restrictions are retained. For the final selection of good muon candidates, the individual ID and MS momentum measurements are required to be in agreement within 5 standard deviations. The average
momentum resolution is about 15%–20% at pT = 1 TeV. About 80% of the muons in the
η-range considered are reconstructed, with most of the loss coming from regions without three MS layers.
The Emiss
T in each event is evaluated by summing over energy-calibrated physics objects
(jets, photons and leptons) and adding corrections for calorimeter deposits not associated with these objects [33].
This analysis makes use of all of the√s = 8 TeV data collected in 2012 for which the
relevant detector systems were operating properly and all data quality requirements were satisfied. The integrated luminosity of the data used in this study is 20.3 fb−1 for both the electron and muon decay channels. The uncertainty on this measurement is 2.8%, which is derived following the methodology detailed in ref. [34].
4 Monte Carlo simulation
With the exception of the multi-jet background, which is estimated from data, expected signals and backgrounds are evaluated using simulated Monte Carlo samples and normalised using the calculated cross-sections and the integrated luminosity of the data.
The W′ signal events are generated at leading order (LO) with Pythia v8.165 [35,36]
using the MSTW2008 LO [37] parton distribution functions (PDFs). Pythia is also used
for the fragmentation and hadronisation of W∗ → ℓν events that are generated at LO with
CalcHEPv3.3.6 [38] using the CTEQ6L1 PDFs [39]. DM signal samples are generated at
LO with Madgraph5 v1.4.5 [40] using the MSTW2008 LO PDFs, interfaced to Pythia
v8.165.
The W/Z boson and t¯t backgrounds are generated at next-to-leading order (NLO)
with Powheg-Box r1556 [41] using the CT10 NLO [42] PDFs. For the W/Z backgrounds,
fragmentation and hadronisation is performed with Pythia v8.165, while for t¯t Pythia
v6.426 is used. The single-top background is generated at NLO with MC@NLO v4.06 [43]
using the CT10 NLO PDFs for the W t- and s-channels, and with AcerMC v3.8 [44] using
the CTEQ6L1 PDFs for the t-channel. Fragmentation and hadronisation for the MC@NLO
event, whereas Pythia v6.426 is used for the AcerMC samples. The W W , W Z and ZZ
diboson backgrounds are generated at LO with Sherpa v1.4.1 [47] using the CT10 NLO
PDFs.
The Pythia signal model for W′ has V −A SM couplings to fermions but does not
include interference between the W and W′. For both W′ and W∗, decay channels beside
eν and µν, notably τ ν, ud, sc and tb, are included in the calculation of the widths but are
not explicitly included as signal or background. At high mass (mW′ > 1 TeV), the total
width is about 3.5 % of the pole mass, and the branching fraction to each of the lepton decay channels is 8.2%.
For all samples, final-state photon radiation from leptons is handled by Photos [48].
The ATLAS full detector simulation [49] based on Geant4 [50] is used to propagate the
particles and account for the response of the detector. For the underlying event, the
AT-LAS tune AUET2B [51] is used for Pythia 6 and AU2 [52] is used for Pythia 8, while
AUET2 [53] is used for the Herwig with Jimmy. The effect of pile-up is incorporated into
the simulation by overlaying additional minimum-bias events generated with Pythia onto the generated hard-scatter events. Simulated events are weighted to match the distribu-tion of the number of interacdistribu-tions per bunch crossing observed in data, but are otherwise reconstructed in the same manner as data.
The W → ℓν and Z → ℓℓ cross-sections are calculated at next-to-next-to-leading order
(NNLO) in QCD with ZWPROD [54] using MSTW2008 NNLO PDFs. Consistent results
are obtained using VRAP v0.9 [55] and FEWZ v3.1b2 [56,57]. Higher-order electroweak
corrections are calculated with MCSANC [58]. Mass-dependent K-factors obtained from
the ratios of the calculated higher-order cross-sections to the cross-sections of the generated
samples are used to scale W+, W− and Z backgrounds separately. The W′ → ℓν
cross-sections are calculated in the same way, except that the electroweak corrections beyond final-state radiation are not included because the calculation for the SM W cannot be
ap-plied directly. Cross sections for W∗ → ℓν are kept at LO due to the non-renormalisability
of the model at higher orders in QCD. The t¯t cross-section is also calculated at NNLO
including resummation of next-to-next-to-leading logarithmic (NNLL) soft gluon terms
ob-tained with Top++ v2.0 [59–64] for a top quark mass of 172.5 GeV. The W′, W∗, and DM
particle signal cross-sections are listed in tables1 and2. The most important background
cross-sections are listed in table3.
Uncertainties on the W′ cross-section and the W/Z background cross-sections are
esti-mated from variations of the renormalisation and factorisation scales, PDF+αs variations
and PDF choice. The scale uncertainties are estimated by varying both the renormalisation and factorisation scales simultaneously up or down by a factor of two. The resulting maxi-mum variation from the two fluctuations is taken as the symmetric scale uncertainty. The
PDF+αs uncertainty is evaluated using 90% confidence level (CL) eigenvector and 90%
CL αs variations of the nominal MSTW2008 NNLO PDF set and combined with the scale
uncertainty in quadrature. The PDF choice uncertainty is evaluated by comparing the
central values of the MSTW2008 NNLO, CT10 NNLO, NNPDF 2.3 NNLO [65], ABM11
5N NNLO [66] and HERAPDF 1.5 NNLO [67] PDF sets. The envelope of the PDF central
Table 1. Predicted values of the cross-section times branching fraction (σB) for W′ → ℓν and
W∗→ ℓν. The σB for W′ → ℓν are at NNLO while those for W∗→ ℓν are at LO. The values are
given per channel, with ℓ = e or µ.
Mass W′ → ℓν W∗→ ℓν [GeV] σB [pb] σB [pb] 300 149.0 400 50.2 37.6 500 21.4 16.2 600 10.4 7.95 750 4.16 3.17 1000 1.16 0.882 1250 0.389 0.294 1500 0.146 0.108 1750 0.0581 0.0423 2000 0.0244 0.0171 2250 0.0108 0.00700 2500 0.00509 0.00290 2750 0.00258 0.00120 3000 0.00144 4.9×10⁻⁴ 3250 8.9×10⁻⁴ 2.0×10⁻⁴ 3500 5.9×10⁻⁴ 8.0×10⁻⁵ 3750 4.2×10⁻⁴ 3.2×10⁻⁵ 4000 3.1×10⁻⁴ 1.3×10⁻⁵
Table 2. Predicted values of σB for DM signal with different mass values, mχ. The values of M∗
used in the calculation for a given operator are also shown. The cross-sections are at LO, and the values are given for the sum of three lepton flavours ℓ = e, µ, τ .
DM production
mχ σB [pb]
[GeV] D1 D5d D5c D9
M∗ = 10 GeV M∗ = 100 GeV M∗ = 1 TeV M∗ = 1 TeV
1 439 72.2 0.0608 0.0966 100 332 70.8 0.0575 0.0870 200 201 58.8 0.0488 0.0695 400 64.6 32.9 0.0279 0.0365 1000 1.60 2.37 0.00192 0.00227 1300 0.213 0.454 0.000351 0.000412
Table 3. Predicted values of σB for the leading backgrounds. The value for t¯t → ℓX includes all final states with at least one lepton (e, µ or τ ). The others are exclusive and are used for both ℓ = e and ℓ = µ. All cross-sections are at NNLO.
Process σB [pb]
W → ℓν 12190
Z/γ∗ → ℓℓ (m
Z/γ∗ > 60 GeV) 1120
t¯t → ℓX 137.3
the total uncertainty on the differential cross-section as a function of the invariant mass of
the lepton–neutrino system (mℓν). The PDF and αs uncertainties on the t¯t cross-section
are calculated using the PDF4LHC prescription [68] with the MSTW2008 68% CL NNLO,
CT10 NNLO and NNPDF2.3 5f FFN PDF error sets added in quadrature to the scale uncertainty. The systematic uncertainty arising from the variation of the top mass by ±1 GeV is also added in quadrature.
An additional uncertainty on the differential cross-section due to the beam energy
uncertainty is calculated as function of mℓν for the charged-current Drell–Yan process with
VRAP at NNLO using CT10 NNLO PDFs by taking a 0.66% uncertainty on the energy of
each 4 TeV proton beam as determined in ref. [69]. The size of this uncertainty is observed
to be about 2% (6%) at mℓν = 2 (3) TeV. The calculated uncertainties are propagated
to both the W and W′/W∗ processes in order to derive uncertainties on the background
levels as well as the signal selection efficiencies in each signal region.
Uncertainties are not reported on the cross-sections for the W∗ due to the breakdown
of higher-order corrections for non-renormalisable models. However, uncertainties on the signal selection efficiency for the W∗are evaluated using the same relative differential
cross-section uncertainty as for the W′. Uncertainties on DM production are evaluated using
68% confidence level eigenvector variations of the nominal MSTW2008 LO PDF set as in [19].
5 Event selection
The primary vertex for each event is required to have at least three tracks with pT >
0.4 GeV and to have a longitudinal distance less than 200 mm from the centre of the collision region. There are on average 20.7 interactions per event in the data used for this
analysis. The primary vertex is defined to be the one with the highest summed track p2T.
Spurious tails in the Emiss
T distribution, arising from calorimeter noise and other detector
problems are suppressed by checking the quality of each reconstructed jet and discarding events containing reconstructed jets of poor quality, following the description given in
ref. [70]. In addition, the ID track associated with the electron or muon is required to
be compatible with originating from the primary vertex by requiring that the transverse distance of closest approach, d0, satisfies |d0| < 1 (0.2) mm and longitudinal distance, z0,
one electron candidate with ET> 125 GeV or one muon candidate with pT > 45 GeV
satisfying these requirements and the identification criteria described in section 3. In
the electron channel, events having additional electrons with ET > 20 GeV, passing all
electron identification criteria, are discarded. Similarly, in the muon channel, events having
additional muon candidates with a pT threshold of 20 GeV are discarded.
To suppress the multi-jet background, the lepton is required to be isolated. In the
elec-tron channel, the isolation energy is measured with the calorimeter in a cone ∆R =p(∆η)2+ (∆ϕ)2 = 0.2
around the electron track, and the requirement is ΣETcalo< 0.007 × ET+ 5 GeV, where the sum includes all calorimeter energy clusters in the cone excluding those that are attributed
to the electron. The scaling of the isolation requirement with the electron ET reduces the
efficiency loss due to radiation from the electron at high ET. In the muon channel, the
isolation energy is measured using ID tracks with ptrk
T > 1 GeV in a cone ∆R = 0.3 around
the muon track. The isolation requirement is Pptrk
T < 0.05 × pT, where the muon track is excluded from the sum. As in the electron channel, the scaling of the isolation requirement
with the muon pT reduces the efficiency loss due to radiation from the muon at high pT.
An ETmiss requirement is imposed to select signal events and to further suppress the
contributions from the multi-jet and SM W backgrounds. In both channels, the requirement placed on the charged lepton pT is also applied to the ETmiss: ETmiss > 125 GeV for the electron channel and ETmiss > 45 GeV for the muon channel.
The multi-jet background around the Jacobian peak of the mTdistribution is evaluated
using the matrix method as described in ref. [71] in both the electron and muon channels.
The high-mass tail of the distribution is then fitted by a power-law function in order to de-termine the level of the multi-jet background in the region used to search for new physics. In the electron channel, the multi-jet background constitutes about 2%–4% of the total
background at high mT. Consistent results are obtained using the inverted isolation
tech-nique described in ref. [5]. In the muon channel, the multi-jet background constitutes about
1%–3% of the total background at high mT. The uncertainty of the multi-jet background
is determined by varying the selection requirements used to define the control region and
by varying the mT threshold of the fitting range used in the extrapolation to high mT.
The same reconstruction criteria and event selection are applied to both the data
and simulated samples. Figure 1 shows the pT, ETmiss, and mT spectra for each channel
after event selection for the data, the expected background and three examples of W′
signals at different masses. Prior to investigating if there is evidence for a signal, the agreement between the data and the predicted background is established for events with
mT < 252 GeV, the lowest mT threshold used to search for new physics. The optimisation
of the mT thresholds for event selection is described below. The agreement between the
data and expected background is good. Table4 shows an example of how different sources
contribute to the background for mT> 1500 GeV, the region used to search for a W′ with
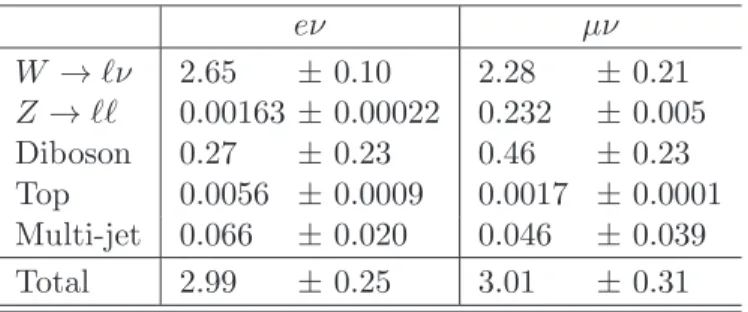
a mass of 2000 GeV. The W → ℓν background is the dominant contribution for both the electron and muon channels. The Z → ℓℓ background in the electron channel is smaller than in the muon channel due to calorimeters having larger η coverage than the MS, and the electron energy resolution being better than the muon momentum resolution at high pT.
[GeV] l T p 2 10 3 10 Events 1 10 2 10 3 10 4 10 5 10 6 10 Data 2012 W’(0.5 TeV) W’(1 TeV) W’(3 TeV) W Z Top quark Diboson Multijet ATLAS W’ → eν = 8 TeV s -1 L dt = 20.3 fb ∫ [GeV] l T p 2 10 103 Data/Bkg 0 0.5 1 1.52 [GeV] l T p 2 10 3 10 Events 1 10 2 10 3 10 4 10 5 10 6 10 7 10 8 10 Data 2012 W’(0.5 TeV) W’(1 TeV) W’(3 TeV) W Z Top quark Diboson Multijet ATLAS W’ →µν = 8 TeV s -1 L dt = 20.3 fb ∫ [GeV] l T p 2 10 103 Data/Bkg 0 0.5 1 1.52 [GeV] miss T E 2 10 3 10 Events 1 10 2 10 3 10 4 10 5 10 6 10 Data 2012 W’(0.5 TeV) W’(1 TeV) W’(3 TeV) W Z Top quark Diboson Multijet ATLAS W’ → eν = 8 TeV s -1 L dt = 20.3 fb ∫ [GeV] miss T E 2 10 103 Data/Bkg 0 0.5 1 1.52 [GeV] miss T E 2 10 3 10 Events 1 10 2 10 3 10 4 10 5 10 6 10 7 10 8 10 Data 2012 W’(0.5 TeV) W’(1 TeV) W’(3 TeV) W Z Top quark Diboson Multijet ATLAS W’ →µν = 8 TeV s -1 L dt = 20.3 fb ∫ [GeV] miss T E 2 10 103 Data/Bkg 0 0.5 1 1.52 [GeV] T m 3 10 Events -1 10 1 10 2 10 3 10 4 10 5 10 6 10 Data 2012 W’(0.5 TeV) W’(1 TeV) W’(3 TeV) W Z Top quark Diboson Multijet ATLAS W’ → eν = 8 TeV s -1 L dt = 20.3 fb ∫ [GeV] T m 3 10 Data/Bkg 0 0.5 1 1.52 [GeV] T m 2 10 3 10 Events -1 10 1 10 2 10 3 10 4 10 5 10 6 10 7 10 8 10 Data 2012 W’(0.5 TeV) W’(1 TeV) W’(3 TeV) W Z Top quark Diboson Multijet ATLAS W’ →µν = 8 TeV s -1 L dt = 20.3 fb ∫ [GeV] T m 2 10 103 Data/Bkg 0 0.5 1 1.52
Figure 1. Spectra of lepton pT(top), ETmiss(centre) and mT(bottom) for the electron (left) and
muon (right) channels after the event selection. The spectra of pTand ETmiss are shown with the
requirement mT > 252 GeV. The points represent data and the filled, stacked histograms show
the predicted backgrounds. Open histograms are W′ → ℓν signals added to the background with
their masses in GeV indicated in parentheses in the legend. The signal and background samples are normalised using the integrated luminosity of the data and the NNLO cross-sections listed in tables 1 and3, except for the multi-jet background which is estimated from data. The error bars on the data points are statistical. The ratio of the data to the total background prediction is shown below each of the distributions. The bands represent the systematic uncertainties on the background including the ones arising from the statistical uncertainty of the simulated samples.
Table 4. Expected numbers of events from the various background sources in each decay channel for mT> 1500 GeV, the region used to search for a W′with a mass of 2000 GeV. The W → ℓν and
Z → ℓℓ rows include the expected contributions from the τ-lepton. The uncertainties are statistical.
eν µν W → ℓν 2.65 ± 0.10 2.28 ± 0.21 Z → ℓℓ 0.00163 ± 0.00022 0.232 ± 0.005 Diboson 0.27 ± 0.23 0.46 ± 0.23 Top 0.0056 ± 0.0009 0.0017 ± 0.0001 Multi-jet 0.066 ± 0.020 0.046 ± 0.039 Total 2.99 ± 0.25 3.01 ± 0.31
6 Statistical analysis and systematic uncertainties
A Bayesian analysis is performed to set limits on the studied processes. For each candidate
mass and decay channel, events are counted above an mT threshold. The optimisation
of mTmin is done separately for W′ → ℓν and W∗ → ℓν. For each candidate mass, the
mTmin values that minimise the expected cross-section limits are obtained in the electron
and muon channels separately, but for simplicity the lower value is used in both channels since this has a negligible impact on the final results. A similar optimisation is performed
when setting the limits on DM production, and in this case a single mTmin is chosen for
each operator. The expected number of events in each channel is
Nexp = εsigLintσB + Nbkg, (6.1)
where Lint is the integrated luminosity of the data sample, εsig is the signal selection
efficiency defined as the fraction of signal events that satisfy the event selection criteria as
well as mT > mTmin, Nbkg is the expected number of background events, and σB is the
cross-section times branching fraction. Using Poisson statistics, the likelihood to observe Nobs events is
L(Nobs|σB) =
(LintεsigσB + Nbkg)Nobse−(LintεsigσB+Nbkg) Nobs!
. (6.2)
Uncertainties are included by introducing nuisance parameters θi, each with a probability
density function gi(θi), and integrating the product of the Poisson likelihood with the
probability density function. The integrated likelihood is LB(Nobs|σB) =
Z
L(Nobs|σB)
Y
gi(θi)dθi, (6.3)
where a log-normal distribution is used for the gi(θi). The nuisance parameters are taken
to be: Lint, εsig and Nbkg, with the appropriate correlation accounted for between the first and the third parameters.
branch-ing fraction for each. Equation (6.3) remains valid with the Poisson likelihood replaced by the product of the Poisson likelihoods for the two channels. The integrated luminosities for
the electron and muon channels are fully correlated. For W′/W∗ → ℓν the signal selection
efficiencies and background levels are partly correlated with each other and between the two channels due to the full correlation of the cross-section uncertainties. If these correla-tions were not included, the observed σB limits would improve by 25%–30% for the lowest mass points, a few percent for the intermediate mass points and by about 10% for the highest mass points.
Bayes’ theorem gives the posterior probability that the signal has signal strength σB:
Ppost(σB|Nobs) = N LB(Nobs|σB) Pprior(σB) (6.4)
where Pprior(σB) is the assumed prior probability, here chosen to be flat in σB, for σB > 0. The constant factor N normalises the total probability to one. The posterior probability is evaluated for each mass and decay channel as well as for their combination, and then used to set a limit on σB.
The inputs for the evaluation of LB (and hence Ppost) are Lint, εsig, Nbkg, Nobs and
the uncertainties on the first three. The uncertainties on εsig and Nbkg account for
experi-mental and theoretical systematic effects as well as the statistics of the simulated samples. The experimental systematic uncertainties include those on the efficiencies of the electron or muon trigger, reconstruction and event/object selection. Uncertainties in the lepton
energy/momentum and Emiss
T , characterised by scale and resolution uncertainties, are also
included. Performance metrics are obtained in-situ using well-known processes such as
Z → ℓℓ [31,72, 73]. Since most of these performance metrics are measured at relatively
low pT their values are extrapolated to the high-pT regime relevant to this analysis using
MC simulation. The uncertainties in these extrapolations are included but are too small to
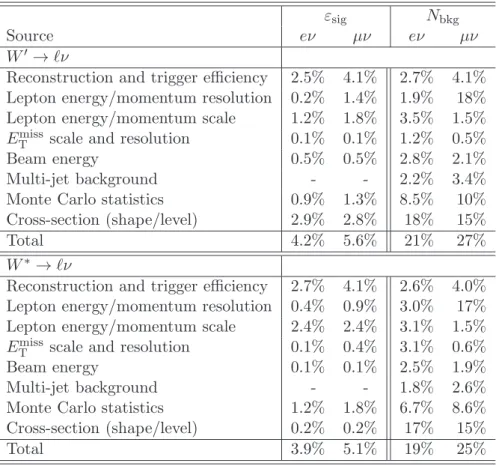
significantly affect the results. Table5summarises the uncertainties on the event selection
efficiencies and the expected number of background events for the W′→ ℓν signal with
mW′ = 2000 GeV using mT > 1500 GeV, and W∗ signal with mW∗ = 2000 GeV using
Table 5. Relative uncertainties on the selection efficiency εsigand expected number of background
events Nbkg for a W′ (upper part of the table) and W∗ (lower part of the table) with a mass of
2000 GeV. The efficiency uncertainties include contributions from the trigger, reconstruction and event selection. The last row gives the total relative uncertainties.
εsig Nbkg
Source eν µν eν µν
W′→ ℓν
Reconstruction and trigger efficiency 2.5% 4.1% 2.7% 4.1%
Lepton energy/momentum resolution 0.2% 1.4% 1.9% 18%
Lepton energy/momentum scale 1.2% 1.8% 3.5% 1.5%
ETmiss scale and resolution 0.1% 0.1% 1.2% 0.5%
Beam energy 0.5% 0.5% 2.8% 2.1%
Multi-jet background - - 2.2% 3.4%
Monte Carlo statistics 0.9% 1.3% 8.5% 10%
Cross-section (shape/level) 2.9% 2.8% 18% 15%
Total 4.2% 5.6% 21% 27%
W∗→ ℓν
Reconstruction and trigger efficiency 2.7% 4.1% 2.6% 4.0%
Lepton energy/momentum resolution 0.4% 0.9% 3.0% 17%
Lepton energy/momentum scale 2.4% 2.4% 3.1% 1.5%
ETmiss scale and resolution 0.1% 0.4% 3.1% 0.6%
Beam energy 0.1% 0.1% 2.5% 1.9%
Multi-jet background - - 1.8% 2.6%
Monte Carlo statistics 1.2% 1.8% 6.7% 8.6%
Cross-section (shape/level) 0.2% 0.2% 17% 15%
Total 3.9% 5.1% 19% 25%
7 Results
The inputs for the evaluation of LB are listed in tables 6, 7 and 8. The uncertainties
on εsig and Nbkg account for all relevant experimental and theoretical effects except for
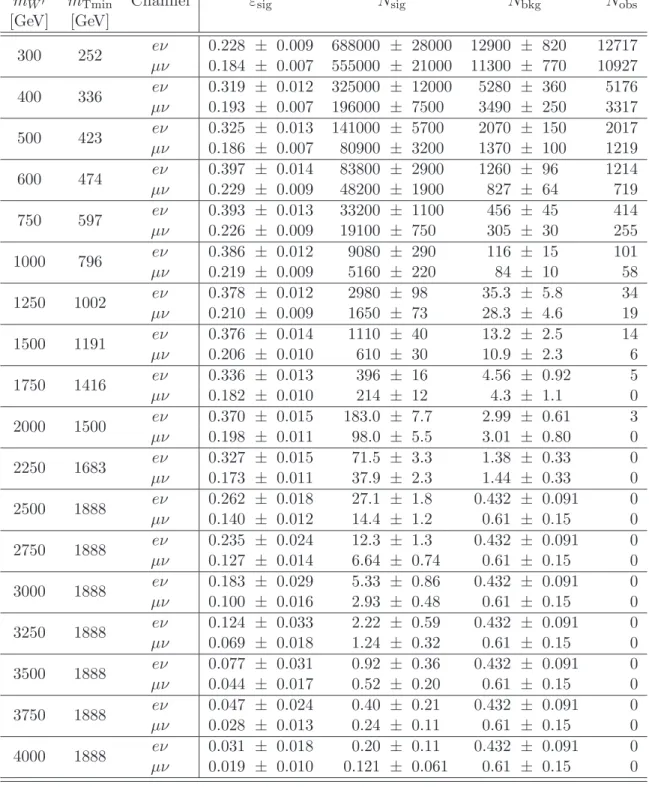
the uncertainty on the integrated luminosity. The latter is included separately and is correlated between signal and background. The tables also list the predicted numbers of signal events, Nsig, with their uncertainties accounting for the uncertainties in both εsig and the cross-section calculation. The maximum value for the signal selection efficiency is at
mW′ = 2000 GeV. For lower masses, the efficiency falls because the relative mT threshold,
mTmin/mW′, increases in order to reduce the background level. The contribution from
W′ → τν with a leptonically decaying τ is neglected. It would increase the signal yield
by 2%–3% for the highest masses. The background level is estimated for each mass by summing over all of the background sources.
Table 6. Inputs for the W′ → ℓν σB limit calculations. The first three columns are the W′
mass, mTthreshold and decay channel. The next two are the signal selection efficiency, εsig, and
the prediction for the number of signal events, Nsig, obtained with this efficiency. The last two
columns are the expected number of background events, Nbkg, and the number of events observed
in data, Nobs. The uncertainties on Nsig and Nbkg include contributions from the uncertainties on
the cross-sections but not from that on the integrated luminosity.
mW′ mTmin Channel εsig Nsig Nbkg Nobs
[GeV] [GeV] 300 252 eν 0.228 ± 0.009 688000 ± 28000 12900 ± 820 12717 µν 0.184 ± 0.007 555000 ± 21000 11300 ± 770 10927 400 336 eν 0.319 ± 0.012 325000 ± 12000 5280 ± 360 5176 µν 0.193 ± 0.007 196000 ± 7500 3490 ± 250 3317 500 423 eν 0.325 ± 0.013 141000 ± 5700 2070 ± 150 2017 µν 0.186 ± 0.007 80900 ± 3200 1370 ± 100 1219 600 474 eν 0.397 ± 0.014 83800 ± 2900 1260 ± 96 1214 µν 0.229 ± 0.009 48200 ± 1900 827 ± 64 719 750 597 eν 0.393 ± 0.013 33200 ± 1100 456 ± 45 414 µν 0.226 ± 0.009 19100 ± 750 305 ± 30 255 1000 796 eν 0.386 ± 0.012 9080 ± 290 116 ± 15 101 µν 0.219 ± 0.009 5160 ± 220 84 ± 10 58 1250 1002 eν 0.378 ± 0.012 2980 ± 98 35.3 ± 5.8 34 µν 0.210 ± 0.009 1650 ± 73 28.3 ± 4.6 19 1500 1191 eν 0.376 ± 0.014 1110 ± 40 13.2 ± 2.5 14 µν 0.206 ± 0.010 610 ± 30 10.9 ± 2.3 6 1750 1416 eν 0.336 ± 0.013 396 ± 16 4.56 ± 0.92 5 µν 0.182 ± 0.010 214 ± 12 4.3 ± 1.1 0 2000 1500 eν 0.370 ± 0.015 183.0 ± 7.7 2.99 ± 0.61 3 µν 0.198 ± 0.011 98.0 ± 5.5 3.01 ± 0.80 0 2250 1683 eν 0.327 ± 0.015 71.5 ± 3.3 1.38 ± 0.33 0 µν 0.173 ± 0.011 37.9 ± 2.3 1.44 ± 0.33 0 2500 1888 eν 0.262 ± 0.018 27.1 ± 1.8 0.432 ± 0.091 0 µν 0.140 ± 0.012 14.4 ± 1.2 0.61 ± 0.15 0 2750 1888 eν 0.235 ± 0.024 12.3 ± 1.3 0.432 ± 0.091 0 µν 0.127 ± 0.014 6.64 ± 0.74 0.61 ± 0.15 0 3000 1888 eν 0.183 ± 0.029 5.33 ± 0.86 0.432 ± 0.091 0 µν 0.100 ± 0.016 2.93 ± 0.48 0.61 ± 0.15 0 3250 1888 eν 0.124 ± 0.033 2.22 ± 0.59 0.432 ± 0.091 0 µν 0.069 ± 0.018 1.24 ± 0.32 0.61 ± 0.15 0 3500 1888 eν 0.077 ± 0.031 0.92 ± 0.36 0.432 ± 0.091 0 µν 0.044 ± 0.017 0.52 ± 0.20 0.61 ± 0.15 0 3750 1888 eν 0.047 ± 0.024 0.40 ± 0.21 0.432 ± 0.091 0 µν 0.028 ± 0.013 0.24 ± 0.11 0.61 ± 0.15 0 4000 1888 eν 0.031 ± 0.018 0.20 ± 0.11 0.432 ± 0.091 0 µν 0.019 ± 0.010 0.121 ± 0.061 0.61 ± 0.15 0
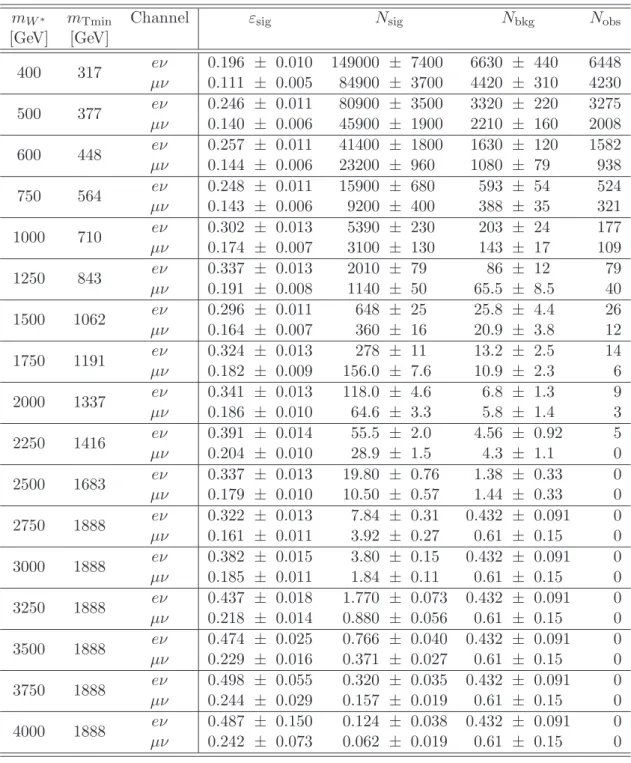
Table 7. Inputs for the W∗→ ℓν σB limit calculations. The columns are the same as in table6.
mW∗ mTmin Channel εsig Nsig Nbkg Nobs
[GeV] [GeV] 400 317 eν 0.196 ± 0.010 149000 ± 7400 6630 ± 440 6448 µν 0.111 ± 0.005 84900 ± 3700 4420 ± 310 4230 500 377 eν 0.246 ± 0.011 80900 ± 3500 3320 ± 220 3275 µν 0.140 ± 0.006 45900 ± 1900 2210 ± 160 2008 600 448 eν 0.257 ± 0.011 41400 ± 1800 1630 ± 120 1582 µν 0.144 ± 0.006 23200 ± 960 1080 ± 79 938 750 564 eν 0.248 ± 0.011 15900 ± 680 593 ± 54 524 µν 0.143 ± 0.006 9200 ± 400 388 ± 35 321 1000 710 eν 0.302 ± 0.013 5390 ± 230 203 ± 24 177 µν 0.174 ± 0.007 3100 ± 130 143 ± 17 109 1250 843 eν 0.337 ± 0.013 2010 ± 79 86 ± 12 79 µν 0.191 ± 0.008 1140 ± 50 65.5 ± 8.5 40 1500 1062 eν 0.296 ± 0.011 648 ± 25 25.8 ± 4.4 26 µν 0.164 ± 0.007 360 ± 16 20.9 ± 3.8 12 1750 1191 eν 0.324 ± 0.013 278 ± 11 13.2 ± 2.5 14 µν 0.182 ± 0.009 156.0 ± 7.6 10.9 ± 2.3 6 2000 1337 eν 0.341 ± 0.013 118.0 ± 4.6 6.8 ± 1.3 9 µν 0.186 ± 0.010 64.6 ± 3.3 5.8 ± 1.4 3 2250 1416 eν 0.391 ± 0.014 55.5 ± 2.0 4.56 ± 0.92 5 µν 0.204 ± 0.010 28.9 ± 1.5 4.3 ± 1.1 0 2500 1683 eν 0.337 ± 0.013 19.80 ± 0.76 1.38 ± 0.33 0 µν 0.179 ± 0.010 10.50 ± 0.57 1.44 ± 0.33 0 2750 1888 eν 0.322 ± 0.013 7.84 ± 0.31 0.432 ± 0.091 0 µν 0.161 ± 0.011 3.92 ± 0.27 0.61 ± 0.15 0 3000 1888 eν 0.382 ± 0.015 3.80 ± 0.15 0.432 ± 0.091 0 µν 0.185 ± 0.011 1.84 ± 0.11 0.61 ± 0.15 0 3250 1888 eν 0.437 ± 0.018 1.770 ± 0.073 0.432 ± 0.091 0 µν 0.218 ± 0.014 0.880 ± 0.056 0.61 ± 0.15 0 3500 1888 eν 0.474 ± 0.025 0.766 ± 0.040 0.432 ± 0.091 0 µν 0.229 ± 0.016 0.371 ± 0.027 0.61 ± 0.15 0 3750 1888 eν 0.498 ± 0.055 0.320 ± 0.035 0.432 ± 0.091 0 µν 0.244 ± 0.029 0.157 ± 0.019 0.61 ± 0.15 0 4000 1888 eν 0.487 ± 0.150 0.124 ± 0.038 0.432 ± 0.091 0 µν 0.242 ± 0.073 0.062 ± 0.019 0.61 ± 0.15 0
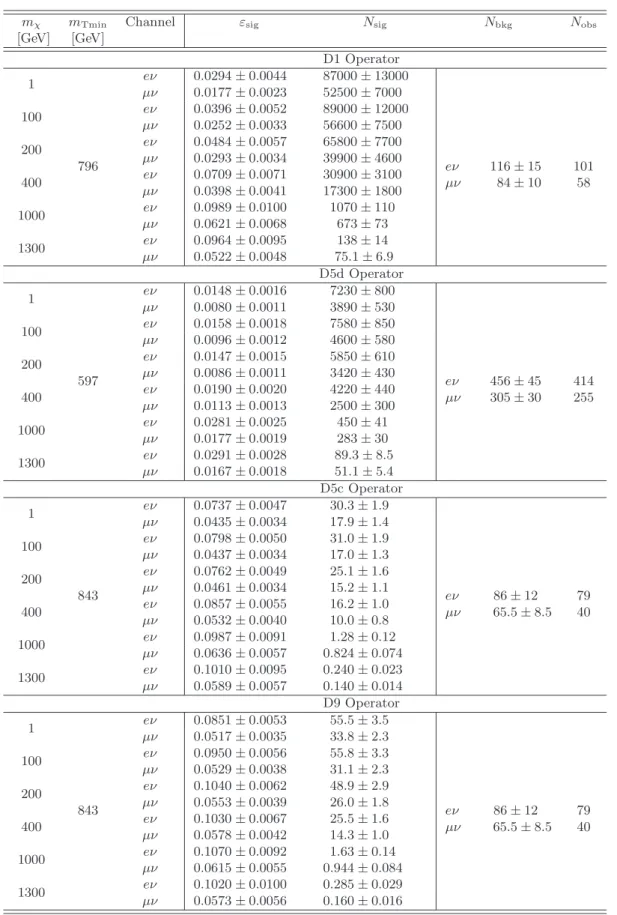
Table 8. Inputs to the limit calculations on the pair production of DM particles for the operators D1, D5d, D5c and D9. Expected number of signal events for each operator is calculated for a different value of the mass scale, notably M∗ = 10 GeV for D1, M∗ = 100 GeV for D5d, and M∗= 1 TeV for operators D9 and D5c. The columns are the same as in table6.
mχ mTmin Channel εsig Nsig Nbkg Nobs [GeV] [GeV] D1 Operator 1 796 eν 0.0294 ± 0.0044 87000 ± 13000 eν 116 ± 15 101 µν 0.0177 ± 0.0023 52500 ± 7000 µν 84 ± 10 58 100 eν 0.0396 ± 0.0052 89000 ± 12000 µν 0.0252 ± 0.0033 56600 ± 7500 200 eν 0.0484 ± 0.0057 65800 ± 7700 µν 0.0293 ± 0.0034 39900 ± 4600 400 eν 0.0709 ± 0.0071 30900 ± 3100 µν 0.0398 ± 0.0041 17300 ± 1800 1000 eν 0.0989 ± 0.0100 1070 ± 110 µν 0.0621 ± 0.0068 673 ± 73 1300 eν 0.0964 ± 0.0095 138 ± 14 µν 0.0522 ± 0.0048 75.1 ± 6.9 D5d Operator 1 597 eν 0.0148 ± 0.0016 7230 ± 800 eν 456 ± 45 414 µν 0.0080 ± 0.0011 3890 ± 530 µν 305 ± 30 255 100 eν 0.0158 ± 0.0018 7580 ± 850 µν 0.0096 ± 0.0012 4600 ± 580 200 eν 0.0147 ± 0.0015 5850 ± 610 µν 0.0086 ± 0.0011 3420 ± 430 400 eν 0.0190 ± 0.0020 4220 ± 440 µν 0.0113 ± 0.0013 2500 ± 300 1000 eν 0.0281 ± 0.0025 450 ± 41 µν 0.0177 ± 0.0019 283 ± 30 1300 eν 0.0291 ± 0.0028 89.3 ± 8.5 µν 0.0167 ± 0.0018 51.1 ± 5.4 D5c Operator 1 843 eν 0.0737 ± 0.0047 30.3 ± 1.9 eν 86 ± 12 79 µν 0.0435 ± 0.0034 17.9 ± 1.4 µν 65.5 ± 8.5 40 100 eν 0.0798 ± 0.0050 31.0 ± 1.9 µν 0.0437 ± 0.0034 17.0 ± 1.3 200 eν 0.0762 ± 0.0049 25.1 ± 1.6 µν 0.0461 ± 0.0034 15.2 ± 1.1 400 eν 0.0857 ± 0.0055 16.2 ± 1.0 µν 0.0532 ± 0.0040 10.0 ± 0.8 1000 eν 0.0987 ± 0.0091 1.28 ± 0.12 µν 0.0636 ± 0.0057 0.824 ± 0.074 1300 eν 0.1010 ± 0.0095 0.240 ± 0.023 µν 0.0589 ± 0.0057 0.140 ± 0.014 D9 Operator 1 843 eν 0.0851 ± 0.0053 55.5 ± 3.5 eν 86 ± 12 79 µν 0.0517 ± 0.0035 33.8 ± 2.3 µν 65.5 ± 8.5 40 100 eν 0.0950 ± 0.0056 55.8 ± 3.3 µν 0.0529 ± 0.0038 31.1 ± 2.3 200 eν 0.1040 ± 0.0062 48.9 ± 2.9 µν 0.0553 ± 0.0039 26.0 ± 1.8 400 eν 0.1030 ± 0.0067 25.5 ± 1.6 µν 0.0578 ± 0.0042 14.3 ± 1.0 1000 eν 0.1070 ± 0.0092 1.63 ± 0.14 µν 0.0615 ± 0.0055 0.944 ± 0.084 1300 eν 0.1020 ± 0.0100 0.285 ± 0.029 µν 0.0573 ± 0.0056 0.160 ± 0.016
The number of observed events is generally in good agreement with the expected number of background events for all mass bins. None of the observations for any mass point in either channel or their combination show a significant excess above background,
so there is no evidence for the observation of either W′ → ℓν or W∗ → ℓν. A deficit in the
number of observed events with respect to the expected number of background events is observed in the muon channel. This deficit has at most a 2.2σ local significance.
Tables9and10 and figure2present the 95% confidence level (CL) observed limits on
σB for both W′ → ℓν and W∗ → ℓν in the electron channel, the muon channel and their
combination. The tables also give the limits obtained without systematic uncertainties.
Limits with various subsets of the systematic uncertainties are shown for W′ → ℓν as a
representative case. The uncertainties on the signal selection efficiency have very little effect on the final limits, and the background-level and luminosity uncertainties are important
only for the lowest masses. Figure 2 also shows the expected limits and the theoretical
σB for a W′ and for a W∗. Limits are evaluated by fixing the W∗ coupling strengths to
give the same partial decay widths as the W′. The off-shell production of W′ degrades the
acceptance at high mass, worsening the limits. As discussed in chapter1, W∗ has different
couplings with respect to W′, enhancing the production at the pole. Since the off-shell
production is reduced with respect to W′, the W∗ limits do not show the same behaviour
at high mass.
In figure2the intersection between the central theoretical prediction and the observed
limits provides the 95% CL lower limits on the mass. The expected and observed W′ and
W∗ mass limits for the electron and muon decay channels as well as their combination
are listed in table 11. The difference between the expected and observed combined mass
limits originate from the slight data deficit in each decay channel that are individually
not significant. The band around the theoretical prediction in figure2 indicates the total
theory uncertainty as described earlier in the text. The mass limit for the W′ decreases by
50 GeV if the intersection between the lower theoretical prediction and the observed limit is used. The uncertainties on εsig, Nbkg and Lint affect the derived mass limits by a similar
amount. Limits are also evaluated following the CLs prescription [74] using the profile
likelihood ratio as the test statistic including all uncertainties. The cross-section limits are found to agree within 10% across the entire mass range, with only marginal impact on the mass limit. The mass limits presented here are a significant improvement over those
reported in previous ATLAS and CMS searches [4–7].
The results of the search for pair production of DM particles in association with a
leptonically decaying W boson are shown in figures3and4. The former shows the observed
limits on M∗, the mass scale of the unknown mediating interaction for the DM particle
pair production, whereas the latter shows the observed limits on the DM–nucleon scattering
cross-section. Both are shown as a function of the DM particle mass, mχ, and presented
at 90% CL. Results of the previous ATLAS searches for hadronically decaying W/Z [19],
leptonically decaying Z [20], and j + χχ [15] are also shown. The observed limits on M∗
as a function of mχ are by a factor ∼1.5 stronger in the search for DM production in
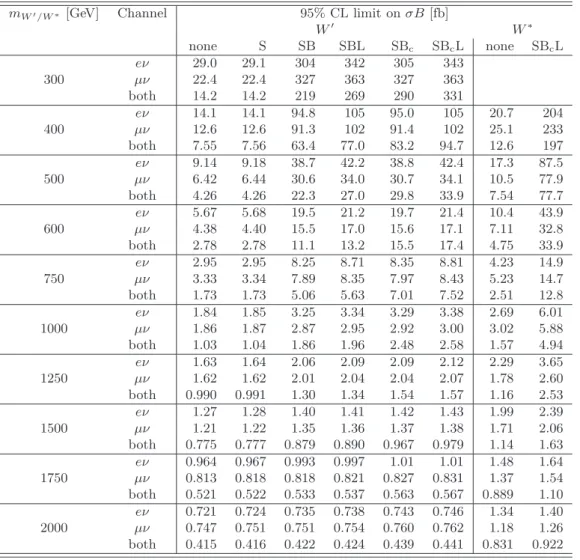
Table 9. Observed upper limits on σB for W′ and W∗ with masses up to 2000 GeV. The first
column is the W′/W∗ mass and the following columns refer to the 95% CL limits for the W′ with
headers indicating the nuisance parameters for which uncertainties are included: S for the event selection efficiency (εsig), B for the background level (Nbkg), and L for the integrated luminosity
(Lint). The column labelled SBL includes all uncertainties neglecting correlations. Results are also
presented when including the correlation of the signal and background cross-section uncertainties, as well as the correlation of the background cross-section uncertainties for the combined limits (SBc,
SBcL). The last two columns show the limits for the W∗ without nuisance parameters and when
including all nuisance parameters with correlations.
mW′/W∗ [GeV] Channel 95% CL limit on σB [fb]
W′ W∗ none S SB SBL SBc SBcL none SBcL 300 eν 29.0 29.1 304 342 305 343 µν 22.4 22.4 327 363 327 363 both 14.2 14.2 219 269 290 331 400 eν 14.1 14.1 94.8 105 95.0 105 20.7 204 µν 12.6 12.6 91.3 102 91.4 102 25.1 233 both 7.55 7.56 63.4 77.0 83.2 94.7 12.6 197 500 eν 9.14 9.18 38.7 42.2 38.8 42.4 17.3 87.5 µν 6.42 6.44 30.6 34.0 30.7 34.1 10.5 77.9 both 4.26 4.26 22.3 27.0 29.8 33.9 7.54 77.7 600 eν 5.67 5.68 19.5 21.2 19.7 21.4 10.4 43.9 µν 4.38 4.40 15.5 17.0 15.6 17.1 7.11 32.8 both 2.78 2.78 11.1 13.2 15.5 17.4 4.75 33.9 750 eν 2.95 2.95 8.25 8.71 8.35 8.81 4.23 14.9 µν 3.33 3.34 7.89 8.35 7.97 8.43 5.23 14.7 both 1.73 1.73 5.06 5.63 7.01 7.52 2.51 12.8 1000 eν 1.84 1.85 3.25 3.34 3.29 3.38 2.69 6.01 µν 1.86 1.87 2.87 2.95 2.92 3.00 3.02 5.88 both 1.03 1.04 1.86 1.96 2.48 2.58 1.57 4.94 1250 eν 1.63 1.64 2.06 2.09 2.09 2.12 2.29 3.65 µν 1.62 1.62 2.01 2.04 2.04 2.07 1.78 2.60 both 0.990 0.991 1.30 1.34 1.54 1.57 1.16 2.53 1500 eν 1.27 1.28 1.40 1.41 1.42 1.43 1.99 2.39 µν 1.21 1.22 1.35 1.36 1.37 1.38 1.71 2.06 both 0.775 0.777 0.879 0.890 0.967 0.979 1.14 1.63 1750 eν 0.964 0.967 0.993 0.997 1.01 1.01 1.48 1.64 µν 0.813 0.818 0.818 0.821 0.827 0.831 1.37 1.54 both 0.521 0.522 0.533 0.537 0.563 0.567 0.889 1.10 2000 eν 0.721 0.724 0.735 0.738 0.743 0.746 1.34 1.40 µν 0.747 0.751 0.751 0.754 0.760 0.762 1.18 1.26 both 0.415 0.416 0.422 0.424 0.439 0.441 0.831 0.922
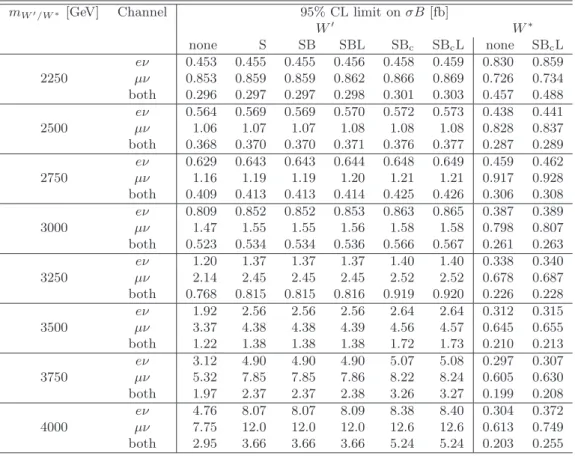
Table 10. Observed upper limits on σB for W′ and W∗ with masses above 2000 GeV. The
columns are the same as in table9.
mW′/W∗ [GeV] Channel 95% CL limit on σB [fb]
W′ W∗ none S SB SBL SBc SBcL none SBcL 2250 eν 0.453 0.455 0.455 0.456 0.458 0.459 0.830 0.859 µν 0.853 0.859 0.859 0.862 0.866 0.869 0.726 0.734 both 0.296 0.297 0.297 0.298 0.301 0.303 0.457 0.488 2500 eν 0.564 0.569 0.569 0.570 0.572 0.573 0.438 0.441 µν 1.06 1.07 1.07 1.08 1.08 1.08 0.828 0.837 both 0.368 0.370 0.370 0.371 0.376 0.377 0.287 0.289 2750 eν 0.629 0.643 0.643 0.644 0.648 0.649 0.459 0.462 µν 1.16 1.19 1.19 1.20 1.21 1.21 0.917 0.928 both 0.409 0.413 0.413 0.414 0.425 0.426 0.306 0.308 3000 eν 0.809 0.852 0.852 0.853 0.863 0.865 0.387 0.389 µν 1.47 1.55 1.55 1.56 1.58 1.58 0.798 0.807 both 0.523 0.534 0.534 0.536 0.566 0.567 0.261 0.263 3250 eν 1.20 1.37 1.37 1.37 1.40 1.40 0.338 0.340 µν 2.14 2.45 2.45 2.45 2.52 2.52 0.678 0.687 both 0.768 0.815 0.815 0.816 0.919 0.920 0.226 0.228 3500 eν 1.92 2.56 2.56 2.56 2.64 2.64 0.312 0.315 µν 3.37 4.38 4.38 4.39 4.56 4.57 0.645 0.655 both 1.22 1.38 1.38 1.38 1.72 1.73 0.210 0.213 3750 eν 3.12 4.90 4.90 4.90 5.07 5.08 0.297 0.307 µν 5.32 7.85 7.85 7.86 8.22 8.24 0.605 0.630 both 1.97 2.37 2.37 2.38 3.26 3.27 0.199 0.208 4000 eν 4.76 8.07 8.07 8.09 8.38 8.40 0.304 0.372 µν 7.75 12.0 12.0 12.0 12.6 12.6 0.613 0.749 both 2.95 3.66 3.66 3.66 5.24 5.24 0.203 0.255
Table 11. Lower limits on the W′ and W∗ masses. The first column is the decay channel (eν, µν
or both combined) and the following give the expected (Exp.) and observed (Obs.) mass limits.
mW′ [TeV] mW∗ [TeV]
Decay Exp. Obs. Exp. Obs.
eν 3.13 3.13 3.08 3.08
µν 2.97 2.97 2.83 2.83
[GeV] W’ m 500 1000 1500 2000 2500 3000 3500 4000 B [fb] σ -1 10 1 10 2 10 3 10 NNLO theory Observed limit Expected limit σ 1 ± Expected σ 2 ± Expected = 8 TeV, s = 8 TeV, Ldt = 20.3 fb∫ -1 s ν e → W’ 95% CL ATLAS [GeV] W* m 500 1000 1500 2000 2500 3000 3500 4000 B [fb] σ -1 10 1 10 2 10 3 10 LO theory Observed limit Expected limit σ 1 ± Expected σ 2 ± Expected = 8 TeV, s = 8 TeV, Ldt = 20.3 fb∫ -1 s ν e → W* 95% CL ATLAS [GeV] W’ m 500 1000 1500 2000 2500 3000 3500 4000 B [fb] σ -1 10 1 10 2 10 3 10 NNLO theory Observed limit Expected limit σ 1 ± Expected σ 2 ± Expected = 8 TeV, s = 8 TeV, Ldt = 20.3 fb∫ -1 s ν µ → W’ 95% CL ATLAS [GeV] W* m 500 1000 1500 2000 2500 3000 3500 4000 B [fb] σ -1 10 1 10 2 10 3 10 LO theory Observed limit Expected limit σ 1 ± Expected σ 2 ± Expected = 8 TeV, s = 8 TeV, Ldt = 20.3 fb∫ -1 s ν µ → W* 95% CL ATLAS [GeV] W’ m 500 1000 1500 2000 2500 3000 3500 4000 B [fb] σ -1 10 1 10 2 10 3 10 NNLO theory Observed limit Expected limit σ 1 ± Expected σ 2 ± Expected = 8 TeV, s = 8 TeV, Ldt = 20.3 fb∫ -1 s ν l → W’ 95% CL ATLAS [GeV] W* m 500 1000 1500 2000 2500 3000 3500 4000 B [fb] σ -1 10 1 10 2 10 3 10 LO theory Observed limit Expected limit σ 1 ± Expected σ 2 ± Expected = 8 TeV, s = 8 TeV, Ldt = 20.3 fb∫ -1 s ν l → W* 95% CL ATLAS
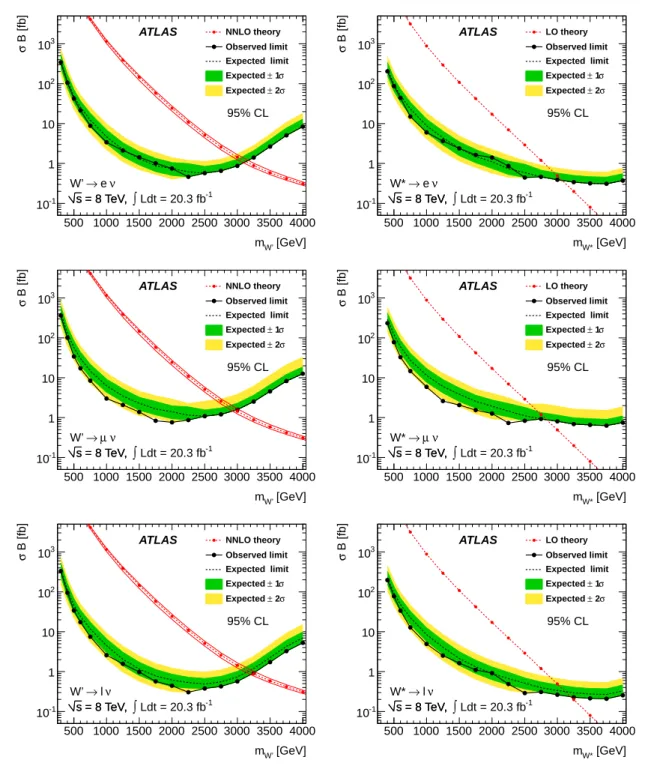
Figure 2. Observed and expected limits on σB for W′ (left) and W∗ (right) at 95% CL in the
electron channel (top), muon channel (centre) and the combination (bottom) assuming the same branching fraction for both channels. The predicted values for σB and their uncertainties (except for W∗) are also shown. The calculation of uncertainties on the W′ cross-sections is explained in
[GeV]
χm
0
200
400
600
800
1000
1200
[GeV]
*
M
10
210
310
410
510
mono-W lep, D9 mono-W lep, D5c mono-W lep, D5d mono-W lep, D1 mono-W/Z had, D9 mono-W/Z had, D5c mono-W/Z had, D5d mono-W/Z had, D1 mono-Z lep, D9 mono-Z lep, D5 mono-Z lep, D1= 8 TeV,
s
= 8 TeV, Ldt = 20.3 fb
∫
-1s
miss Tl + E
90% CL
ATLAS
Figure 3. Observed limits on M∗ as a function of the DM particle mass (mχ) at 90% CL for
the combination of the electron and muon channel, for various operators as described in the text. For each operator, the values below the corresponding line are excluded. No signal samples are generated for masses below 1 GeV but the limits are expected to be stable down to arbitrarily small values. Results of the previous ATLAS searches for hadronically decaying W/Z [19] and leptonically decaying Z [20] are also shown.
[GeV] χ m 1 10 102 103 ] 2 -N cross-section [cm χ -47 10 -46 10 -45 10 -44 10 -43 10 -42 10 -41 10 -40 10 -39 10 -38 10 -37 10 -36 10 -35 10 -34 10
ATLAS mono-W lep, D9 ATLAS mono-W/Z had, D9 ATLAS mono-jet 7 TeV, D9 ATLAS mono-Z lep, D9
PICASSO 2012 SIMPLE 2011 -W + IceCube W b IceCube b COUPP 2012 90% CL spin-dependent ATLAS -1 20.3 fb s = 8 TeV [GeV] χ m 1 10 102 103 ] 2 -N cross-section [cm χ -47 10 -46 10 -45 10 -44 10 -43 10 -42 10 -41 10 -40 10 -39 10 -38 10 -37 10 -36 10 -35 10 -34 10
ATLAS mono-W lep, D5c ATLAS mono-W lep, D5d ATLAS mono-Z lep, D5 ATLAS mono-jet 7 TeV, D5
LUX 2014 CoGeNT 2010 XENON100 2012 SuperCDMS 2014
ATLAS mono-W/Z had, D5c ATLAS mono-W/Z had, D5d
spin-independent
Figure 4. Observed limits on the DM–nucleon scattering cross-section as a function of mχ at
90% CL for spin-independent (left) and spin-dependent (right) operators in the EFT. Results are compared with the previous ATLAS searches for hadronically decaying W/Z [19], leptonically de-caying Z [20], and j + χχ [15], and with direct detection searches by CoGeNT [75], XENON100 [76], CDMS [77,78], LUX [79], COUPP [80], SIMPLE [81], PICASSO [82] and IceCube [83]. The com-parison between direct detection and ATLAS results is only possible within the limits of the validity of the EFT [84].
8 Conclusions
A search is presented for new high-mass states decaying to a lepton (electron or muon)
plus missing transverse momentum using 20.3 fb−1of proton–proton collision data at√s =
8 TeV recorded with the ATLAS experiment at the Large Hadron Collider. No significant
excess beyond SM expectations is observed. Limits on σB are presented. A W′ with
SSM couplings is excluded for masses below 3.24 TeV at 95% CL. The exclusion for W∗
with equivalent couplings is 3.21 TeV. For the pair production of weakly interacting DM particles in events with a leptonically decaying W , limits are set on the mass scale, M∗, of the unknown mediating interaction as well as on the DM–nucleon scattering cross-section.
Acknowledgements
We thank CERN for the very successful operation of the LHC, as well as the support staff from our institutions without whom ATLAS could not be operated efficiently.
We acknowledge the support of ANPCyT, Argentina; YerPhI, Armenia; ARC, Aus-tralia; BMWF and FWF, Austria; ANAS, Azerbaijan; SSTC, Belarus; CNPq and FAPESP, Brazil; NSERC, NRC and CFI, Canada; CERN; CONICYT, Chile; CAS, MOST and NSFC, China; COLCIENCIAS, Colombia; MSMT CR, MPO CR and VSC CR, Czech Republic; DNRF, DNSRC and Lundbeck Foundation, Denmark; EPLANET, ERC and NSRF, European Union; IN2P3-CNRS, CEA-DSM/IRFU, France; GNSF, Georgia; BMBF, DFG, HGF, MPG and AvH Foundation, Germany; GSRT and NSRF, Greece; ISF, MIN-ERVA, GIF, I-CORE and Benoziyo Center, Israel; INFN, Italy; MEXT and JSPS, Japan; CNRST, Morocco; FOM and NWO, Netherlands; BRF and RCN, Norway; MNiSW and NCN, Poland; GRICES and FCT, Portugal; MNE/IFA, Romania; MES of Russia and
ROSATOM, Russian Federation; JINR; MSTD, Serbia; MSSR, Slovakia; ARRS and MIZˇS,
Slovenia; DST/NRF, South Africa; MINECO, Spain; SRC and Wallenberg Foundation, Sweden; SER, SNSF and Cantons of Bern and Geneva, Switzerland; NSC, Taiwan; TAEK, Turkey; STFC, the Royal Society and Leverhulme Trust, United Kingdom; DOE and NSF, United States of America.
The crucial computing support from all WLCG partners is acknowledged gratefully, in particular from CERN and the ATLAS Tier-1 facilities at TRIUMF (Canada), NDGF (Denmark, Norway, Sweden), CC-IN2P3 (France), KIT/GridKA (Germany), INFN-CNAF (Italy), NL-T1 (Netherlands), PIC (Spain), ASGC (Taiwan), RAL (UK) and BNL (USA)
and in the Tier-2 facilities worldwide.
References
[1] G. Altarelli, B. Mele, and M. Ruiz-Altaba, Searching for new heavy vector bosons in p¯p colliders, Z. Phys. C 45 (1989) 109.
[2] T. Aaltonen et al., CDF Collaboration, Search for a New Heavy Gauge Boson W′ with
Electron + missing ET Event Signature in p¯p collisions at √s = 1.96 TeV, Phys. Rev. D 83
[3] CMS Collaboration, Search for leptonic decays of W′ in pp collisions at √s = 7 TeV, JHEP
08(2012) 023, [arXiv:1204.4764].
[4] CMS Collaboration, Search for new physics in final states with a lepton and missing transverse energy in pp collisions at the LHC, Phys. Rev. D 87 (2013) 072005, [arXiv:1302.2812].
[5] ATLAS Collaboration, Search for high-mass states with one lepton plus missing transverse momentum in proton-proton collisions at√s = 7 TeV with the ATLAS detector, Phys. Lett. B 701(2011) 50, [arXiv:1103.1391].
[6] ATLAS Collaboration, Search for a heavy gauge boson decaying to a charged lepton and a neutrino in 1 fb−1 of pp collisions at √s = 7 TeV using the ATLAS detector, Phys. Lett. B
705(2011) 28–46, [arXiv:1108.1316].
[7] ATLAS Collaboration, ATLAS search for a heavy gauge boson decaying to a charged lepton and a neutrino in pp collisions at√s = 7 TeV, Eur. Phys. J. C 72 (2012) 1–23,
[arXiv:1209.4446].
[8] M. Chizhov and G. Dvali, Origin and Phenomenology of Weak-Doublet Spin-1 Bosons, Phys Lett. B 703 (2011) 593–598, [arXiv:0908.0924].
[9] M. Chizhov, V. Bednyakov, and J. Budagov, Proposal for chiral bosons search at LHC via their unique new signature, Phys. Atom. Nucl. 71 (2008) 2096–2100, [arXiv:0801.4235]. [10] A. Birkedal, K. Matchev, and M. Perelstein, Dark matter at colliders: A Model independent
approach, Phys. Rev. D 70 (2004) 077701, [hep-ph/0403004].
[11] J. Goodman et al., Constraints on Light Majorana dark Matter from Colliders, Phys. Lett. B 695(2011) 185–188, [arXiv:1005.1286].
[12] Y. Bai, P. J. Fox, and R. Harnik, The Tevatron at the Frontier of Dark Matter Direct Detection, JHEP 12 (2010) 048, [arXiv:1005.3797].
[13] J. Goodman et al., Constraints on Dark Matter from Colliders, Phys. Rev. D 82 (2010) 116010, [arXiv:1008.1783].
[14] T. Aaltonen et al., CDF Collaboration, A Search for dark matter in events with one jet and missing transverse energy in p¯p collisions at √s = 1.96 TeV, Phys. Rev. Lett. 108 (2012) 211804, [arXiv:1203.0742].
[15] ATLAS Collaboration, Search for dark matter candidates and large extra dimensions in events with a jet and missing transverse momentum with the ATLAS detector, JHEP 04 (2013) 075, [arXiv:1210.4491].
[16] CMS Collaboration, Search for dark matter and large extra dimensions in monojet events in pp collisions at√s = 7 TeV, JHEP 09 (2012) 094, [arXiv:1206.5663].
[17] ATLAS Collaboration, Search for dark matter candidates and large extra dimensions in events with a photon and missing transverse momentum in pp collision data at√s = 7 TeV with the ATLAS detector, Phys. Rev. Lett. 110 (2013) 011802, [arXiv:1209.4625].
[18] CMS Collaboration, Search for dark matter and large extra dimensions in pp collisions yielding a photon and missing transverse energy, Phys. Rev. Lett. 108 (2012) 261803, [arXiv:1204.0821].
boson and missing transverse momentum in pp collisions at√s=8 TeV with the ATLAS detector, Phys. Rev. Lett. 112 (2014) 041802, [arXiv:1309.4017].
[20] ATLAS Collaboration, Search for dark matter in events with a Z boson and missing
transverse momentum in pp collisions at√s=8 TeV with the ATLAS detector, Submitted to Phys. Rev. D (2014) [arXiv:1404.0051].
[21] Y. Bai and T. M. Tait, Searches with Mono-Leptons, Phys. Lett. B 723 (2013) 384–387, [arXiv:1208.4361].
[22] M. Beltran, D. Hooper, E. W. Kolb, Z. A. Krusberg, and T. M. Tait, Maverick dark matter at colliders, JHEP 09 (2010) 037, [arXiv:1002.4137].
[23] Q.-H. Cao, C.-R. Chen, C. S. Li, and H. Zhang, Effective Dark Matter Model: Relic density, CDMS II, Fermi LAT and LHC, JHEP 08 (2011) 018, [arXiv:0912.4511].
[24] A. Rajaraman, W. Shepherd, T. M. Tait, and A. M. Wijangco, LHC Bounds on Interactions of Dark Matter, Phys. Rev. D 84 (2011) 095013, [arXiv:1108.1196].
[25] P. J. Fox, R. Harnik, J. Kopp, and Y. Tsai, Missing Energy Signatures of Dark Matter at the LHC, Phys. Rev. D 85 (2012) 056011, [arXiv:1109.4398].
[26] K. Cheung, P.-Y. Tseng, Y.-L. S. Tsai, and T.-C. Yuan, Global Constraints on Effective Dark Matter Interactions: Relic Density, Direct Detection, Indirect Detection, and Collider, JCAP 05(2012) 001, [arXiv:1201.3402].
[27] R. Cotta, J. Hewett, M. Le, and T. Rizzo, Bounds on Dark Matter Interactions with Electroweak Gauge Bosons, Phys. Rev. D 88 (2013) 116009, [arXiv:1210.0525]. [28] O. Buchmueller, M. J. Dolan, and C. McCabe, Beyond Effective Field Theory for Dark
Matter Searches at the LHC, JHEP 01 (2014) 025, [arXiv:1308.6799].
[29] G. Busoni, A. De Simone, E. Morgante, and A. Riotto, On the Validity of the Effective Field Theory for Dark Matter Searches at the LHC, Phys. Lett. B 728 (2014) 412–421,
[arXiv:1307.2253].
[30] ATLAS Collaboration, ATLAS Experiment at the CERN Large Hadron Collider, JINST 3 (2008) S08003.
[31] ATLAS Collaboration, Electron reconstruction and identification efficiency measurements with the ATLAS detector using the 2011 LHC proton-proton collision data, Submitted to Eur. Phys. J. C (2014) [arXiv:1404.2240].
[32] ATLAS Collaboration, Electron performance measurements with the ATLAS detector using the 2010 LHC proton-proton collision data, Eur. Phys. J. C 72 (2012) 1909,
[arXiv:1110.3174].
[33] ATLAS Collaboration, Performance of missing transverse momentum reconstruction in proton-proton collisions at 7 TeV in ATLAS, Eur. Phys. J. C 72 (2012) 1844,
[arXiv:1108.5602].
[34] ATLAS Collaboration, Improved luminosity determination in pp collisions at√s = 7 TeV using the ATLAS detector at the LHC, Eur. Phys. J. C 73 (2013) 2518, [arXiv:1302.4393]. [35] T. Sjostrand, S. Mrenna, and P. Skands, PYTHIA 6.4 physics and manual, JHEP 05 (2006)
026, [hep-ph/0603175].
[36] T. Sjostrand, S. Mrenna, and P. Skands, A Brief Introduction to PYTHIA 8.1, Comput. Phys. Commun. 178 (2008) 852–867, [arXiv:0710.3820].
[37] A. Martin, W. Stirling, R. Thorne, and G. Watt, Parton distributions for the LHC, Eur. Phys. J. C 63 (2009) 189, [arXiv:0901.0002].
[38] A. Belyaev, N. D. Christensen, and A. Pukhov, CalcHEP 3.4 for collider physics within and beyond the Standard Model, Comput. Phys. Commun. 184 (2013) 1729–1769,
[arXiv:1207.6082].
[39] J. Pumplin et al., New generation of parton distributions with uncertainties from global QCD analysis, JHEP 07 (2002) 012, [hep-ph/0201195].
[40] J. Alwall, M. Herquet, F. Maltoni, O. Mattelaer, and T. Stelzer, MadGraph 5 : Going Beyond, JHEP 06 (2011) 128, [arXiv:1106.0522].
[41] S. Frixione, P. Nason, and C. Oleari, Matching NLO QCD computations with Parton Shower simulations: the POWHEG method, JHEP 11 (2007) 070, [arXiv:0709.2092].
[42] H.-L. Lai et al., New parton distributions for collider physics, Phys. Rev. D 82 (2010) 074024, [arXiv:1007.2241].
[43] S. Frixione and B. R. Webber, Matching NLO QCD computations and parton shower simulations, JHEP 06 (2002) 029, [hep-ph/0204244].
[44] B. P. Kersevan and E. Richter-Was, The Monte Carlo event generator AcerMC versions 2.0 to 3.8 with interfaces to PYTHIA 6.4, HERWIG 6.5 and ARIADNE 4.1, Comput. Phys. Commun. 184 (2013) 919–985, [hep-ph/0405247].
[45] G. Corcella et al., HERWIG 6: An Event generator for hadron emission reactions with interfering gluons (including supersymmetric processes), JHEP 01 (2001) 010,
[hep-ph/0011363].
[46] J. M. Butterworth and M. H. Seymour, Multi-parton interactions in Herwig for the LHC,
http://projects.hepforge.org/jimmy, (2007).
[47] T. Gleisberg et al., Event generation with SHERPA 1.1, JHEP 02 (2009) 007, [arXiv:0811.4622].
[48] P. Golonka and Z. Was, PHOTOS Monte Carlo: A Precision tool for QED corrections in Z and W decays, Eur. Phys. J. C 45 (2006) 97, [hep-ph/0506026].
[49] ATLAS Collaboration, ATLAS Simulation Infrastructure, Eur. Phys. J. C 70 (2010) 823, [physics.ins-det/1005.4568].
[50] S. Agostinelli et al., GEANT4: A Simulation toolkit, Nucl. Instr. Meth. A 506 (2003) 250. [51] ATLAS Collaboration, ATLAS tunes of PYTHIA 6 and Pythia 8 for MC11,
ATLAS-PHYS-PUB-2011-009,http://cds.cern.ch/record/1363300, (2011).
[52] ATLAS Collaboration, Summary of ATLAS Pythia 8 tunes, ATLAS-PHYS-PUB-2012-003, http://cds.cern.ch/record/1474107, (2012).
[53] ATLAS Collaboration, New ATLAS event generator tunes to 2010 data, ATLAS-PHYS-PUB-2011-008,http://cds.cern.ch/record/1345343, (2011).
[54] R. Hamberg, W. L. van Neerven, and T. Matsuura, A Complete calculation of the order α2 s
correction to the Drell-Yan K factor, Nucl. Phys. B 359 (1991) 343–405; Erratum–ibid. 644 (2002) 403.
[55] C. Anastasiou, L. Dixon, K. Melnikov, and F. Petriello, High-precision qcd at hadron colliders: Electroweak gauge boson rapidity distributions at next-to-next-to leading order, Phys. Rev. D 69 (2004) 094008, [hep-ph/0312266].
[56] K. Melnikov and F. Petriello, Electroweak gauge boson production at hadron colliders through O(α2
s), Phys. Rev. D 74 (2006) 114017, [hep-ph/0609070].
[57] R. Gavin, Y. Li, F. Petriello, and S. Quackenbush, FEWZ 2.0: A code for hadronic Z production at next-to-next-to-leading order, Comput. Phys. Commun. 182 (2011) 2388, [arXiv:1011.3540].
[58] S. G. Bondarenko and A. A. Sapronov, NLO EW and QCD proton-proton cross section calculations with mcsanc-v1.01, Comput. Phys. Commun. 184 (2013) 2343–2350, [arXiv:1301.3687].
[59] M. Cacciari, M. Czakon, M. Mangano, A. Mitov, and P. Nason, Top-pair production at hadron colliders with next-to-next-to-leading logarithmic soft-gluon resummation, Phys. Lett. B 710(2012) 612–622, [arXiv:1111.5869].
[60] P. Baernreuther, M. Czakon, and A. Mitov, Percent Level Precision Physics at the Tevatron: First Genuine NNLO QCD Corrections to q ¯q → t¯t+ X, Phys. Rev. Lett. 109 (2012) 132001, [arXiv:1204.5201].
[61] M. Czakon and A. Mitov, NNLO corrections to top-pair production at hadron colliders: the all-fermionic scattering channels, JHEP 12 (2012) 054, [arXiv:1207.0236].
[62] M. Czakon and A. Mitov, NNLO corrections to top pair production at hadron colliders: the quark-gluon reaction, JHEP 01 (2013) 080, [arXiv:1210.6832].
[63] M. Czakon, P. Fiedler, and A. Mitov, Total Top-Quark Pair-Production Cross Section at Hadron Colliders Through O(α4
S), Phys. Rev. Lett. 110 (2013), no. 25 252004,
[arXiv:1303.6254].
[64] M. Czakon and A. Mitov, Top++: A Program for the Calculation of the Top-Pair Cross-Section at Hadron Colliders, (2011) [arXiv:1112.5675].
[65] R. D. Ball et al., Parton distributions with LHC data, Nucl. Phys. B 867 (2013) 244–289, [arXiv:1207.1303].
[66] S. Alekhin, J. Blumlein, and S. Moch, Parton Distribution Functions and Benchmark Cross Sections at NNLO, Phys. Rev. D 86 (2012) 054009, [arXiv:1202.2281].
[67] V. Radescu for the H1, ZEUS Collaborations, Hera Precision Measurements and Impact for LHC Predictions,arXiv:1107.4193. HERAPDF 1.5 NLO and NNLO preliminary,
H1prelim-11-042, ZEUS-prel-11-002, Proceedings of Moriond 2011. [68] S. Alekhin et al., The PDF4LHC Working Group Interim Report, (2011)
[arXiv:1101.0536].
[69] J. Wenninger, Energy Calibration of the LHC Beams at 4 TeV, CERN-ATS-2013-040, http://cds.cern.ch/record/1546734, (2013).
[70] ATLAS Collaboration, Selection of jets produced in proton-proton collisions with the ATLAS detector using 2011 data, ATLAS-CONF-2012-020,
http://cdsweb.cern.ch/record/1430034, (2012).
[71] ATLAS Collaboration, Measurement of the top quark-pair production cross section with ATLAS in pp collisions at √s = 7 TeV, Eur. Phys. J. C 71 (2011) 1577, [arXiv:1012.1792]. [72] ATLAS Collaboration, Measurement of the muon reconstruction performance of the ATLAS