Guilherme João Mendes Gonçalves Martins
Licenciado em Ciências de Engenharia do Ambiente
Technical and economical assessment
of the conversion of a conventional
WWTP to reach energy neutrality and to
provide water reclamation
Dissertação para obtenção do Grau de Mestre em
Engenharia do Ambiente – Perfil de Engenharia Sanitária
Orientador: Engenheiro João Luís Paciência Dinis, CTGA Co-Orientador: Professora Doutora Leonor Miranda Monteiro do Amaral, Professora Auxiliar, FCT-UNL
Júri:
Presidente e arguente: Prof. Doutor António Pedro de Coimbra Macedo Mano Vogal: Prof.ª Doutora Rita Maurício Rodrigues Rosa
Vogal: Prof.ª Doutora Leonor Miranda Monteiro do Amaral
Dezembro 2018
Technical and economical assessment of the conversion of a conventional WWTP to reach energy neutrality and to provide water reclamation
Copyright © Guilherme João Mendes Gonçalves Martins, Faculdade de Ciências e Tecnologia, Universidade Nova de Lisboa.
A Faculdade de Ciências e Tecnologia e a Universidade Nova de Lisboa têm o direito, perpétuo e sem limites geográficos, de arquivar e publicar esta dissertação através de exemplares impressos reproduzidos em papel ou de forma digital, ou por qualquer outro meio conhecido ou que venha a ser inventado, e de a divulgar através de repositórios científicos e de admitir a sua cópia e distribuição com objectivos educacionais ou de investigação, não comerciais, desde que seja dado crédito ao autor e editor.
Acknowledgments
To my supervisors for their careful insight making this project possible to materialize namely, Eng. João Dinis for always being present and giving me the necessary tools for the development of this project while guiding me from beginning to end. For the knowledge sharing and professional advice in a friendly manner.
Prof. Leonor Amaral for the kind words of motivation since the beginning of this project and for the trust and freedom that I have been given.
To the company CTGA as a whole, particularly to the management, namely Dr. Ezequiel China for letting me develop this project and also for conceding me with first-hand experience of the workplace of an engineering firm.
I’m grateful to everyone I came in contact with, everyone was very attentive and helpful, which contributed greatly to the experience and knowledge assimilation. I want to give a special mention to Eng. João Lopes da Silva, Eng. Hugo Sabino, Eng. José Paixão, Eng. Rita Gonçalves, Eng. Joana Blazer, Lab. Technician Pedro Carlos and Eng. Cristina Costa.
To my family for making this possible and for supporting me every step of the way.
To my friends that have directly or indirectly been with me throughout the elaboration of this project.
Abstract
Conventional WWTP are big energy consumers. This is an issue in terms of operation costs and a concern as global climate change constitutes a serious problem. Simultaneously, water scarcity constitutes a growing worldwide issue.
This thesis accesses the possibility of reaching energy neutrality and reducing operation costs in Espinho WWTP, by means of optimization of the treatment line, in a cost-effective manner. Moreover, the economic feasibility of providing tertiary treatment to the secondary effluent, in order to reclaim water for irrigation, is also investigated here.
It is presented an evaluation of possible processes, that could be implemented, that reduce the energy demand, such as CEPT, as well as methods for increasing the energy production in a treatment plant, like anaerobic digestion, co-digestion or the installation of photovoltaic (PV) solar panel modules. The latter is nowadays starting to be a requirement in the design/construction of new sizeable WWTP.
Adjacent to the WWTP, there is a golf course, which demands 200,000 m3/y of water for irrigation. The water reclamation is seen as a possible to strategy to supply the needs.
The design of each treatment phase of Espinho WWTP is verified, both when operating with conventional primary treatment and chemically enhanced primary treatment (CEPT). Jar-tests with Espinho affluent wastewater were conducted, and the optimum PAX18 coagulant dosage determined was 15 mg/L, to perform CEPT.
The methods studied contribute to improving the energy efficiency of a WWTP and are presented as possible approaches to progress in the direction of energy self-sufficiency. The operation costs, as in reagents and energy, were calculated prior to the WWTP optimization and following each possible upgrade.
CEPT demonstrates to reduce the energy consumption of the aeration process by approximately 40%. On the other hand, co-digestion proves to boost the energy production in the anaerobic digestion considerably, by 84% to 154%. Additionally, PV solar panel modules have shown to supply 10% of Espinho WWTP energy demands. The implementation of the studied methods allows the WWTP to produce 68% of its total energy needs.
Resumo
As ETAR convencionais apresentam-se como grandes consumidores energéticos, o que é motivo de preocupação, tendo em conta as alterações climáticas. Simultaneamente, a escassez de água constitui um problema crescente a nível global.
Esta dissertação avalia a possibilidade de se atingir a neutralidade energética e uma redução dos custos de operação da ETAR de Espinho, com a otimização da linha de tratamento de uma forma economicamente viável. Adicionalmente, é realizada uma análise económica para a hipótese de se efetuar tratamento terciário, para obtenção de água residual tratada para irrigação.
É realizada uma avaliação de possíveis processos que contribuem para a redução do consumo energético, tal como o tratamento primário quimicamente assistido (CEPT). São ainda apresentados métodos passíveis de aumentar a produção de energia numa estação de tratamento, como a digestão anaeróbia, co-digestão ou a instalação de painéis solares fotovoltaicos (PV). A instalação de painéis PV atualmente é um dos requisitos no dimensionamento e construção de novas ETAR de grande dimensão.
Nas proximidades da ETAR, há um campo de golf, que requer 200,000 m3/ano de água para irrigação. A reutilização de água residual tratada, é uma possível estratégia para suprir estas necessidades.
É realizada uma verificação do dimensionamento de cada fase de tratamento da ETAR de Espinho, com tratamento primário convencional e com CEPT. Foram ainda efetuados ensaios de jar-test com a água residual afluente à ETAR de Espinho, tendo-se determinado uma dose ótima de 15 mg/L do coagulante PAX18 para realização de CEPT.
Os métodos estudados contribuem para uma melhor eficiência energética da ETAR e são apresentados como uma possível abordagem para alcançar a autossuficiência energética. Os custos de operação, em termos de reagentes e energia, são calculados para cada opção estudada.
Neste trabalho comprovou-se que o CEPT reduz em cerca de 40% o consumo de energia no arejamento e a co-digestão demonstrou aumentar de 84% a 154% a produção de energia no processo de digestão anaeróbia. Adicionalmente, os PV demonstraram suprir 10% das necessidades energéticas da ETAR de Espinho. A implementação dos métodos estudados permite que a ETAR produza 68% das suas necessidades energéticas totais.
Palavras-chave: ETAR de Espinho; Neutralidade energética; Arejamento; Decantação primária quimicamente assistida; Co-digestão
Contents
1 Introduction ... 1
2 Objective ... 5
3 Literature Review ... 7
Preliminary Treatment ... 7 Primary Treatment ... 11 Biological Treatment ... 19 Sludge Thickening ... 23 Anaerobic Digestion ... 25 Sludge Dewatering ... 29 Energy Recovery ... 33 Water Reclamation ... 414 Methodology... 47
Case Study ... 47Determination of coagulant optimum dose in CEPT ... 63
WWTP Design Verification ... 67
Energy Balance and Operation Costs ... 75
Cost-benefit Analysis ... 77
5 Results ... 79
Determination of Coagulant Optimum Dosage in CEPT ... 79
Mass Balances ... 83
WWTP Performance Verification ... 93
WWTP Performance Verification with CEPT ... 99
Fine Bubble Aeration ... 105
Co-Digestion ... 107
Photovoltaic Solar Panels ... 109
Energy Balance and Operation Costs ... 111
Cost-benefit Analysis of Improvement ... 121
6 Discussion ... 129
Coagulant Optimum Dosage in CEPT ... 129
WWTP Optimization ... 129
Energy Balance ... 139
Water Reclamation by Ultrafiltration ... 141
7 Conclusion ... 143
8 Final Considerations ... 145
Bibliography ... 147
Annexes... 157
xii
Annex B – COD Determination Method ... 170
Annex C – Phosphorus Determination Method ... 171
Annex D – Orthophosphates Determination Method ... 172
Annex E – General Formulas ... 173
Annex F – Espinho WWTP Solar Radiation ... 174
Annex G – Sludge Pumping Costs ... 175
List of Tables
Table 3.1-1: Quantity of grit removed from wastewater from separate and combined collection
systems in aerated grit chambers ... 9
Table 3.2-1: Design parameters information for primary sedimentation tanks. ... 12
Table 3.2-2: Primary sludge characteristics ... 13
Table 3.2-3: Conventional primary treatment removal efficiency versus CEPT ... 14
Table 3.2-4: Parameter efficiencies for high-rate clarification processes ... 16
Table 3.3-1: Complete mix activated sludge (CMAS) design criteria. ... 20
Table 3.3-2: Design parameters information for secondary sedimentation tanks. ... 20
Table 3.4-1: Typical solids concentration of sludges and solids loading for gravity thickeners. . 23
Table 3.5-1: suggested SRT for mesophilic complete-mix anaerobic digesters ... 27
Table 3.6-1: Performance data of dewatering technology for anaerobically digested sludge (Primary + WAS). ... 30
Table 3.6-2: Annual sludge dewatering total costs of a medium – large sized WWTP (capital, operation and maintenance) of Volos WWTP in Greece ... 31
Table 3.6-3: Annual sludge dewatering total costs of a small – medium sized WWTP (capital, operation and maintenance) of Lavrio WWTP in Greece ... 31
Table 3.8-1: Summary of common disinfectants ... 45
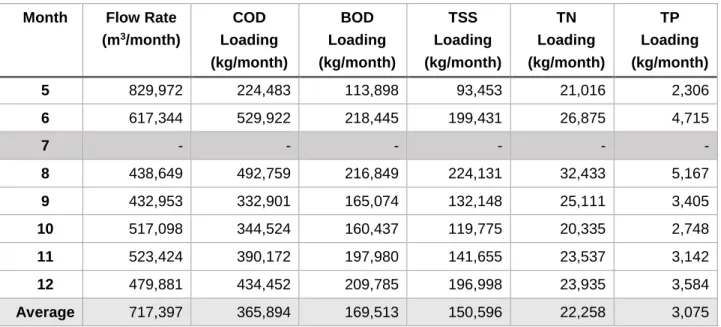
Table 4.1-1: Affluent wastewater baseline data – 2016. ... 54
Table 4.1-2: Data of affluent wastewater conditions of scenario 1. ... 57
Table 4.1-3: Data of affluent wastewater conditions of scenario 2. ... 58
Table 4.1-4: Data of affluent wastewater conditions of scenario 3. ... 59
Table 4.1-5: Espinho WWTP wastewater effluent discharge permit limits ... 60
Table 4.3-1: Conventional primary treatment and CEPT design verification parameters. ... 68
Table 4.3-2: Auxiliary parameters utilized in the turbine aeration design verification. ... 69
Table 4.3-3: Auxiliary parameters utilized in the fine bubble aeration design verification. ... 69
Table 4.3-4: Blower characteristics. ... 70
Table 4.3-5: Blower characteristics. ... 71
Table 4.3-6: Photovoltaic solar panel module characteristics. ... 73
Table 5.1-1: PAX 18 coagulant dosages and due removal with Espinho WWTP wastewater. .. 81
Table 5.2-1: Number of the mass balance components in Espinho WWTP treatment line. ... 85
Table 5.2-2: Mass balance of Scenario 1 (with conventional primary treatment). ... 86
Table 5.2-3: Mass balance of Scenario 2 (with conventional primary treatment). ... 87
Table 5.2-4: Mass balance of Scenario 3 (with conventional primary treatment). ... 88
Table 5.2-5: Mass balance of Scenario 1 (with CEPT). ... 89
Table 5.2-6: Mass balance of Scenario 2 (with CEPT). ... 90
Table 5.2-7: Mass balance of Scenario 3 (with CEPT). ... 91
Table 5.3-1: Conventional primary treatment design verification results for the scenarios considered. ... 93
Table 5.3-2: Biological reactor design performance verification results... 93
Table 5.3-3: Secondary sedimentation results for the scenarios considered. ... 94
xiv
Table 5.3-5: Gravity thickening results for the scenarios considered. ... 95
Table 5.3-6: Mechanical thickening results for the scenarios considered. ... 95
Table 5.3-7: Anaerobic digestion design verification results. ... 96
Table 5.3-8: Sludge dewatering design verification results. ... 97
Table 5.4-1: Chemically Enhanced primary treatment design verification results for the scenarios considered. ... 99
Table 5.4-2: Biological reactor design performance verification results... 100
Table 5.4-3: Secondary sedimentation results for the scenarios considered. ... 100
Table 5.4-4: Turbine aeration results for the scenarios considered. ... 101
Table 5.4-5: Gravity thickening results for the scenarios considered. ... 101
Table 5.4-6: Mechanical thickening results for the scenarios considered. ... 102
Table 5.4-7: Anaerobic digestion design verification results. ... 102
Table 5.4-8: Sludge dewatering design verification results. ... 103
Table 5.5-1: Fine bubble aeration results for the scenarios considered. ... 105
Table 5.5-2: Air blowers functioning characteristics. ... 105
Table 5.5-3: Fine bubble aeration results for the scenarios considered. ... 106
Table 5.5-4: Air blowers functioning characteristics. ... 106
Table 5.6-1: FW substrate applied in the anaerobic digesters in each scenario. ... 107
Table 5.6-2: AcoD design verification results. ... 108
Table 5.7-1: Usable area and number of PV solar panel modules. ... 109
.Table 5.8-1: WWTP energy costs. ... 112
Table 5.8-2: WWTP energy and reagent costs of treatment processes. ... 113
Table 5.8-3: WWTP total costs and energy balance. ... 114
Table 5.8-4: AcoD CHP produced energy. ... 117
Table 5.8-5: Espinho WWTP cost indicators. ... 117
Table 5.8-6: WWTP energy balance with the implementation of the photovoltaic solar panels. ... 118
Table 5.9-1: CEPT cost-benefit analysis – scenario 1. ... 122
Table 5.9-2: Fine bubble aeration cost-benefit analysis – scenario 1. ... 124
Table 5.9-3: Photovoltaic Solar Panels cost-benefit analysis. ... 125
List of Figures
Figure 3.2-1: Conventional rectangular clarifier ... 11
Figure 3.2-2: Conventional circular clarifier ... 12
Figure 3.2-3: TP removal with PACl (PAX 18 and PAC laboratory made)... 15
Figure 3.2-4: Fine mesh sieve sludge concentration from various full-scale WWTP ... 18
Figure 3.2-5: Primary clarifier sludge from several full-scale WTTPs ... 18
Figure 3.5-1: Anaerobic digestion reactions ... 26
Figure 3.7-1: Average energy expenditure in a conventional wastewater treatment plant with CAS ... 34
Figure 3.7-2: Processes capable of recovering energy within a WWTP, either by saving it and/or producing it ... 35
Figure 3.8-1: Global water withdrawal by sector ... 41
Figure 3.8-2: Water consumption by sector in Portugal in the year of 2002 and 2010 ... 41
Figure 3.8-3: Wastewater treatment complexity for obtaining high-quality water ... 42
Figure 3.8-4: Membrane filtration types and applications. ... 43
Figure 4.1-1: Iberian Peninsula with Espinho WWTP marked location... 48
Figure 4.1-2: Espinho municipality with Espinho WWTP marked location ... 48
Figure 4.1-3: Espinho WWTP satellite view ... 49
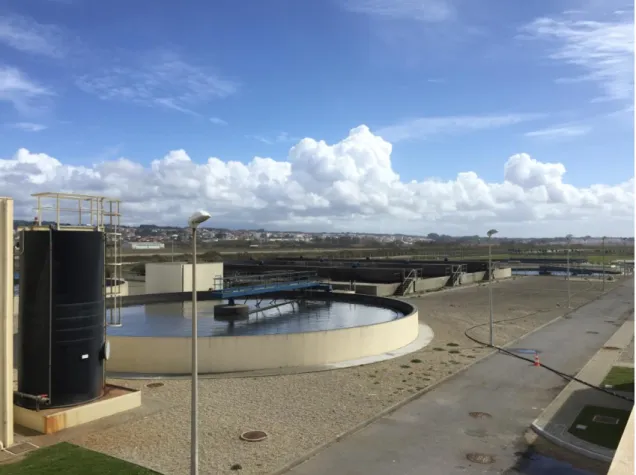
Figure 4.1-4: Espinho WWTP primary clarifier, biological reactor and secondary clarifier in the back. The black tank on the left is the PAX 18, the coagulant used in CEPT, storage unit. ... 51
Figure 4.1-5: Espinho WWTP current treatment train. ... 53
Figure 4.1-6: COD loadings and flow rate of each month in 2016. ... 55
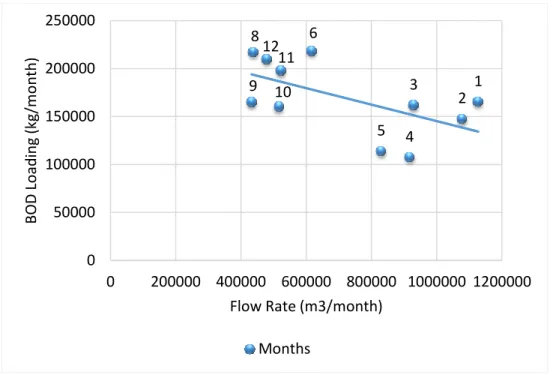
Figure 4.1-7: BOD loadings and flow rate of each month in 2016. ... 56
Figure 4.1-8: COD loadings and flow rate of each month in 2016. ... 59
Figure 4.1-9: BOD loadings and flow rate of each month in 2016. ... 60
Figure 4.2-1: Spectroquant® cell tests kits on the left; Spectroquant® cell tests COD vials on the right. ... 66
Figure 5.1-1: Four jars filled with raw wastewater from Espinho WWTP in the stirring machine where the Jar tests were performed. ... 79
Figure 5.1-2: Jar tests with different doses of coagulant - beginning of the flocculation phase (slow mixing), post coagulation phase (rapid mixing). ... 80
Figure 5.1-3: Jar tests with different doses of coagulant – beginning of the sedimentation phase. ... 80
Figure 5.1-4: Jar tests with different doses of coagulant – after 20 minutes of sedimentation. .. 81
Figure 5.1-5: PAX 18 coagulant dosages and due removal percentage with Espinho WWTP wastewater. ... 82
Figure 5.2-1: Espinho WWTP treatment line and components numbering. ... 84
Figure 5.7-1: Photovoltaic solar panel installation areas considered in Espinho WWTP ... 109
Figure 5.8-1: Energy expenditure distribution in Espinho WWTP with conventional primary treatment. ... 115
xvi
Figure 5.8-3: Methods to improve the energy balance, amount of energy produced in
List of Acronyms
AcoD Anaerobic Co-Digestion
AD Anaerobic Digestion
AT Aeration Tank
BNR Biological Nutrient Removal
BOD Biochemical Oxygen Demand
BOD5 Five-day Biochemical Oxygen Demand C/N ratio Carbon to Nitrogen Ratio
CAS Conventional Activated Sludge
CBF Charged Bubble Flotation
CEPT Chemically Enhanced Primary Treatment CHP unit Combined Heat and Power unit
COD Chemical Oxygen Demand
d day(s)
DO Dissolved Oxygen
F/M Food to Microorganisms Ratio
FOG Fats, Oils and Grease
FW Food Waste
h hour(s)
HRAS High-rate Activated Sludge
HRT Hydraulic Retention Time
MF Microfiltration
MLSS Mixed Liquor Suspended Solids
NF Nanofiltration
NOM Natural Organic Matter
OFMW Organic Fraction Municipal Waste
PE Population Equivalent
PEF Primary Effluent Filtration
PV solar energy Photovoltaic Solar Energy
RO Reverse Osmosis
xviii
SRT Solids Retention Time
SVI Sludge Volume Index
TN Total Nitrogen
TOC Total Organic Carbon
TP Total Phosphorus
TSS Total Suspended Solids
UF Ultrafiltration
VSS Volatile Suspended Solids
WRRF Water Resource Recovery Facility
WW Wastewater
WWTP Wastewater Treatment Plant
1
Introduction
Domestic wastewater is a byproduct of the human activities (Mara, 2004). Wastewater is produced everyday around the world and if left untreated, it can negatively affect human health and the environment. Worldwide, the produced wastewater that is collected and receives treatment is approximately 20% (UNESCO, 2012).
The discharge of untreated wastewater leads to water pollution, mainly due to the organic matter and nutrients present. Carbon, the primary constituent of organic matter, can negatively impact the water bodies, as excessive oxidizable organic matter threatens the oxygen concentrations. Additionally, nutrient pollution due to the excess nitrogen and phosphorus is the main driver for the degradation of water quality in Europe (Lema & Suarez, 2017; Sepp et al., 2018).
Water, in quality and in quantity, is promptly declining in a global scale due to population growth, industrial and agricultural development, as well as modifications to the hydrological cycle, as a result of climate change. Water scarcity is presented as a worldwide issue and considered one of the most serious threats to society (Roccaro, 2018). Moreover, global water use over the past hundred years has increased by a factor of six, continuing to increase at a rate of 1% per year (UNESCO, 2018).
According to the International Water Management Institute a substantial amount of world’s population is expected to suffer from water scarcity by 2025 (Eslamian, 2016). Currently two-thirds of world’s population reside in areas that undergo events of water scarcity for at least one month a year. It should be clear that 50% of those affected are from India and China. In countries such as Somalia or Libya 80% to 90% of the population suffers from year round severe water scarcity (UNESCO, 2017).
There are three existent alternative water sources: desalination (if seawater is nearby), water importation and water reuse. The latter is often the least energy-intensive solution (Eslamian, 2016). The interest in the exploit of unconventional water resources has been growing in order to increase the drinking water supplies, as wastewater is composed of approximately 99% water and only 1% of suspended, colloidal and dissolved solids (Lema & Suarez, 2017; UNESCO, 2017). In this respect, wastewater reclamation and reuse is intended to preserve substantial volumes of fresh water by replacing fresh water utilization for non-potable uses, such as agriculture and landscape irrigation, urban cleaning, firefighting, construction, recreational activities, groundwater recharge or surface water replenishment (Meneses et al., 2010).
Wastewater treatment plants are frequently the largest individual energy consumers administered by municipalities (Gu et al., 2017a; Gu et al., 2017b). In a conventional WWTP the total operation costs relative to energy consumption, range from 25% to 40% and in some cases are as high as 65% (Gu, et al., 2017a; Guerrini, Romano, & Indipendenza, 2017). The electric energy demands represent 90% of the total energy consumption (Di Fraia et al., 2018). Nationwide it has been reported that, the WWTP represent 1% of total national electricity consumption in European countries (Di Fraia et al., 2018) and 3% in United States of America (McCarty et al., 2011; U.S.EPA, 2014).
2
Energy recovery, as well as water and resource recovery, in a WWTP represent the new paradigm shift. The goal of achieving energy neutrality in a WWTP is as important as water reuse (Gu et al., 2017a; Gu et al., 2017b). In this regard, WWTP are gradually becoming water resource recovery facilities – WRRF (Papa et al., 2017).
An example of this is Billund Biorefinery, an energy-sufficient treatment plant that receives both wastewater and household waste to provide treatment, while also contributing as a public energy supplier. Marselisborg WWTP is another example of a self-sufficient treatment plant from the Netherlands, that is also an energy provider (Aarhus Vand, 2018; Billund BioRefinery, 2018). When aiming to reach energy neutrality two procedures should be considered: improving energy efficiency (with efficient blowing and mixing systems) and retrieving renewable energy from anaerobic digestion (Mattioli et al., 2017).
The energy recovered via organic matter is the type of energy most easily salvaged in a WWTP. Energy in a WWTP can be obtained via combined heat and power systems (CHP), which utilizes the biogas produced in the anaerobic digestion; biosolids incineration or pyrolysis; effluent hydropower; heat pumps; bioelectrochemical systems; and microalgae technology with the conversion of harvested microalgae to energy (Mo & Zhang, 2013).
In this context, it is here proposed an approach, applied to Espinho WWTP, to move in the direction of energy neutrality and to reduce the operation costs. An analysis to verify the viability of water reclamation is also presented.
Document Structure
This document is structured into 9 chapters.
In the first chapter it is presented an introduction of the problem studied. In the second chapter the objectives of this work are presented.
The third chapter consists of the literature review. This section contains all the scientific publications that sustain this project.
The fourth chapter is the methodology. In this section it is exhibited all the steps and methods conducted during the elaboration of this work.
The fifth chapter comprises the results obtained throughout the development of this study. The sixth chapter purpose is to discuss the results obtained with the results of other scientific studies and with the established objectives.
The seventh chapter consists of the conclusions and limitations of this project.
The eight chapter is the final considerations, in which it is given indications for further investigation.
2
Objective
The objective of this work was to provide a methodology to improve the energy balance of a large WWTP with the purpose of coming closer to reaching energy neutrality in a cost-effective manner. This study intended to investigate the implementation of inexpensive methods to improve the energy balance and reduce the operation costs, while still maintaining adequate treatment. Additionally, it was evaluated the implementation of a method for accomplishing water reclamation for the irrigation of a golf course, which is located near the WWTP.
3
Literature Review
Preliminary Treatment
Raw wastewater before the primary treatment requires physical and mechanical operations to remove as many elements as possible, like heavy floating objects, heavy mineral particles (sand and grit) in order not to hinder future treatment procedures. Preliminary treatment is employed to expunge or diminish the adverse effects of debris that put the functioning of downstream equipment and processes at risk (Borges et al., 2015; Degrémont, 1991; Mara, 2004).
Preliminary treatment operations include the following: ▪ Screening;
▪ Grit removal;
▪ Grease and scum removal.
3.1.1 Screening
Screening is normally the first unit process in a WWTP, with the intent of retaining large solids and coarse materials in the influent wastewater to the treatment plant in order to: prevent damage or clog downstream process equipment, reduce treatment process reliability and effectiveness. The types of screens used in preliminary treatment are coarse and fine screens (Demirbas et al., 2017; Tchobanoglous et al., 2014; U.S. EPA, 2000).
With the ever forward advances in technology, screens are increasingly more reliable. The interest in all types of screens has been renewed, due to the need of more compact WWTP. Screens capacities range from removing settleable solids like grit and primary sludge to refining the effluent from final clarifiers (Qasim, 1999).
Coarse screens are comprised by openings of 6 mm and above, that retain debris like rocks, branches, plastics, bottles, cans, rags. Organic matter is also removed when associated with screenings as the spacing decreases (Tchobanoglous et al., 2014).
Fine screens are comprised by openings of 0.5 mm to 6 mm. This equipment retains smaller materials including putrescible matter (such as fecal material), substantial amounts of grease and scum (Degrémont, 1991; Tchobanoglous et al., 2014). This equipment provides pre-treatment or primary treatment and in general is capable of removing 20% to 35% of BOD5 and suspended solids (Qasim, 1999).
In terms of BOD removal, screens contribution is reduced since the solids retained are usually inorganic and would not be measured in a BOD sample even if they were organic (Alley, 2007). A WWTP will typically remove from 4 to 90 cubic meters of screenings per 106 m3 of influent wastewater (Spellman, 2010). According to Qasim (1999), a screen with a clear spacing of 25 mm produces an average amount of 20 to 36 cubic meters of screenings per million cubic meters of flow.
8
3.1.2 Grit and Scum Removal
In a WWT, grit removal is performed in order to remove non-digestible components from wastewater (Meroney & Sheker, 2003).
Grit consists of sand, gravel, broken glass, cinders and other materials with a settling velocity significantly greater than those of the organic material in wastewater (Davis, 2010; Tchobanoglous et al., 2014).
The process of grit removal is adequate to protect mechanical equipment from abrasion and wear; reduce the formation of heavy deposits in pipelines, aerobic tanks, aerobic digesters, conduits, and channels; and reduce the frequency of digester cleaning due to accumulated grit (Davis, 2010; Meroney & Sheker, 2003; Tchobanoglous et al., 2014).
Grit is removed by settling, more specifically discrete, or Type I, settling. This type of settling occurs when particles settle as individual entities due to low solids concentration (Qasim, 1999). The amount of grit removed depends on: type of collection system (separate or combined); climatic conditions; soil type; condition of sewers and grades; types of industrial wastes; use of garbage grinders; and proximity to sandy bathing beaches in coastal areas (Qasim, 1999). Grit removal is conducted in separate grit chambers like: horizontal-flow grit chambers with rectangular or square configurations; aerated grit chambers; vortex grit chambers (Tchobanoglous et al., 2014).
The removal data of grit is difficult to interpret because this material is poorly characterized and there is little information on its removal efficiencies. The available data comes from what has been collected rather than the actual grit in the influent wastewater (Tchobanoglous et al., 2014). According to Tchobanoglous et al., (2014), horizontal-flow grit chambers with rectangular configurations can remove 100% of the particles retained in a 0.21 mm or 0.15 mm screen; horizontal-flow grit chambers with square configurations can remove approximately 95% of the 0.15 mm diameter particles at peak flow; aerated grit chambers remove close to 100% of the sedimentable grit of the influent wastewater.
An aerated grit chamber offers many advantages over the remaining systems such as: the possibility of also being used for chemical addition, mixing and flocculation before the primary treatment; grease or scum removal if a superficial skimmer is installed; reduction in odors and additional BOD5 removal (Qasim, 1999). Vortex grit chambers provide high performance, while presenting less space requirements (Meroney & Sheker, 2003).
Grit and scum quantity varies from 5 to 200 m3 per 106 m3, average value is 30 m3/106 m3 (Qasim, 1999).
Grit quantities reaching the WWTP differ according to the sewage collection system implemented, as shown in the table 3.1-1.
Table 3.1-1: Quantity of grit removed from wastewater from separate and combined collection systems in aerated grit chambers (Tchobanoglous et al., 2014).
Type of collection system Average grit quantity (m3/1,000 m3)
Separate 0.004-0.037
Primary Treatment
Primary treatment is generally the next step in the treatment process following the removal of coarse solids and grit. Primary treatment is materialized with the primary sedimentation of the influent wastewater, to the WWTP, with the objective of removing readily settleable solids and floating material and consequently reducing the suspended solids content (Qasim, 1999). Primary sedimentation is characterized by flocculent, or type II, settling. This type of settling occurs in somewhat dilute suspensions in which the particles coalesce, or flocculate, increasing particle mass and consequently enhancing the settling velocity rate (Tchobanoglous et al., 2014).
3.2.1 Conventional Primary Sedimentation
Primary sedimentation takes place in a sedimentation tank or clarifier, either rectangular or circular. The sedimentation tanks if efficiently designed and operated, can remove 50 to 70% of the TSS and 25% to 40% of the BOD (Tchobanoglous et al., 2014). In figure 3.2-1 and3.2-2, both types of clarifiers are represented.
12
Figure 3.2-2: Conventional circular clarifier (Voutchkov, 2017).
The factors that influence primary clarifier performance are: surface overflow rate; the influent TSS concentration; the settling characteristics of the settleable solids; the nonsettleable TSS concentration; the soluble COD concentration; and the ratio of particulate COD (or BOD5) to TSS in the primary effluent (Water Environment Federation, 2005).
Tchobanoglous et al., (2014), claims that the detention time is also a major factor for the performance of the sedimentation tank. According to Jover-Smet et al., (2017), the variable that most affects the removal of suspended solids and organic matter is the influent suspended solids load, followed by the surface overflow rate being the second most important.
The design parameters for the primary sedimentation tanks are the detention time or hydraulic retention time and the surface loading rates (or overflow rate), whose information is described in the table 3.2-1.
Table 3.2-1: Design parameters information for primary sedimentation tanks (Tchobanoglous et al., 2014).
Design parameter Unit Range
Detention time h 1.5-2.5
Primary clarifiers are occasionally designed with a shorter detention time of 0.5 to 1 h, resulting in less removal of TSS, when upstream of biological treatment processes (Qasim, 1999; Tchobanoglous et al., 2014).
Other factors that affect sedimentation tank performance are: wind induced circulation cells formed in uncovered tanks; thermal convection currents; thermal stratification in hot, arid climates; cold or warm water causing the formation of density currents. The previously mentioned factors reduce the effective volumetric capacity of the tank, due to the formation of dead spaces. (Tchobanoglous et al., 2014).
The characteristics of the sludge obtained from primary sedimentation are described in table 3.2-2.
Table 3.2-2: Primary sludge characteristics (Tchobanoglous et al., 2014)
Type of sludge Specific gravity Solids concentration
range (%) Primary, medium strength
wastewater
1.03 4-12
Primary, from combined sewer system
1.05 4-12
Primary and waste activated sludge
1.03 2-6
3.2.2 Chemically Enhanced Primary Treatment (CEPT)
The process of chemical precipitation consists in the conversion of soluble substances to insoluble particles, that can be flocculated and separated from the liquid. The removal efficiencies are dependent on the mixing times, mixing type (either mechanical or hydraulic) and the coagulant type and dosage (Ayoub et al., 2017).
With the addition of chemicals for induced precipitation it is feasible to remove 80% to 90% of the TSS including some colloidal particles, 50% to 80% of the COD/BOD (Tchobanoglous et al., 2014), 20% of nitrogen and 95% of phosphorus (Bratby, 2006).
According to Bratby (2006), in Norway typical removal efficiencies reported with CEPT were the following: 73% of COD (370 to 99 mg/L), 81% of BOD (140 to 27 mg/L), 91% of TSS (190 to 17 mg/L), 65% of TOC (70 to 24 mg/L), 28% of TN (37 to 27 mg/L) and 94% of TP (4 to 0.25 mg/L). According to Haydar & Aziz, (2009), CEPT with optimum doses of alum can remove almost all particulate COD and 7 to 28% of soluble COD. Nevertheless, CEPT effluent still presents high concentration of organic matter in its dissolved form.
In table 3.2-3, it is presented a comparison of the removal efficiencies between the conventional primary treatment and the chemically enhanced primary treatment (CEPT).
14
Table 3.2-3: Conventional primary treatment removal efficiency versus CEPT (Tchobanoglous et al., 2014)
Primary treatment processing alternatives
TSS Removal range (%) BOD Removal range (%)
Conventional Primary Treatment
50-70 25-40
Chemically Enhanced Primary Treatment (CEPT)
80-90 50-80
The recommended surface overflow rate for CEPT ranges from 2.8 to 3.4 m3/(m2.h), being almost twice the overflow rate of a conventional primary sedimentation process. CEPT can be designed to perform at an overflow rate of up to 4 m3/(m2.h) without it affecting the effluent quality (Water Environment Federation, 2005).
According to Meerburg et al., (2015) CEPT proceeded by anaerobic digestion of the primary sludge, has been proposed as a candidate technology to achieve energy neutrality in wastewater treatment (Diamantis et al., 2013).
Enhanced primary treatment is essential in energy management at a WWTP, since solids removed in primary treatment, particularly the organic matter, have a high energy value prior to biological conversion to sludge, that is before the oxidation of the organics to CO2. The energy from primary sludge can then be recovered by anaerobic digestion. Adding to this, a higher removal, in the primary treatment, of constituents that exert an oxygen demand means less aeration is required in the secondary treatment and consequently less energy expenditure. Moreover there is less excessive sludge production. (Meerburg et al., 2015; Tchobanoglous et al., 2014; Wan et al., 2016).
CEPT is however not optimized for the removal of dissolved organic matter, limiting the maximum amount that can be recovered, leaving a considerable fraction of organics to be treated in subsequent stages to meet effluent standards (Haydar & Aziz, 2009; Meerburg et al., 2015). The sludge removed from CEPT presents a dry solids concentration that ranges from 0.5 to 3 % (Tchobanoglous et al., 2014).
The most common coagulants used for chemical precipitation are the following: (1) aluminum sulfate; (2) aluminum chloride; (3) calcium hydroxide (lime); (4) ferric chloride; (5) ferric sulfate; (6) ferrous sulfate; and (7) sodium aluminate (Tchobanoglous et al., 2014).
Polyaluminium chloride (PACl) is also presented as an inorganic polymer coagulant which presents advantages over conventional alum and ferric coagulants due to being less sensitive to temperature and pH shifts, working satisfactorily at a pH range of 5 to 8 (Gebbie, 2001). PACl contains highly positive charged polycations, which are very effective in neutralizing negative charges of colloidal particles, resulting in elevated colloidal destabilization (Ng et al., 2013). Moreover PACl is presented as a cheap coagulant alternative (De Feo et al., 2013). PAX 18 is a variant of PACl.
In figure3.2-3, it is displayed the percentage of TP removal in line with the PACl coagulant dose added to a wastewater sample.
Figure 3.2-3: TP removal with PACl (PAX 18 and PAC laboratory made) (Zouboulis & Tzoupanos, 2010)
The coagulant dose required depends on the nature of the wastewater, the pH value, the phosphate level, and the point of injection (Ayoub et al., (2017). As reported by Vesilind (2003), Poon & Chu, (1999) and Tchobanoglous et al., (2014) wastewater characteristics vary and thus the selection of an appropriate coagulant and its chemical dosages should be determined from bench-scale or pilot-scale tests. The typical dosages of coagulant range from 10 to 50 mg/L. As stated by Poon & Chu, (1999) the flocculant dosage, in the form of anionic polyelectrolytes, vary from 0 to 1 mg/L (De Feo et al., 2008) to enhance the floc development.
According to Water Environment Federation (2005), the use of iron salts can decrease the efficiency of downstream disinfection with UV light. Adding to this metal coagulants may generate downstream pH inhibition problems in subsequent biological processes (biological treatment or sludge digestion), since each mg/L of alum potentially decreases the alkalinity by 0.5 mg/L as CaCO3 (Bratby, 2006).
Subsequently an investigation was conducted by a team of Canadian researchers with the use of high polymer dosages (<8 mg/L) and the results with polymer-only coagulation (direct flocculation) were of increased removal of suspended solids, at higher overflow rates, than coagulation with ferric chloride and polymer (Water Environment Federation, 2005). Studies have shown that direct flocculation of organic-based industrial wastewater (e.g. food, paper and pulp, textile effluents) can achieve a removal efficiency of 90 % of COD and TSS (Lee et al., 2014).
3.2.3 High-Rate Clarification
High-rate clarification consists of physical or/and chemical treatment with special flocculation and sedimentation systems to achieve rapid settling. This treatment process can be conducted via ballasted flocculation or lamella plate clarification (Tchobanoglous et al., 2014).
16
High-rate clarification advantages are the following: compact units and thus reduced space requirements; start up times are rapid and peak efficiency can be achieved within 30 minutes; the effluent produced is highly clarified; high overflow rate is attained (Tchobanoglous et al., 2014). Lamella plate clarification consists of a sedimentation process that occurs in a sedimentation basin with lamella plates installed to enhance the settling characteristics by increasing the settling area. Prior to this process there is the addition of chemicals such as coagulants and polymer followed by a three-stage flocculation, via three separate zones with continuously decreasing mixing energy gradient (Tchobanoglous et al., 2014).
The removal efficiencies (BOD5 and TSS) of lamella plate clarification with no prior stage of coagulation/flocculation are similar to those obtained via conventional primary clarifiers, when operating at the same overflow rate based on projected area. The same can be said of lamella plate clarification with previous coagulation/flocculation stage and CEPT (Water Environment Federation, 2005).
Ballasted flocculation consists of a process of flocculation with added coagulant, polymer and a ballasting agent (generally silica microsand) followed by an operation of clarification with either lamella plate settling or conventional gravity clarification. The microsand serves as the nucleus for the attachment of the destabilized solids so the floc particles develop and grow. The microsand applied for wastewater treatment generally ranges from 100 to 150 mm and features a specific gravity greater than 2.6 to enhance settling (Tchobanoglous et al., 2014).
In table 3.2-4, it is presented the efficiency of removal and the overflow rate of the high-rate clarification processes mentioned above.
Table 3.2-4: Parameter efficiencies for high-rate clarification processes (Tchobanoglous et al., 2014)
Process/Parameter Overflow Rate (m3/(m2.d) BOD Removals (%) TSS Removals (%) Lamella Plate Clarification 1200 35-40 65-75 Ballasted Flocculation 1,800-3,500 40-60 40-80
Lamella plate clarification without prior coagulation/flocculation presents an overflow rate of 10 to 15 m/h at peak flow (Water Environment Federation, 2005).
3.2.4 Mechanical Technologies
Given the new paradigm shift of WWTP, in which energy and resource recovery is considered critical, some technologies surface for various primary treatment applications, such as: microscreening of raw wastewater, charged bubble flotation and primary effluent filtration (Tchobanoglous et al., 2014).
Microscreening provides filtration of raw wastewater downstream of coarse solids removal. This equipment can achieve a removal of BOD and TSS ranging from 25% to 35% and 60% to 70%,
respectively, being similar or slightly better than conventional primary sedimentation while possessing a significantly smaller footprint (Tchobanoglous et al., 2014). Some studies demonstrate a TSS removal efficiency higher than 90 % with the addition of chemicals (Ljunggren, 2006).
Multiple publications report the major drawback of microscreening being the clogging of the filter. This problem can be solved with an attentive supervision and correct cleaning procedures (Ljunggren, 2006).
Charged bubble flotation (CBF), used for the treatment of screened raw WW, can replace three unit processes such as: grit removal (except the largest/densest particles), primary clarification and primary scum handling. The CBF process can also be employed as an alternative to CEPT or primary effluent filtration. The CBF is characterized by: a footprint as small as a fifth of the size of a conventional primary clarifier; high solids separation efficiency, being able to handle high concentrations of suspended solids (up to 15,000 mg/L); and low power requirements. This process can achieve a removal of BOD and TSS ranging from 50% to 70% and 70% to 99%, respectively (Tchobanoglous et al., 2014).
Primary effluent filtration (PEF) comprises an effective process of filtration of the primary clarification effluent. This technology can achieve a removal of BOD and TSS ranging from 25% to 35% and 45% to 70%, respectively (Tchobanoglous et al., 2014).
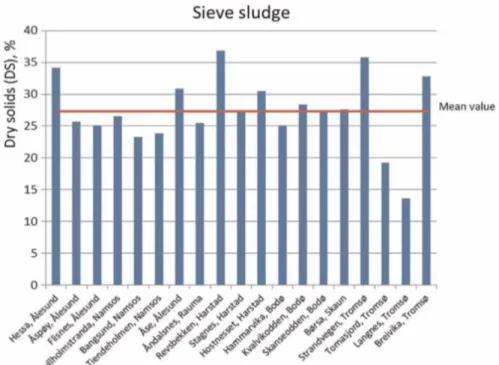
A current promising primary treatment technology, which is already implemented in full-scale WWTP in Norway, is fine mesh sieves.
Paulsrud et al. (2014) conducted a study to compare fine mesh sieves with conventional primary clarifiers. Fine mesh sieve sludges were retrieved from 19 WTTPs in Western and Northern Norway and primary clarifier sludges were acquired from 9 Southern Norway WWTP. In figure 3.2-4,it is presented the fine mesh sieves sludge solids concentration, which can be compared with primary clarifier sludge solids concentration demonstrated in figure 3.2-5.
18
Figure 3.2-4: Fine mesh sieve sludge concentration from various full-scale WWTP (Paulsrud et al., 2014).
Figure 3.2-5: Primary clarifier sludge from several full-scale WTTPs (Paulsrud et al., 2014). Fine mesh sieves revealed a mean sludge solids concentration of 27.3 %, while primary sludge from conventional primary clarifier exhibited a mean value of 2.7 %. Additionally sieve sludge presented higher methane potential, due to higher volatile solids content, via biomethane potential tests (Paulsrud et al., 2014).
Biological Treatment
The biological treatment is commonly the phase downstream of the primary treatment. This phase overall objectives are as follows: oxidize the dissolved and particulate biodegradable constituents into acceptable end products; capture and incorporate the suspended and nonsettleable colloidal solids into biofilm or biological floc; transform or remove nutrients, such as nitrogen and phosphorus, or even specific trace organic constituents and compounds (Tchobanoglous et al., 2014).
The biological treatment via conventional activated sludge reactor, has a low removal efficiency of emerging contaminants such as stimulants (caffeine, nicotine), analgesics (like ibuprofen), pesticides, beta blockers and surfactants (Ahmed et al., 2017).
The removal of dissolved and particulate carbonaceous BOD by oxidation and the stabilization of the organic matter is materialized biologically with microorganisms (bacteria) (Sperling, 2007; Tchobanoglous et al., 2014). Microorganisms provide the biological treatment by feeding off the nutrients present in wastewater, such as carbon, nitrogen and phosphorus. In aerobic treatment, the optimum BOD5:N:P ratio is 100:5:1. Aerobic microorganisms require oxygen (for respiration) to develop their normal functions (Davies, 2005; Forster, 2003).
This process of organic matter removal, relies on microbial metabolic activity and on organic matter adsorption to the surface of microorganisms (Zhang et al., 2014). During this process, microorganisms produce additional biomass which is removed in the downstream process of secondary settling, since biomass specific gravity is slightly greater than that of water (Sperling, 2007; Tchobanoglous et al., 2014). According to Henze et al. (1997) in sludge originated from domestic wastewater, there is: 80 to 120 g of TN per kg of VSS; 10 to 25 kg of TP per kg of VSS (Henze et al., 1997).
3.3.1 Conventional Activated Sludge
Conventional activated sludge (CAS) is the most common suspended growth biological process for municipal wastewater treatment.
The design and operating parameters for the biological treatment system are the F/M ratio, the organic volumetric loading rate and the SRT or sludge age.
There are several methods for the design of the biological reactor and its diverse configurations. The German standard ATV-DVWK is one of the methods used, characterized by being a conservative approach (ATV-DVWK Specialist Committees, 2000).
20
Table 3.3-1: Complete mix activated sludge (CMAS) design criteria (Tchobanoglous et al., 2014). SRT or sludge age d F/M kg BOD/(kg MLVSS.d) Volumetric loading kg BOD/(m3.d) MLSS mg/L HRT h 3-15 0.2-0.6 0.3-1.6 1,500-4,000 3-6
In a WWTP with biological treatment without nitrification, sludge age should not surpass 5 days for an affluent BOD5 load of up to 1,200 kg/d or 4 days for an affluent BOD5 load greater than 6,000 kg/d at 12 °C (ATV-DVWK Specialist Committees, 2000).
The dissolved oxygen (DO) and the oxygen uptake rate in the aeration tank along with the sludge volume index (SVI) and the sludge blanket level in the second clarifier are important operating parameters (ATV-DVWK Specialist Committees, 2000; Tchobanoglous et al., 2014). The SVI and the mixed liquor suspended solids concentration (MLSS) are determinant parameters for the sizing of the biological reactor and secondary settling tanks (ATV-DVWK Specialist Committees, 2000).
Biological reactor or aeration tank (AT) requires aeration to maintain optimal DO concentrations for the development and growth of microorganisms. Do concentration should not be the limiting factor in the biological treatment, therefore DO concentration in the biological reactor should never be inferior to 0.5 mg/L (U.S. EPA & American Society of Civil Engineers (ASCE), 1983). Aeration can be achieved via diffused air aeration or mechanical aeration. For surface slow speed mechanical aerators the oxygen transfer capability ranges from 1.5 to 2.1 kg O2/kWh (Tchobanoglous et al., 2014).
The biological reactor is followed by a secondary clarifier, which is designed to satisfy the parameters shown in table 3.3-2.
Table 3.3-2: Design parameters information for secondary sedimentation tanks (Tchobanoglous et al., 2014).
Design parameter Unit Range
Detention time h 1.5-2.0
Overflow rate m3/(m2.h) 0.8-1.2
3.3.2 Membrane Bioreactor
Membrane Bioreactors (MBR) constitute an alternative to CAS system, that does not require a secondary sedimentation basin since secondary clarification occurs via membrane separation. MBR presents different configurations in terms of materials and pore sizes. The standard configurations are with ultrafiltration hollow-fiber and microfiltration flat plate. Other membrane configurations are nanofiltration (NF) or reverse osmosis (RO) (Arévalo et al., 2012; Judd, 2010). MBRs do not portray only advantages. This technology is less sustainable than CAS, presenting higher energy consumption as well as elevated operation costs. WWTP in the Netherlands have
been switching their MBR installations into CAS due to its costs and energy consumption: 0.26 €/m3 (58% higher than that of single CAS) and 0.77 kWh/m3 (114% higher). This technology, however, can be advantageous considering stringent discharge permit limits or space restrictions (Hao et al., 2018; Judd, 2010).
Sludge Thickening
Thickening is a process conducted to increase the solids content of the sludge by eliminating part of its liquid fraction. It is characterized by being a physical procedure and occurs by co-settling, settling, flotation, centrifugation and drainage (by a gravity belt or a rotary drum screen thickener) (Degrémont, 1991; Tchobanoglous et al., 2014).
Gravity thickeners are designed for:
1. Overflow rate of: 15.5 to 31 m3/(m2.d) for primary sludge; 4 to 8 m3/(m2.d) for waste activated sludge; and 6 to 12 m3/(m2.d) for combined sludge (Qasim, 1999).
2. Solids capture of: 85 to 98 % for primary sludge; 60 to 85 % for waste activated sludge; and 85 to 92 % for combined sludge. (Qasim, 1999)
3. Solids Loading (table 3.4-1).
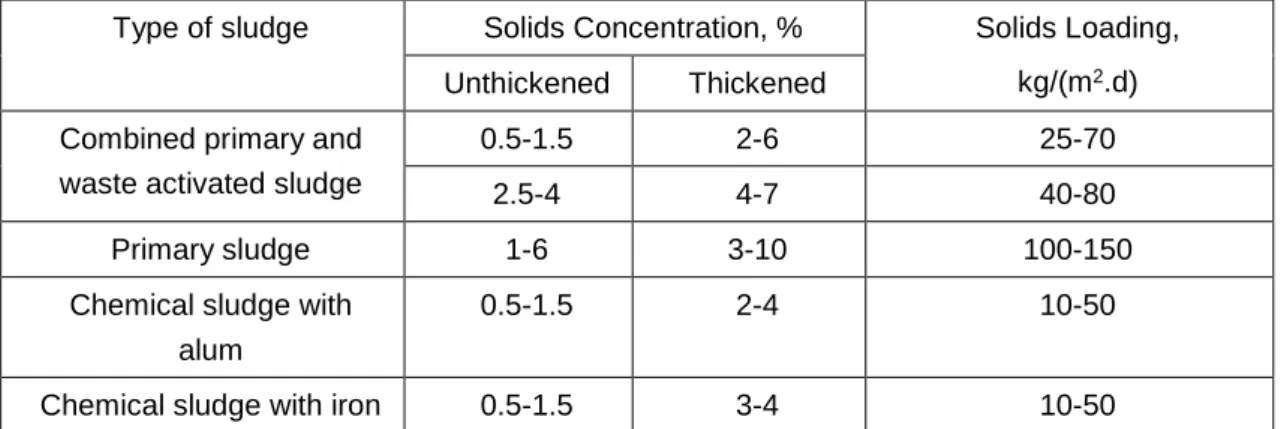
In the next table it is presented the sludge solids concentration that results from a gravity thickener, as well as the solids loading for design purposes.
Table 3.4-1: Typical solids concentration of sludges and solids loading for gravity thickeners (Water Environment Federation, 2011).
Type of sludge Solids Concentration, % Solids Loading, kg/(m2.d) Unthickened Thickened
Combined primary and waste activated sludge
0.5-1.5 2-6 25-70
2.5-4 4-7 40-80
Primary sludge 1-6 3-10 100-150
Chemical sludge with alum
0.5-1.5 2-4 10-50
Chemical sludge with iron 0.5-1.5 3-4 10-50
As shown in table 3.4-1, waste activated sludge, as well as, chemical sludge do not thicken with ease by gravity. For these types of sludge, thickening via dissolved air flotation (DAF) or mechanical thickening are considered more appropriate (Water Environment Federation, 2005). Mechanical thickeners, in comparison with gravity thickeners, require higher energy costs and maintenance, but allow for a superior thickening of the sludge. Mechanical equipment is eligible when space is a limitation (Qasim, 1999).
Thickening reduces sludge volume which consequently lessens further sludge processing costs. This ensues a smaller digestion volume required as well as diminished heating necessities and less volume of sludge for disposal (Puchajda & Oleszkiewicz, 2008).
Anaerobic Digestion
Anaerobic digestion main objective is to provide sludge stabilization and volatile solid destruction to reduce pathogens, eliminate and inhibit offensive odors and reduce or eliminate the potential for putrefaction (Cao & Pawłowski, 2012).
In domestic wastewater between 60 to 80 % of the total suspended solids (TSS) are volatile suspended solids (VSS) (Henze et al., 1997). A conventional anaerobic digester can achieve a reduction in total volatile solids in the range of 50% to 60% (Qasim, 1999). VSS destruction is critical for the reduction of sludge volume, which consequently decreases the cost of disposal (Arnaiz et al., 2006).
The Water Environment Federation suggests a formula to calculate the maximum VS destruction percentage value, depending on the hydraulic retention time (Water Environment Federation et al., 2012). The WEF formula is the following:
VS destruction (%) = 13.7 × ln(HRT) + 18.9
During anaerobic digestion, four chemical and biochemical reactions occur: hydrolysis, acidogenesis, acetogenesis and methanogenesis. This process is developed in the absence of oxygen resulting in the decomposition of organic matter and in the reduction of inorganic matter with the end products being stabilized sludge and the production of methane gas and carbon dioxide (Tchobanoglous et al., 2014). Hydrolysis is usually the rate limiting phase (Appels et al., 2008).
26
In the figure3.5-1, the anaerobic digestion reactions are represented by sequential order.
Figure 3.5-1: Anaerobic digestion reactions (Appels et al., 2008).
The typical biogas production in anaerobic digesters ranges from 0.8 to 1.1 m3/kg volatile solids destroyed (Water Environment Federation. et al., 2012).
The biogas produced can be utilized to produce thermal and electrical energy in a cogeneration unit, as its composition in methane ranges from 60 to 65% (Tchobanoglous et al., 2014).
Pre-treatment can be ensued in order to make organic matter more responsive to utilization by acidogens and methanogens (Li & Yu, 2016). Biological pre-treatment is conducted by enhancing the hydrolysis process in an additional stage before the main digestion. A thermophilic pre-treatment (2 days of HRT) in comparison with a mesophilic pre-pre-treatment was studied prior to mesophilic anaerobic digestion revealing an increase on methane production and solids destruction of 25 % (Carrère et al., 2010; Kalogo & Monteith, 2013).
Thermal hydrolysis (temperatures over 100 ºC) has proved to be successful as pre-treatment techniques. According to Pilli et al., (2015), via lab scale studies, the optimum pre-treatment conditions for enhanced biogas production are 160 to 180 ºC for 30 to 60 minutes. Full-scale studies demonstrated that high temperature pre-treatment reduce sludge volume and increase biogas production and sludge dewaterability. At temperatures over 190 ºC, biogas production decreases due to the formation of toxic refractory compounds, that decrease sludge biodegradability (Pilli et al., 2015).
Ozonation, sonication and mechanical shear are also presented as pre-treatment techniques that cause sludge disintegration resulting in an increase of the bioavailability of the sludge being
digested (Carrère et al., 2010; Kalogo & Monteith, 2013; Water Environment Federation. et al., 2012).
According to Tchobanoglous et al. (2014), Lettinga (1995) and Water Environment Federation et al. (2012), the factors that determine optimal conditions of the process are the following:
1. SRT and HRT, being directly proportional to the extent of each reaction. Sufficient residence time allows the bacteria to grow enabling the process of digestion and the destruction of VSS.
In table 3.5-1, it is presented the design SRT values, which are the same as HRT for complete-mix digesters (Tchobanoglous et al., 2014), and the operating temperature of the reactor.
Table 3.5-1: suggested SRT for mesophilic complete-mix anaerobic digesters (Tchobanoglous et al., 2014) Operating Temperature (ºC) Minimum SRT (d) Design SRT (d) 18 11 28 24 8 20 30 6 14 35 4 10 40 4 10
In practice for a complete-mix mesophilic digester SRT values generally range from 15 to 20 days, providing adequate solids stabilization (Qasim, 1999). Although, SRT values of 10 days are sufficient to ensure the methanogenic population doesn’t suffer from washout, SRT values above 15 days show relatively small incremental changes in volatile solids destruction.
1. Temperature, responsible for determining the rate of digestion, especially the rate of hydrolysis and methanogenesis. Mesophilic digesters operate between 30 to 35ºC, while thermophilic digesters operate in the range of 50 to 57ºC. Thermophilic digestion is characterized by being advantageous, having an increased efficiency and improved dewatering (Qasim, 1999).
Maintaining stable temperatures is crucial for the bacteria, particularly the bacteria responsible for the production of methane. Temperature variation greater than 1ºC/d in sludge temperature affects performance.
2. Volatile solids (VS) loading for sustained conditions should be in the range of: 3.2 to 6.4 kg VS/(m3.d) for thermophilic anaerobic digestion; 1.6 to 2.4 kg VS/(m3.d) for mesophilic anaerobic digestion.
3. Alkalinity, used to monitor the health of the digestion process via the ratio of volatile acids to alkalinity, which should be in between 0.05 to 0.25. Volatile acids and carbon dioxide consume alkalinity, a well-established digester has a total alkalinity of 2000 to 5000 mg/L.
28
4. pH, should be maintained at 6.8 to 7.8 for the occurrence of stable methanogenic activity. If the pH drops below 6 the methane formation ceases (Qasim, 1999).
5. Presence of inhibitory substances, which disrupt the process of digestion. These substances are certain heavy metals, high nitrogen concentration from ammonia, chlorinated organic compounds, amino acids and industrial chemical products.
6. Bioavailability of nutrients and trace metals, which enhance biological growth and consequently improve the process of digestion.
Another criterion for adequate operation of the AD process is mixing. This aspect is critical to provide even distribution of microorganisms, organic matter, inoculation of fresh feed, temperature and the homogenization of the sludge inside the reactor (Lindmark et al., 2014). Mixing can be achieved by mechanical mixing (via propellers and agitators), hydraulic mixing (by recirculation of AD sludge) or pneumatic mixing (by pumping biogas to the bottom of the reactor, promoting the mixing of its contents as the bubbles ascend to the surface). Mechanical mixing is usually the most power efficient (Lindmark et al., 2014).
Sludge Dewatering
Dewatering consists of a physical unit operation that separates solid matter of sludge or biosolids from water. This process produces a high solids content stream called “cake” and a liquid stream designated as centrate (Tchobanoglous et al., 2014). Dewatering achieves a superior volume reduction than that attained with thickening, resulting in posterior reduced costs of handling and of management of the sludge. Dewatering processes lead to sludge solids concentration from 4 to 20 % (Turovskiy & Mathai, 2006).
Municipal WWTP sludge generally presents a negative value of zeta potential, meaning sludge particles are negatively charged resulting in its electrostatic repulsion and inhibiting particle aggregation. The addition of correct dosages of cationic polymers or inorganic flocculants (at a suitable pH) promote charge neutralization, eliminating the electrostatic repulsion and encouraging particle aggregation (Tuan et al., 2012). Conditioning of the sludge is most commonly materialized with coagulation of colloids (Novak, 2006).
Sludge chemical conditioning is usually via polyelectrolytes, Fe, Al or lime to promote floc development and consequent improved dewaterability (Chen et al., 2006). Typical chemical conditioning doses of ferric chloride and lime for anaerobically digested sludge range from 30 to 50 kg/1,000 kg and 100 to 130 kg/1,000 kg of dry solids respectively. These inorganic chemicals increase sludge mass by 15 to 30 %, increasing disposal costs and the sludge presents less fuel value for incineration. Conversely polymers do not increase sludge mass nor reduce sludge energy potential for incineration and can be dosed in much lower quantities (Krishnamurthy & Viraraghavan, 2005; Novak, 2006; Sharma & Sanghi, 2013). Polymer doses are based on the centrate clarity obtained, being dependent on sludge type, polymer type and equipment type. In-situ empirical tests are critical for the determination of the optimum dose (Murthy et al., 2004). The use of inorganic polymers in the dewatering process results in sludge with 2 to 5 % higher solids content in comparison with organic polymers (Andreoli et al., 2007).
Thermal conditioning is another possible method (Chen et al., 2006). Moreover, acoustic conditioning with ultrasounds via ultrasonic vibrations and magnetic conditioning are reported as promising technologies (Sharma & Sanghi, 2013).
Sea water intrusion can result in lower dewaterability of the sludge. Additionally sludge storage, or elevated residence time, in the anaerobic digester lowers posterior dewaterability as flocs disintegrate and conductivity increases (Christensen et al., 2015; Tuan et al., 2012).
The criteria for the selection of the dewatering equipment is (Water Environment Federation, 2008):
• Type and quality of the sludge (concentration of the feed sludge);
• Mode of operation (continuous, discontinuous and capable working hours per day); • Polymer cost (dose required and unit price);
• Cost of sludge disposal or downstream processing;
• Cost of recycle (relative to the capture of solids performance of the equipment);
• Feed rate, as in solids loading mass of dry solids per hour and hydraulic loading to take profit of the maximum throughput of the equipment installed.
30
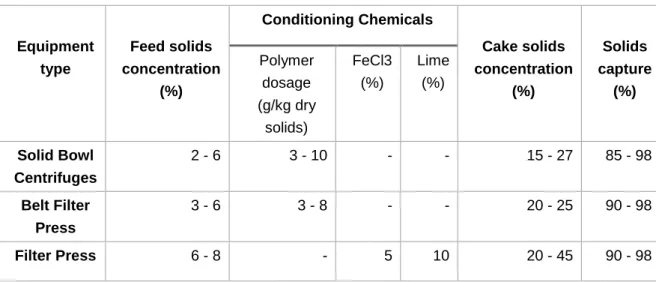
In the table 3.6-1, it is represented the performance of most common dewatering equipment.
Table 3.6-1: Performance data of dewatering technology for anaerobically digested sludge (Primary + WAS) (Turovskiy & Mathai, 2006).
Equipment type Feed solids concentration (%) Conditioning Chemicals Cake solids concentration (%) Solids capture (%) Polymer dosage (g/kg dry solids) FeCl3 (%) Lime (%) Solid Bowl Centrifuges 2 - 6 3 - 10 - - 15 - 27 85 - 98 Belt Filter Press 3 - 6 3 - 8 - - 20 - 25 90 - 98 Filter Press 6 - 8 - 5 10 20 - 45 90 - 98
The mechanical dewatering equipment that produces a higher solids content cake is the filter press, followed by centrifuges and belt presses. The filter press operates in a discontinuous manner (working in cycles of 3 to 6 h) and provides a cake 6 to 10 % dryer (Andreoli et al., 2007). The most common equipment are centrifuges and belt filter presses. Centrifuges in comparison with belt filter presses present a simple, confined compact process with a more efficient odor control, less frequent cleaning requirements and lower water consumption (Cheremisinoff, 2002). Belt filter presses portray a lower capital cost, lower power consumption, are quieter and aren’t deemed of expert maintenance. However, centrifuges often achieve a higher sludge cake solids concentration at a lower polymer consumption rate (Mamais et al., 2009).
In the table 3.6-2 and 3.6-3, it is represented the total annual costs of the dewatering process via belt filter press and centrifuge in the WWTP of Volos and Lavrio, Greece. The WWTP of Volos is a medium to large size plant with 130,000 PE (population equivalent), while the WWTP of Lavrio is a small to medium facility with 10,000 PE.
Table 3.6-2: Annual sludge dewatering total costs of a medium – large sized WWTP (capital, operation and maintenance) of Volos WWTP in Greece (Mamais et al., 2009).
Annual costs €/y
Belt Filter Press Decanter Centrifuge 50 h/week 100 h/week 50 h/week 100 h/week
Capital cost 11,583 23,167 15,959 31,918 Chemicals/Reagents 257,242 257,242 195,149 195,149 Water consumption 22,176 22,176 53 53 Power 2,883 2,883 14,256 14,256 Labor 47,520 23,760 23,760 11,880 Maintenance 4,500 7,700 3,100 6,200 Centrate/filtrate treatment 23,319 23,319 6,088 6,088 Sludge disposal 105,600 100,800 105,600 100,800 Total Cost 474,823 465,846 359,165 366,403
Total Cost per ton of sludge 108 106 82 84
Table 3.6-3: Annual sludge dewatering total costs of a small – medium sized WWTP (capital, operation and maintenance) of Lavrio WWTP in Greece (Mamais et al., 2009).
Annual costs €/y
Belt Filter Press Decanter Centrifuge
30 h/week 30 h/week Capital cost 5,457 11,120 Chemicals/Reagents 35,171 26,522 Water consumption 4,752 53 Power 675 2,851 Labor 14,256 7,128 Maintenance 1,060 2,500 Centrate/filtrate treatment 5,366 1,378 Sludge disposal 16,958 13,104 Total cost 83,695 64,657 Total cost per ton of sludge 147 114
At an economic standpoint the long-term analysis proves that centrifuges have lower overall life cycle costs, despite having an higher capital cost (Mamais et al., 2009).