1 The impact of CEO overconfidence on firm innovation performance and the moderating effect of firm specific factors within the pharmaceutical industry
Sander Kloosterman
Degree: International MSc. Management Universidade Nova de Lisboa School of Business and Economics
Supervisor: Luis Filipe Lages Lisbon, 4th January 2019
2 This page has been intentionally left blank
Figure 4 - Moderation Analysis Firm GrowthThis page has been intentionally left
3 ABSTRACT
The influence of overconfident CEOs on their firms, and more particularly the level of innovativeness of the firm is gaining more attention in the current complex business environment. In addition, the ways in which CEO personality traits influence organisational outcomes are of interest to several disciplines, as is reflected in the research available.
Using several regression models, this thesis examines the moderating impact of three firm-specific factors (organisational slack, firm leverage and firm growth) on the relationship between CEO overconfidence and firm innovation performance. The study includes data from 2011-2016 of 85 different firms within the global pharmaceutical industry, resulting in 479 firm year observations.
Results show that the initial positive relationship between CEO overconfidence and firm innovation performance is not supported (H1). Despite this insignificant outcome, the findings suggest a positive moderating effect of organisational slack (H2) on the relationship between CEO overconfidence and firm innovation performance. No moderating effect could be established for firm leverage (H3) or firm growth (H4) on the relationship between CEO overconfidence and firm innovation performance, preventing us from drawing any further inferences.
Based on this research, firms are recommended to set sensible targets for organisational slack as this allows for appropriate funding of innovative projects which can have both significant direct and indirect effects on the innovation performance of a firm.
Keywords: CEO Overconfidence, Firm Innovation Performance, Organisational Slack, Firm Leverage, Firm Growth, Upper Echelon Theory
4 ACKNOWLEDGEMENTS
I would like to express my sincere gratitude to my supervisor Luis Filipe Lages of the School of Business and Economics at Universidade Nova de Lisboa. Furthermore, I would like to thank my fellow MSc companion Nick Giesbers for the many fruitful discussions on the topic, the data collection as well as the ability to bounce ideas off one another. In addition, I would like to thank Karim Haddad for the past 6 years of endless study nights and friendship.
Finally, I would like to thank my parents and sister for providing me with support and continuous encouragement throughout my years of study and through the process of researching and writing this thesis. They have all contributed to a caring environment which enabled me to achieve this major accomplishment. Thank you.
5 TABLE OF CONTENTS
ABSTRACT ... 3
ACKNOWLEDGEMENTS ... 4
TABLE OF CONTENTS ... 5
LIST OF FIGURES & TABLES ... 6
1. INTRODUCTION ... 7
2. LITERATURE REVIEW & HYPOTHESES DEVELOPMENT ... 11
2.1 Upper Echelon Theory ... 11
2.2 CEO Overconfidence & Firm Innovation Performance ... 12
2.3 Firm Specific Factor – Organisational Slack ... 14
2.4 Firm Specific Factor – Firm Leverage ... 16
2.5 Firm Specific Factor – Firm Growth ... 18
3. METHODOLOGY ... 19
3.1 Data & Sources ... 19
3.2 Sample and Procedure ... 20
3.3 Measures ... 21
3.4 Analytical analysis ... 25
4. RESULTS ... 26
4.1 Descriptive statistics & Bivariate Correlations ... 26
4.2 Hypotheses analysis ... 28
4.3 Simple Linear Regression Analysis ... 29
4.4 Simple Moderation Analysis ... 31
5. DISCUSSION ... 33
5.1 General Discussion and Findings ... 33
5.2 Theoretical contribution ... 37
5.3 Managerial contribution ... 38
5.4 Limitations & Future Research ... 39
6. CONCLUSION ... 42
REFERENCES ... 44
6 LIST OF FIGURES & TABLES
LIST OF FIGURES
Figure 1 - The proposed conceptual model ... 10
Figure 2 - Moderation analysis organisational slack ... 31
Figure 3 - Moderation analysis firm growth ... 31
Figure 4 - Moderation analysis firm leverage ... 31
Figure 5 - Interaction effect organisational slack ... 34
LIST OF TABLES Table 1 - Descriptive statistics & bivariate correlations ... 26
Table 2 - Regression results for OLS control regression & hypothesis 1 ... 29
Table 3 - Regression results for firm factors ... 31
7
1. INTRODUCTION
Every firm, irrespective of its business, is making strategic decisions on a continuous basis. These decisions are ultimately made by the Chief Executive Officer, hereafter CEO, as he leads the firm. For this reason, many researchers have taken it upon themselves to decipher the impact which CEOs have on their respective firms. Ground-breaking research by Hambrick & Mason (1984) modelled the Upper Echelon Theory, hereafter UET, which notes that organisational outcomes can be partially predicted by the actions of their managers. This theory is becoming increasingly relevant as the tasks of CEOs are becoming more complex and thus having the right CEO is becoming more critical. Hambrick (2007) has shown that CEO characteristics in terms of their experience, values and personalities affect their interpretation of situations and, in turn, their decision making. Moreover, Finkelstein, Hambrick & Cannella (2009) mention that the influence that CEOs have within their firm enables them to have a direct impact on the organisational outcomes.
The results of the actions of CEOs are not the sole predictor of the outcome of a firm, however they can determine part of the outcome. In order to identify how the decisions of a CEO come about, it is important to identify what behavioural traits influence the decision-making process of a CEO. The literature review on the behavioural traits of CEOs indicate that psychological biases such as overconfidence play a very important role (Galasso & Simcoe, 2010; Hirshleifer, Low & Teoh, 2012; Malmendier & Tate, 2005a). Overconfidence can be expressed in many different forms, such as being narcissistic (Chatterjee & Hambrick, 2011), but ultimately boils down to the tendency to overestimate one’s own ability to perform a task (Hiller & Hambrick, 2005). Miller and Ross (1975) show that this tendency to overestimate one’s own ability stems from a self-serving attribution bias. Individuals associate their successes with personal skill whilst failure is perceived to be due to back luck or poor timing.
8 This phenomenon is further reflected upon by Kahneman and Tversky (1974) as they found that humans systematically make choices that defy clear logic due to their “cognitive biases”. Moreover, Kahneman (2011) sees overconfidence as the most significant human bias. Overconfidence is examined extensively in the field of social psychology (Svenson, 1981). Besides rating oneself higher as shown by Svenson (1981), overconfidence gives CEOs an illusion of total control through which they believe that failure can be avoided (Langer, 1975). This all results in the presumption that the level of overconfidence of a CEO has an impact on the outcome of his/her respective firm (Gervais, Heaton & Odean, 2003).
One of the firm outcomes which is expected to be affected by CEO overconfidence is the level of innovativeness within a firm, supported by extensive literature review. The level of innovation performance is becoming more crucial now than ever as trends of globalisation, faster product life cycles and global competition make firms more dependent on being innovative. The basis of being successful and having a competitive advantage lies in being able to be one step ahead of competition (Cardinal, 2001). Therefore, to stay competitive, CEOs need to prompt their firms to be innovative (Galasso and Simcoe, 2011). Furthermore, the strength of the relationship between CEO overconfidence and firm innovation performance will depend on several factors, both on an internal firm-level as well as external environmental factors (Barker III & Mueller, 2002). For the actions of a CEO to be effective in terms of positively impacting firm innovativeness, it is important that several firm-specific factors are being taken into account. These factors can either act as a catalyst or hinder the impact that CEO overconfidence has on firm innovation performance. From the literature review, three main factors have been identified as important and are taken into account as they each encompass different parts of a firm’s composition.
Firstly, organisational slack is considered a highly important source for the funding of innovation (Herold, Jayaraman & Narayanaswamy, 2006). As organisational slack reflects the
9 resources available, it allows CEOs to manage their additional investments (Herold et al., 2006). This is expected to allow overconfident CEOs to more effectively impact operations and foster innovative practices.
Secondly, firm leverage is expected to have a significant negative impact on firm innovation performance. In addition to the amount of resources available, it is important to investigate how current operations are being funded, either through debt (loans) or equity as this gives an indication of the opportunity for CEOs to innovate (Savignac, 2008). High levels of debt reduce the borrowing capacity of a firm resulting in the possibility of the firm not being able to gain sufficient external funds for future innovative activities (Bourgeois III, 1996). Likewise, high levels of debt are linked to high levels of financial risk which may result in fewer opportunities to innovate (Savignac, 2008).
Thirdly, firm growth has a significant positive impact on firm innovation performance. Scholars recognize a clear positive relationship between firm growth and innovation (Demirel & Mazzucato, 2012). They further establish that slow growth will result in fewer resources being available. This lower amount of resources will decrease the ability of a firm to be innovative and therefore the opportunity for overconfident CEOs to steer innovation. From this we can see that firm growth can positively impact the relationship between CEO overconfidence on firm innovation performance.
All three firm specific factors are expected to have an impact on the relationship between CEO overconfidence and firm innovation performance and therefore will be explored further throughout this thesis. The proposed relationships are displayed in Figure 1.
10 The research question of this thesis is therefore two-fold. First, it questions the following: “Does CEO overconfidence impact the level of firm innovation performance?”. Furthermore, it tries to fill the current gap in literature, by posing the following question: “Do differences in firm-specific factors (organisational slack, firm leverage and firm growth) have a moderating effect on the relationship between CEO overconfidence and firm innovation performance?”. The research is specifically focused on the global pharmaceutical industry as firms within this industry focus heavily on innovation in order to survive and therefore the impact of the actions of a CEO on firm innovation is expected to be more explicit (Cardinal, 2001; Li & Tang, 2010).
The structure of the thesis is as follows. Firstly, this thesis reviews current literature to gain a comprehensive understanding of what has been explored by previous scholars up till now. The second section describes the research design as well as methodology, stating what statistical analysis needs to be done to answer the hypotheses appropriately. Next, the results section which in addition includes a discussion of the results addressing the implications, both theoretical and managerial, as well as describing the limitations of the study and potential areas for further research. Finally, the last section provides overall conclusions encompassing all outcomes.
CEO Overconfidence Firm Innovation Performance Organizational Slack H2 ( + )
Firm Leverage H3 ( - )
Firm Growth H4 ( + )
H1 ( + )
11 2. LITERATURE REVIEW & HYPOTHESES DEVELOPMENT
This section provides a review of the current literature with regards to all topics which need to be explored as a prerequisite to answer the research gap. First, the Upper Echelon Theory is explored after which all prior literature is analysed in order to develop all hypotheses.
2.1 Upper Echelon Theory
CEOs have a large variety of tasks and responsibilities such as the making of major strategic decisions, managing daily operations and the allocation of the firm’s resources. Not all firms have allocated their CEOs the same amount of power. Some allow their CEO to make strategic decisions on their own whilst other firms have a more refined decision-making process in place in which a board of directors is actively involved in the decision-making process.
In recent years, scholars have paid a great deal of attention to the impact a CEO has on his/her respective firm. A ground-breaking organisational study is the Upper Echelon Theory conducted by Hambrick and Mason (1984) which states that organisational outcomes may be partially predicted by the behavioural traits of managers. The notion that personality traits influence firm outcomes sparked a large interest among scholars from both psychological as well as managerial disciplines. To examine the impact of CEOs characteristics on firm performance, it is relevant to compare CEOs in similar firms but with different performance levels. Mackey (2008) shows that a CEO significantly impacts firm performance by examining the variance in firm performance in homogeneous (similar) firms, reinforcing Hambrick’s observations.
Hambrick (2007) further explores under what circumstances the level of impact that managers have is the highest. Managerial discretion is found to play a large role in this. Within the management discipline, managerial discretion refers to the absence of constraints and the opportunity for managers to pursue organisational goals (Hambrick & Finkelstein, 1987).
12 When high managerial discretion exists, i.e. no constraints on CEO choices, the impact of their actions will be significantly stronger (Hambrick, 2007). Furthermore, low levels of support for CEOs in combination with high levels of complexity in the tasks at hand result in unilateral CEO decisions, which could have a large impact on the firm outcomes. This is due to the fact that when a task is highly complex it is likely that managers will revert back to their old ways of work which are shaped by their own behavioural traits (Hambrick, 2007). Moreover, as the environment in which managers operate is complex, there is no clear frame of control or comparison ability by firms on managers (Alicke, 1985; Moore & Kim, 2003). As no comparison can be made, it allows for CEOs to leave their own mark on a firm, once again reinforcing the UET (Finkelstein & Hambrick, 1996).
2.2 CEO Overconfidence & Firm Innovation Performance
After having established the influence of managers on firm outcomes, it is important to identify what behavioural traits have an influence on these managers. When reviewing the many behavioural traits, it is clear that overconfidence has gotten a lot of academic attention (Galasso & Simcoe, 2010; Hirshleifer et al., 2012; Malmendier & Tate, 2005a). Overconfidence can be expressed in many different forms, such as being narcissistic (Chatterjee & Hambrick, 2011), but all ultimately boils down to the tendency to overestimate one’s own ability to perform a task (Hiller & Hambrick, 2005). This phenomenon has been widely examined in the field of social psychology. Kahneman and Tversky (1974) show that humans systematically make choices that defy clear logic due to their cognitive biases, i.e. by perceiving the information wrong. This is further examined in the field of behavioural finance where the neoclassical view of an individual who makes rational decisions, is replaced by an individual in which psychology may influence decision making. Svenson (1981) clearly shows how individuals can overestimate their own ability as he conducted a study which resulted in a world in which
13 82% of all driving humans rate them amounts the 30% top drivers, a statement which clearly cannot hold. Besides overconfidence having a profound impact on the self-assessment of CEOs, it also makes them underestimate the potential of failure. Overconfident CEOs have the illusion of control and believe that the outcome of their strategic choices can be steered, and failure can be avoided resulting in more risk being taken (Langer, 1975).
Overconfidence though cannot just be characterized as either a positive or negative characteristic of a CEO. On the one hand, overconfident managers will have a higher likelihood to be promoted to CEO (Goel & Thakor, 2008) which implies that overconfidence can be beneficial for one’s career path. However, Goel & Thakor (2008) on the other hand also show in the same article that there is a clear indication that excessively overconfident CEOs are more likely to be fired than moderately confident or shy CEOs.
When looking further into the impact of overconfidence on CEOs it is clear that if there is less fear of failure, forecasting is more optimistic (Hribar & Yang, 2016). This over optimism leads to CEOs misjudging the potential in the market as well as the returns of a firm’s own projects. Firms that have overconfident CEOs tend to follow more aggressive corporate policies which translates into relatively higher investment ratios (Ben-David, Graham & Harvey, 2013). Furthermore, overconfident CEOs do not improve or adjust their forecasts after receiving feedback as they are less prone to corrective feedback due to their self-belief, therefore disregarding any feedback (Chen, Crossland & Luo, 2015). All things considered, the above-mentioned impact of overconfidence on a CEO shows that having an overconfident CEO has both positive as well as negative consequences for a firm’s performance (Chen et al., 2015).
One aspect of firm performance that is particularly affected by CEO overconfidence is the level of firm innovation performance. This is due to the fact that as the level of fear of failure for overconfident CEOs is less (Hribar & Yang, 2016). This is combination with their
14 more optimistic forecasting results in overconfident CEOs having a stronger inclination to invest in innovation projects (Langer, 1975).
When considering the impact that CEO overconfidence has on firm innovative performance, it can be observed that overconfidence impacts the perception of project success. CEOs are more optimistic about the outcome and thus more willing to invest in innovative projects. This lower fear of failure is a crucial factor by which a positive relationship between CEO overconfidence and firm innovation performance stands (Galasso & Simcoe, 2011). More evidence of this positive relationship can be found in the research done by Hirshleifer et al. (2012) in which not only a higher amount of patent citations is found with more overconfident CEOs but also a higher amount of innovation input and success for given R&D expenditures. Barker III and Muller (2002) have further delved into analysing whether this is truly due to the characteristics of CEOs by comparing firms within the same industries. When accounting for corporate strategy, firm structure and firm size, it is clear that the characteristics of individual CEOs change the innovation within a firm (Barker III & Mueller, 2002; Coad, Segarra & Teruel, 2016). Following the above reasoning, it could be argued that CEO overconfidence has a positive effect on firm innovation performance which forms the basis for hypothesis 1:
Hypothesis 1: CEO overconfidence has a positive effect on firm innovation performance
2.3 Firm Specific Factor – Organisational Slack
After having established the positive relationship between CEO overconfidence and firm innovation performance (Hypothesis 1), it is important to elaborate on several firm specific factors that may strengthen or weakens this relationship. First of all, Coad et al. (2016) show that several factors such as firm structure and size need to be accounted for as these have a proven direct influence on the level of innovation. Besides these factors, it is important for
15 managers of firms to determine how to gain a competitive advantage. In order to do so, a resource-based view is taken which allows CEOs to highlight new strategic opportunities (Wernerfelt, 1984). This framework helps CEOs to achieve sustainable competitive advantage and determine what resources are needed in order to gain an advantage. When defining what resources are already available to create a sustainable competitive advantage, it is important to look at a firm’s level of organisational slack. According to Pan, Wei & Al-Hakim (2016) organisational slack is defined as
“a reference to the resources available to the firm above the resources necessary to
achieve immediate business and operational requirements. It is usually assessed in
terms of financial resources. Organisational slack is considered as the important
source for funding innovation.” (p. 588)
By looking at organisational slack, managers are able to determine what resources are available for funding innovation (Nohria & Gulati, 1997). This allows CEOs to justify their strategic choices (Bourgeois III, 1996). Moreover, O’Brien (2003) recognises that when a firm does not take its amount of slack into account it results in a poor performing firm, as the firm does not realise how many resources can be allocated towards new projects, resulting in either investing too much or too little. All arguments mentioned above recognise organisational slack as a positive factor, however some scholars disagree. Research by Herold et al. (2006), suggests that as more opportunities arise, there is no control over what is being invested in which results in wasteful investments and therefore negatively affect the innovativeness of a firm. Likewise, high organisational slack could promote inertia within the firm, reducing the urge to be innovative (Baker & Nelson, 2005).
Still, most literature studies see organisational slack as an important factor in enhancing the level of innovativeness of a firm (Nohria & Gulati, 1997; O’Brien, 2003). Damanpour
16 (1991) suggests that high levels of organisational slack result in managers being larger risk-takers and therefore innovate more. Moreover, organisational slack allows firms to continue to operate during economic downturns. An economic buffer such as organisational slack allows an organisation to reduce risk associated with failing projects and therefore foster new projects with fewer true consequences (Bourgeois III, 1996; O’Brien, 2003).
Overall, high levels of organisational slack allow CEOs to continue to pursue innovative opportunities as it provides them with the necessary resources to do so (Arena, Michelon & Trojanowski, 2018; Wasserman, Nohria & Anand, 2001). Thus, one could argue that organisational slack influences the relationship between CEO overconfidence and firm innovation performance positively by allowing CEOs to execute their investments in firm innovation and providing the necessary resources to do so, forming the basis for hypothesis 2:
H2: Firm slack strengthens the effect of CEO overconfidence on firm innovation performance.
2.4 Firm Specific Factor – Firm Leverage
Another factor to take into account is the level of firm leverage. By looking into the degree of financial leverage in a firm, it allows for CEOs to see how the company’s assets and business operations are financed; either by debt or equity. When there is high firm leverage, it indicates that most items are financed by debt as opposed to equity. The leverage ratio allows CEOs to make more informed strategic choices as it gives insights into whether a firm is able to pay off its direct outstanding loans.
Giudici & Paleari (2000) have shown that financial constraints create a barrier to innovate and thus negatively impact the relationship between CEO overconfidence and firm innovation performance. Firms cannot be truly innovative and compete in their respective industry without using traditional financing methods such as taking out funds. Therefore, a
17 high level of firm leverage could indicate that firms have been aggressively financing their innovation activities with debt. Hall & Lerner (2009) further investigate this gap between being able to fund innovation internally and the need for acquiring external funding within firms. They discovered that CEOs prefer internal funds as opposed to financing via external funds or venture capital funds thus resulting in a gap between the funding available and the funding needed to be innovative. This abstaining of external financing is amplified by overconfident CEOs who deem external funding costly (Deshmukh et al., 2013).
In addition, higher levels of firm leverage lower a firm’s borrowing capacity resulting in firms not being able to gain external funds for future innovation activities (Bourgeois III, 1996). Therefore, when looking at the impact that the degree of financial leverage has on a firm, it is clear that this impact is two-fold. On the one hand, a high firm leverage ratio reveals that firms are gathering external funds in order to finance their operations and/or innovation activities. This showcases a willingness to be innovative and thus could indicate a positive association with firm innovativeness. On the other hand, high amounts of debt can indicate a limit in the amount of free resources to spend on any future innovation activities and thus result in ultimately lower levels of innovation. The latter argument is deemed more sound as high levels of debt are linked to high levels of financial risk, resulting in potentially fewer opportunities to innovate (Savignac, 2008).
Overall, one could argue that high firm leverage values hinder overconfident CEOs in pursuing innovative projects as the necessary resources are not obtained in a sustainable long-term manner, due to the lowering of borrowing capacity (Bourgeois III, 1996). This results in a weaker impact of CEOs on the innovative performance of their respective firms and forms the basis for hypothesis 3:
18 2.5 Firm Specific Factor – Firm Growth
A final firm-specific factor that may influence the relationship between CEO overconfidence and firm innovation performance is firm growth. Colombelli, Haned & Le Bac (2014) show that innovative firms are growing at a more rapid pace than non-innovative firms which is supported by other scholars (e.g. Audretsch, Coad & Segarra, 2014; Demirel & Mazzucato, 2012). However, scholars are not in agreement whether innovation is the cause or the effect of rapid growing firms. In other words, does innovation cater for growth or does growth facilitate innovative activities? Demirel & Mazzucato (2012) argue that innovation expressed in R&D expenditure facilitates the growth of a firm. This is further supported by the fact that innovation is considered to be one of the most crucial factors for “superstar” fast growing firms (Coad & Rao, 2008). On the contrary, Adjei & Adjei (2017) reveal that firms can be innovative due to their continuous increase in market share. This unclear direction of the causality could be explained due to the fact that the relationship can be seen as a self-fulfilling prophecy. In this context, the initial direction is not clear but higher levels of innovation lead to a higher amount of firm growth after which firm growth facilitates more innovative projects (Audretsch, 1995). High levels of firm growth allow for CEOs to continue to invest in new innovative projects. Once growth slows down, fewer internal resources will be available and thus the impact which an CEO has on firm innovativeness decrease. Moreover, Hall & Lerner (2009) recognize that CEOs tend to refrain from gaining funds externally due to the perceived high costs of doing so. This will result in no additional funds being available for CEOs to continue to be as innovative as they used to be. For these reasons, one could argue that when firm growth decreases, the impact of overconfident CEOs on the level of firm innovation performance decreases accordingly and vice versa: this forms the basis for hypothesis 4:
19
3. METHODOLOGY
The following section first deals with the data and its sources. Subsequently the sample which serves as a foundation to analyse the hypothesized relationships will be discussed. In addition, the method of data collection, variable definitions and statistical analysis will be elaborated on.
3.1 Data & Sources
When considering the relationship between CEO overconfidence and firm innovation performance, it is clear from the above-mentioned literature that data from complex and volatile industries is needed in order to truly see the impact that overconfident CEOs have on firm innovation (Finkelstein & Hambrick, 1996). Moreover, what is additionally needed is an industry which is heavily relying on new innovations in order to allow firms to succeed and survive long-term (Goel & Thakor, 2008). The pharmaceutical industry is one of the largest industries in which these characteristics are present (Li & Tang, 2010). R&D expenditure represents a large portion of the overall expenditures of a firm and impacts the financial situation of a firm drastically (DiMasi, Hansen, Grabowski & Lasagna, 1991). These expenditures are needed in order to survive long-term within the industry.
When considering trends of globalisation, faster product life cycle and greater competition are apparent. It is clear that these factors have made the firms within the pharmaceutical industry even more dependent on innovation to survive. Cardinal (2001) states that: “the foundation of competitive advantage in the pharmaceutical industry lies in successful innovation. The pharmaceutical industry spends more on research and development as a percentage of sales than any other high-tech industry, including electronics, computers and aerospace” (p.20). Therefore, the global pharmaceutical industry allows for an appropriate insight into the relationships at hand.
20 In order to obtain the quantitative data, several data collection methods were used. The data originated from annual reports, BoardEx data as well as Hofstede country dimensions. First of all, annual reports of pharmaceutical firms were used in order to obtain financial information for each firm. The annual reports ranging from 2010 until 2016 were used to obtain longitudinal data. Besides the financial information, all letters to shareholders, hereafter LTS, were extracted from the annual reports.
In addition, CEO specific information for each firm is obtained via BoardEx, an online database which consists of information regarding the profiles of each CEO as well as of top management teams (BoardEx, 2018). Finally, in order to obtain country specific dimensions, Hofstede dimensions regarding power distance, uncertainty avoidance and individualism were collected with respect to the country of origin of the firm. Appendix A contains the full list of the Hofstede scores for all countries involved in the data analysis.
3.2 Sample and Procedure
For this thesis, a data set is generated consisting of 85 multinationals within the pharmaceutical industry. Appendix B contains the full list of firms. After accounting for incomplete data, outliers and lag within the data, 479 firm-year observations between 2011 and 2016 were found for these firms. Furthermore, the data from 2010 was used to generate a proxy for firm growth using the firm growth values of the year before. In order to determine whether or not these firm-year observations are sufficient for the statistical analysis it is important to look into the number of independent variables. Burns & Burns (2008) state that one needs 15 times more cases than independent variables (IV). For this thesis, this would imply 15 IV *15 resulting in a minimum of 225 cases needed. The 480 cases therefore comfortably exceed this requirement. The firms originate from 21 countries, with significant presence in India (11%), Japan (27%)
21 and the United States of America (22%). Furthermore, these 85 firms have had 108 different CEOs from 2011-2016 originating from 25 different countries.
3.3 Measures
CEO Overconfidence. Malmendier & Tate (2005a; 2008) and Hirshleifer et al. (2012)
measure CEO overconfidence by using both an option-based measure, in which the amount of options a CEO exercises are measured, as well as press-based measures in terms of linguistic analysis. Both measures are shown to be highly correlated. Moreover, qualitative interviews are also used to measure the level of overconfidence of a CEO (Simon & Houghton, 2003).
For this thesis, linguistic analysis of LTS is used in order to gain insights into the level of CEO overconfidence. The rationale for this choice is explained below. This analysis is done by a programme called Linguistics Inquire and Word Count, hereafter LIWC, which is created by Pennebaker Conglomerates Inc (Pennebaker, Boyd, Jordan, & Blackburn, 2015). The software uses text analysis to determine the sentiment behind the use of certain words. The way people use certain words can provide valuable information about their personality, characteristics and traits (Pennebaker et al., 2015). LTS are an appropriate proxy to perform content analysis on to determine CEO overconfidence for several reasons. First of all, Craig & Amernic (2011) provide research showing how aspects of overconfidence within a CEO can be identified through their respective LTS. Likewise, Bournois & Point (2006) see evidence of CEO overconfidence in their LTS. Secondly, as the LTS is a part of the annual report of a firm, is will have been proofread by executives, and will have been adapted considerably to reflect individual views (Duriau, Reger & Pfarrer, 2007). Last but not least, annual reports do not suffer from retroactive sensemaking. The meaning of the annual report is clear due to the many alterations that were made before the actual publication (Barr, Stimpert & Huff, 1992). From the LIWC analysis, the clout score is used in this thesis as this score measures the relative rank
22 and power of an individual as well as a sense of overconfidence (Kacewicz, Pennebaker, Davis, Jeon & Graesser, 2013).
Firm Innovation Performance. In order to determine firm innovation performance a
proxy is taken in terms of the level of R&D expenditure. Measuring innovation can be challenging and therefore a clear quantitative measure is needed in order to compare firms to one another (Smith, 2005). Galasso & Simcoe (2010) use both the logarithm of R&D expenditure as well as total patents and citation count to measure the innovation level of a firm. Moreover, Hirshleifer et al. (2012) use a similar transformed R&D expenditure variable in order to measure the level of innovation input by a firm. As R&D expenditure data is more readily available than patent count, this is used to measure firm innovation performance. The logarithm of R&D expenditure is taken into account for any non-normality within the data, following previous scholars (Galasso & Simcoe, 2010). "#$% &''()*+#(' ,-$.($%*'/- = 1(2(4&6 789-':#+;$- $=).
Organisational Slack. When considering organisational slack, it is important to look at
what is truly being measured. When measuring organisational slack, we are aiming to measure the resources which are readily available and thus the current ratio will be used in order to measure an organisations short term liquidity (Lee & Wu, 2016). Herold et al. (2006) have explored both the current and quick ratio in order to measure organisational slack and found similar results indicating a homogeneous result between both measures. The current ratio is defined as follows: ?;$$-'+ 4*+#( =@ABBCDE HIJKILIEICG@ABBCDE FGGCEG . In this formula, current assets are the assets of a firm which can be converted back to available funds in a short period of time. This consists of cash, securities, receivables, inventory and other short-term assets. On the other
23 hand, current liabilities are deemed to be obligations which need to be fulfilled within 12 months.
When organisational slack is used as a moderator on the relationship between CEO overconfidence and firm innovation performance, a time-delay is necessary as the current available resources cannot immediately impact a firm’s innovation performance, especially not in the pharmaceutical sector in which research needs to be conducted in order to increase one’s innovation level. A one-year lag is assumed in order to accommodate for the time delay phenomenon as this will showcase the true timeframe in which organisational slack will impact the relationship between CEO overconfidence and firm innovation performance.
Firm Leverage. When measuring the impact which firm leverage has on the relationship
between CEO overconfidence and firm innovation performance, it is evident that there are multiple types of ratios which could be used in order to assess the level of financial leverage. Bourgeois III (1996) as well as Yuan & Motohashi (2008) use the debt to equity ratio in order to determine the impact of firm leverage on firm investments as higher debt to equity ratios reveal how able a CEO is to pursue his/her innovative ideas. The debt to equity ratio is the broadest definition of firm leverage (Bei & Wijewardana, 2012) and is formulated as follows: 6-M+ +( 7N;#+O $*+#( =RSJBCSQLTCB UVAIEWPQEJL LIJKILIEICG . By using the debt to equity ratio as a proxy for firm leverage, it is expected that the impact this ratio has on our main relationship between CEO overconfidence and firm innovation performance will be established.
Firm Growth. In order to examine the impact which firm growth has on the relationship
between CEO overconfidence and firm innovation performance, several measurements for firm growth can be taken into consideration. Colombelli et al. (2014) use the growth rate of turnover and firm size as proxies for the level of growth. On the other hand, Demirel & Mazzucato
24 (2012) measure firm growth by concentrating on the output of a firm measured in the form of the logarithm of sales in comparison to the previous year. This thesis follows the latter method as using the log-difference is the most widespread measure. Moreover, previous scholars such as Coad & Rao (2008) gained significant results using this measure. This allows firm growth to be measured as follows: "#$% 2$(X+ℎ = 1(2_[*\-]_$E− 1(2_[*\-]_$E_`.
Control Variables. In order to combat any influence of other variables on the overall
relationship between CEO overconfidence and firm innovation performance, it is necessary to include several control variables. First of all, firm size is proven to impact the amount of R&D expenditure and thus firm innovation performance. Tushman & Romanelli (2008) show that the larger the number of employees, the less likely it is that a firm will implement any radical changes. On the contrary, larger firms generally have more resources, allowing for firms to be able to invest these in innovative projects and enhancing the innovation capacity of a firm. Both factors will impact the level of innovation and therefore firm size needs to be controlled for by taking the logarithm of the number of employees (to account for the skewness of the distribution): "#$% ]#a- = 1(2(7%9\(O--]_b(+*\).
Besides controlling at firm-level, one must consider several variables to control for at CEO-level. CEO tenure has a significant effect on the level of firm innovation performance as the longer a CEO is in charge, the less likely he or she will be to alter his or her current strategy (Hambrick, 2007). This is accounted for by controlling for the number of years that the CEO is in charge at the firm. Likewise, the older a CEO is, the less he or she tends to spend on R&D as they are nearing their retirement age and thus do not have as much of a long-term vision as younger CEOs do (Barker III & Mueller, 2002). This will be measured by subtracting the year of birth from the year of the annual report.
25 When considering external influences, it becomes apparent that macro-shocks may have a significant impact on all firms within the sample. When considering the great economic downturn of 2010, it is evident that events like this have a large influence on specific years and therefore all years are dummy coded in order to control for this. Next to global economic downturns several more regional economic downturns have occurred due to specific country dynamics and characteristics. In order to control for these country fixed effects, Hofstede’s country comparison dimensions are added to the model (Hofstede, 2011). Power distance, uncertainty avoidance and individualism are selected of Geert Hofstede’s cultural dimensions as they give a clear overview of the dynamics at play within each country (Hofstede, 1983). An overview of all variables used, and their specifics can be found in Appendix C.
3.4 Analytical analysis
All data is initially collected in a formulated excel sheet in order to directly calculate all variables. These results were transferred to IBM SPSS in order to conduct the statistical analysis. In order to gain a better understanding of the various dimensions and variables an initial analysis will be conducted in the form of descriptive statistics and bivariate correlations. These results will allow for a clearer picture of the relationships at hand.
When analysing hypothesis 1, an ordinary least square regression (OLS) is performed, both without firm innovation performance as well as added to the various control variables in order to deem their significance. After this, the statistical tool ‘PROCESS macro’ by Hayes (2013) is performed on the data for hypotheses 2, 3 and 4. Model 1 within PROCESS macro tests the moderation effect of the various firm-specific factors on the relationship between CEO overconfidence and firm innovation performance (Hayes, 2013). Before these analyses are conducted, various assumptions of linearity, normality, homoscedasticity and independence of
26 observations are tested. Moreover, any outliers need to be identified in order to make sure these do not generate any skewed results. See Appendix D for the regression model equations.
4. RESULTS
This chapter provides an analysis of the results of the data and is presented twofold. First, the descriptive and bivariate correlations are explored. The second section focusses on the various results which can be derived from the statistical analysis in order to review whether the various hypotheses are supported.
4.1 Descriptive statistics & Bivariate Correlations
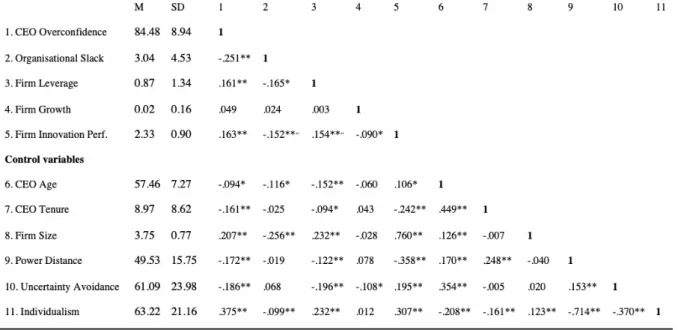
Before conducting any regressions, it is important to look into both the descriptive as well as bivariate correlations of all above-mentioned variables in order to gain a better understanding of the relationships at play. These are displayed in Table 1.
27 When comparing the CEO overconfidence level shown by the clout score (M = 84.48, SD = 8.94) to the baseline clout scores of LIWC (M = 57.95, SD = 17.51), it is clear that these are significantly higher than those obtained earlier from the analysis of text written by 80,000 authors – see Appendix E for analysis (Pennebaker et al., 2015). This is what is to be predicted as texts written by CEOs are expected to be filled with more confidence due to the role and characteristics CEOs have.
The various country control dimensions show a large standard deviation (SD = 15.75, 23.98, 21.16 respectively), indicating high differences between the various countries from which the data originates. When analysing the various CEO control variables, it is clear that the average CEO age (M = 57.46, SD = 7.27) and their tenure (M = 8.97, SD = 8.62) is in line with the average across the whole of the life sciences industry which lies at 59 years old, averaging 9.4 years in the position of CEO (“Age and tenure”, 2017). In addition, the tenure of a CEO has a large standard deviation (> 8 years) in comparison to its mean (< 9 years). Firm size, which has been transformed for normality by taking the natural logarithm of all employees (thousands) gives us an M = 3.75 & SD = 0.77.
In addition to analysing the descriptive statistics, a bivariate correlation analysis is run between all variables. CEO overconfidence has a highly significant small positive relationship with the level of firm innovation performance (r = .163, p < .01) as well as between CEO overconfidence and firm leverage (r = .161, p < .01). Moreover, a significant negative relationship between CEO overconfidence and organisational slack (r = -.251, p < .01) exists. Firm innovation performance has a highly significant small negative relationship with organisational slack (r = -.152, p < .01). Contrarily, a significant positive relationship exists between CEO overconfidence and firm leverage (r = .161, p < .01). Firm growth does not have a significant correlation with CEO overconfidence (r = .049, p > .05) whilst a slight significant negative relationship exists with firm innovation performance (r = -.090, p < .05).
28 What is more apparent is that when looking into the intercorrelations between the firm specific factors, a significant negative relationship between the organisational slack and firm leverage exists (r = -.165, p < .01). The question arises whether or not these need to be combined, however after reviewing the collinearity statistic of both organisational slack and firm leverage this is not needed. Moreover, when considering the origin of each variable in terms of formula’s ?;$$-'+ 4*+#( =@ABBCDE HIJKILIEICG@ABBCDE FGGCEG & 6-M+ +( 7N;#+O $*+#( =
PQEJL LIJKILIEICG
RSJBCSQLTCB UVAIEW it is clear that a certain amount of the current liabilities can be found back in
the numerator of the Debt to Equity ratio making the correlational outcome understandable. When analysing the control variables, one can see a significant negative relationship between CEO age and CEO overconfidence (r = -.094 p < .05) but also a significant positive relationship between CEO age and firm innovation performance (r = .106 p < .05). Moreover, CEO tenure has a significantly negative relationship with both CEO overconfidence (r = -.161 p < .01) and firm innovation performance (r = -.242 p < .01). Firm size is significantly positive
relational to CEO overconfidence (r = .207 p < .01) as well as to firm innovation performance (r = .760, p < .01). Lastly, the Hofstede dimensions selected (power distance, uncertainty avoidance and individualism) are significantly related to CEO overconfidence (r = -.172 p < .01; r = -.186 p < .01; r = .375 p < .01 respectively). Moreover, all are significantly related to firm innovation performance (r = -.358 p < .01; r = -.195 p < .01; r = .307 p < .01 respectively).
4.2 Hypotheses analysis
After having conducted the initial analysis in order to gain a better understanding, it is clear that most variables within the model as well as the control variables have a significant relationship to one another. In order to run the OLS regressions as well as use ‘PROCESS macro’ by Hayes (2013), several assumptions need to be checked. The data is analysed in terms of linearity, normality of distribution, collinearity and homoscedasticity (Field, 2009). By
29 running a regression without CEO overconfidence a priori, it becomes clear that the data is normal due to the Q-Q plots as well as homoscedastic through the standardised scatterplots Likewise, when considering outliers, it is important to look at Cook’s distance between our focal variables in order to deem whether several values are highly influential. Hair, Anderson, Tatham and Black (1998) consider Cook’s distance values greater than 1 to be influential, however this is not the case (max 0.031, see Appendix F for details).
4.3 Simple Linear Regression Analysis
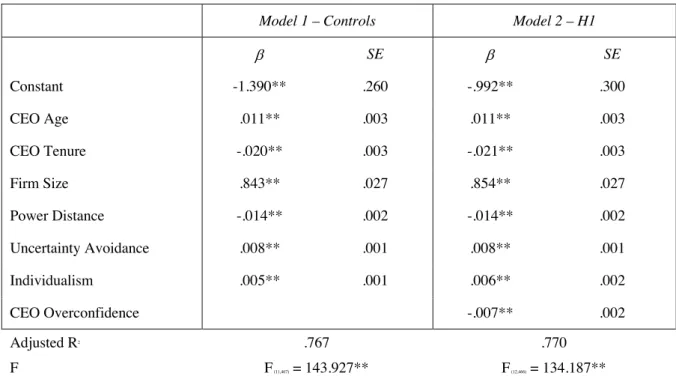
By conducting an OLS regression, the various relationships between the variables are identified. Table 2 illustrates the results of the analysis of just the control variables as well as the analysis including the CEO overconfidence score (H1).
Model 1 – Controls Model 2 – H1
b SE b SE Constant -1.390** .260 -.992** .300 CEO Age .011** .003 .011** .003 CEO Tenure -.020** .003 -.021** .003 Firm Size .843** .027 .854** .027 Power Distance -.014** .002 -.014** .002 Uncertainty Avoidance .008** .001 .008** .001 Individualism .005** .001 .006** .002 CEO Overconfidence -.007** .002 Adjusted R2 .767 .770 F F (11,467) = 143.927** F (12,466) = 134.187**
Note, **p < .01, *p< .05; Dependent Variable: Firm Innovation Performance
30 When first reviewing model 1, it is clear that this control model has an adjusted R2 of 0.767 indicating that 76.7% of the variance in innovation performance is explained by these dependent variables. Moreover, the model is statistically significant with an F-value of 143.927 at p < 0.01. All control variables show a significant influence on firm innovation performance. Both firm size (b = .843, t(467) = 31.758, p < .01) and CEO age (b = .011, t(467) = 3.302, p < .01) positively influence firm innovation performance. On the other hand, CEO tenure (b = -.020, t(467) = --7.547, p < .01) has a significant negative relationship on the innovative performance. When considering country fixed effects, all of Hofstede’s dimensions are significant. The level of power distance is significantly negative (b = -.014, t(467) = -7.736, p < .01) whilst uncertainty avoidance (b = .008, t(467) = 8.719, p < .01) and individualism (b = .005, t(467) = 3.181, p < .01) positively influence firm innovation performance. All year dummy variables are insignificant indicating no major overarching changes that have impacted the innovation performance of a firm. Lastly, the maximum amount of multicollinearity is a VIF = 2.437 for country individualism. This indicates no issues in terms of data being collinear (Hayes, 2013).
Model 2 includes CEO overconfidence in order to test for hypothesis 1. The level of adjusted R2 has increased slightly to 0.770 indicating that now 77% of the variance in innovation performance is explained by these dependent variables. Moreover, the model is statistically significant with an F-value of 134.187 at p < 0.01. The same control variables are significant, only slightly deviating from model 1 in terms of Beta’s (β). Likewise, multicollinearity is not an issue as the maximum amount is a VIF = 2.705, once again for the level of country individualism. Importantly, a significant negative relationship exists between the level of CEO overconfidence and firm innovation performance (b = -.007, t(466) = -2.633, p < .01). This is contrary to the positive relationship that is expected and thus we can conclude
31 4.4 Simple Moderation Analysis
Simple moderation analysis is used in order to study the moderating effect of the organisational slack, firm leverage and firm growth on the above tested relationship between CEO overconfidence and firm innovation performance. Three separate moderation analyses are performed in order to conduct their analysis accordingly (Hayes, 2013). All three models are shown below in figures 2 – 4 after which their results are summarized in table 3:
Model 3 – H2 Model 4 – H3 Model 5 – H4
b SE b SE b SE
Constant -.903** .327 -1.022** .325 -.966** .303
CEO Overconfidence -.010** .003 -.006* .003 -.007* .003
Org. Slack (OS) -.072* .034
Firm Leverage (FL) .027 .191
Firm Growth (FG) -.824 1.105
Int. CEO OC_OS .001* .001
Int. CEO OC_FL -.001 .002
Int. CEO OC_FG .009 .013
Controls CEO Age .011** .003 .018** .003 .011** .003 CEO Tenure -.022** .003 -.021** .003 -.021** .003 Firm Size .883** .030 .863** .027 .856** .027 Power Distance -.013** .002 -.014** .002 -.014** .002 Uncertainty Avoidance .008** .001 .008** .001 .008** .001 Individualism .006** .002 .006** .002 .006** .002 Adjusted R2 0.778 0.777 0.776 F F (14,465) = 116.377** F (14,464) = 115.131** F (14,464) = 114.771**
Note, **p < .05, *p < .1; Dependent Variable: Firm Innovation Performance
Table 3 - Regression results for firm factors
CEO Overconfidence Firm Innovation Performance Firm Growth
CEO Overconfidence Firm Innovation Performance Organizational Slack
CEO Overconfidence Firm Innovation Performance Firm Leverage
Figure 2 - Moderation analysis organisational slack
Figure 3 - Moderation analysis firm leverage
Figure 4 - Moderation analysis firm growth
32 When considering the moderation effect, it is important to look into the interaction effect between the independent variable and moderating variable in order to determine whether it strengthens or weakens the relationship between the independent and dependent variable (Field, 2009; Hayes, 2013).
When looking into model 3 the results show that CEO overconfidence continues to have a significant negative effect on firm innovation performance (b = -.010, t(464) = -3.235, p < .01) and that organisational slack has a significant negative effect on firm innovation
performance (b = -.072, t(464) = -2.092, p < .05). The interaction term of organisational slack has a slightly significant positive effect on the relationship between CEO overconfidence and firm innovation performance (b = .001, t(464) = 2.237, p < .01). This is in line with the observations from the literature review and therefore supports H2.
When reviewing model 4, it shows that the interaction term of firm leverage does not have a significant effect on relationship between CEO overconfidence and firm innovation (b = -.001, t(464) = -.253, p = .801). Moreover, the direct effect of firm leverage on firm innovation performance is not significant (b = .027, t(464) = .139, p = .889) hindering us to draw any inferences. Therefore, H3 is not supported as no significant effects can be found.
Finally, model 5 shows that the interaction term for firm growth on the relationship between CEO overconfidence and firm innovation performance is insignificant (b = .009, t(464) = .686, p = .493). Likewise, the direct relationship between firm growth and firm
innovation performance is insignificant (b = -.824, t(464) = -.746, p = 0.456). This is not in line with hypothesis 4 which predicts a positive relationship, therefore H4 is not supported. In summary, the performed statistical analysis provides evidence that there is a significant impact of CEO overconfidence on firm innovation performance, however this is in the opposite direction of what was expected. Furthermore, the moderating effect of organisational slack is proven to be significant. On the other hand, the results indicate no significant relationship of
33 the moderating effect of firm leverage or firm growth. The above-mentioned results are concluded in table 4 according to their hypotheses:
Hypotheses Result
Hypothesis 1 Not supported
Hypothesis 2 Supported
Hypothesis 3 Not supported Hypothesis 4 Not supported
Table 4 - Summary of hypotheses
5. DISCUSSION
5.1 General Discussion and Findings
In the dynamic and ever-changing economy in which the right and most effective management has become more and more important, the study of CEO influence has become a topic of interest among many scholars (Finkelstein & Hambrick, 1996; Hambrick & Mason,1984; Hambrick, 2007; Mackey, 2008). Ample research has been done on the impact of CEO overconfidence on firm innovation performance (Galasso & Simcoe, 2010; Hirshleifer et al., 2012; Malmendier & Tate, 2005a), however the impact of firm-specific factors on this relationship is limited. This thesis builds upon existing literature by providing new insights that are focused on the pharmaceutical industry.
This thesis suggest that CEO overconfidence has a significant negative influence on firm innovation performance. This is not in line with results from previous studies in literature by scholars who found a positive influence (Galasso & Simcoe, 2010; Simon & Houghton, 2003; Tang et al., 2015; Wong et al., 2017). Most importantly, the findings of this thesis suggest that organisational slack has a significant positive impact on the relationship between CEO overconfidence and firm innovation performance. This is in line with the arguments of Arena et al. (2018). However, the moderating impact of both firm leverage and firm growth on the
34 relationship between CEO overconfidence and firm innovation performance could not be established as significant in this thesis. Both these results are not in line with existing literature by scholars on the influence of firm leverage (Bourgeois III, 1996) and firm growth (Demirel & Mazzucato, 2012). This may be related to factors specific to the pharmaceutical industry and needs to be further investigated. The initial significant negative relationship between CEO overconfidence and firm innovation performance is remarkable as similar empirical studies often resulted in significantly positive relations (Galasso & Simcoe, 2010; Hirshleifer et al., 2012; Malmendier & Tate, 2005a). One of the reasons for this result might be related to the linguistic analysis method of the letters to shareholders used and will be discussed in detail in the “limitations-section”.
The findings further suggest a significantly positively influence of organisational slack on the relationship between CEO overconfidence and firm innovation performance. (Hypothesis 2). When delving deeper into the exact interaction effect of the impact of
organisational slack on the relationship between CEO overconfidence and firm innovation performance, it is important to review the interaction effect as depicted in figure 5.
35 This indicates a stronger negative relationship between CEO overconfidence and firm innovation performance when the level of organisational slack is low compared to high. A possible explanation for this result is the limited amount of resources available in a low current ratio scenario resulting in lower firm innovation performance for all levels of CEO overconfidence. Furthermore, it is observed in the low current ratio scenario that the highly overconfident CEO has a stronger impact on firm innovation performance. This can be further seen numerically by looking into Hayes’ output in Appendix G that shows analysis only to be significant for lower levels of the current ratio.
It is important to realize that, when looking into the direct influence of organisational slack on firm innovation performance, we observe a direct negative impact within the regression. This is not in line with the arguments of Herold et al. (2006) who see organisational slack as one of the primary sources of the funding of innovation. This discrepancy may be explained by Nohria & Gulati (1997) who argue a more complex relationship in which an inverse U-shape relation exists that suggests a certain optimal amount of organisational slack. Too little organisational slack inhibits expenditure on innovation projects, too much organisational slack may cause inefficient innovation projects to be started up that negatively impact form innovation performance.
The second firm specific factor dealt with firm leverage. The findings did not show any clear influence of the debt to equity ratio on the relationship between CEO overconfidence and firm innovation performance (Hypothesis 3). The direction of the findings is in line with previous literature, however the findings are not significant. Moreover, the direction of the direct influence of firm leverage on firm innovation performance, albeit not significant, is in line with Hall & Lerner (2009) indicating that higher levels of firm leverage result indicate more firm innovation performance as firms are more aggressively financing their innovation activities. This is further supported by the high initial significant bivariate correlation. A reason
36 for the non-significance of the findings could lie in the fact that high levels of firm leverage can hinder the accessibility of future funds to innovate (Bourgeois III, 1996). This means that even though overconfident CEOs may want to be more innovative by acquiring many financial resources, the acquiring of these funds may be out of their control (due to restrictive and/or prohibitive regulations) thus resulting in no clear effect of firm leverage on the relationship between the overconfident CEO and firm innovation performance.
Furthermore, the relationship between CEO overconfidence and firm innovation performance is not significantly influenced by firm growth (Hypothesis 4). This result could possibly be explained by the fact that firm growth may not immediately allow CEOs to invest more resources into innovative projects. Therefore, the direct impact of firm growth on innovative performance may not be as strong as one might initially expect. In particular, as the pharmaceutical industry is volatile and highly competitive, the impact of firm growth may only be seen on the relationship between CEO overconfidence and firm innovation performance after a number of years of sustained firm growth. Only then do we see firms that are more likely to commit the necessary resources to fund multi-year innovation projects.
Finally, it is important to distinguish the impact which our different control variables had throughout the statistical analysis. Throughout all regressions, CEO age, CEO tenure, firm size and the three country fixed effects by the Hofstede dimensions were significant whilst the dummy year variables remained insignificant. The impact of firm size is backed by Tushman & Romanelli (2008) who show support for the positive impact as seen in our findings. Moreover, the negative impact of CEO tenure is reinforced by Barker III & Mueller (2002) and Bartoloni (2013) showing consistent results in the fact that CEOs longer in charge tend to be less innovative. The impact of CEO age on firm innovative performance is significantly positive, which is somewhat surprising in view of the results of previous studies (Barker III & Mueller, 2002). A reason for these findings may be specific to the industry as CEOs within
37 pharmaceutical firms typically first need to “earn their stripes” after which they are able to able to steer the firm. This could explain that the older a CEO is the more influence he would have within a firm and thus have more say in the level of innovativeness, however no references in literature could be identified to back this reasoning.
5.2 Theoretical contribution
After conducting literature and empirical research, this thesis adds to the current research on CEO overconfidence and its influence on firm innovation performance by adding several theoretical contributions.
Previous research addressed mainly the initial relationship between CEO overconfidence and firm innovation performance. This thesis studied the impact of three firm specific variables to gain a deeper understanding of their influence.
This thesis found statistically significant negative relationship between CEO overconfidence and firm innovation performance, in contrast with previous scholars (Galasso & Simcoe, 2010; Simon & Houghton, 2003; Tang et al., 2015; Wong et al., 2017). In addition, this thesis found evidence for a significant positive influence of organisational slack on the initial relationship, extending research by Arena et al (2018).
Furthermore, this thesis demonstrates that the impact of CEO tenure on firm innovation performance is in line with previous literature and now also applicable to the pharmaceutical industry (Barker III & Mueller, 2002; Bartoloni, 2013). Likewise, the findings of Tushman & Romanelli (2008) concerning the impact of firm size on firm innovative performance are replicated in this thesis for firms within the pharmaceutical industry. Furthermore, theoretical research by Hofstede (2011) concerning the impact of cultural dimensions on firm innovation performance have now been extended to the pharmaceutical industry in this thesis.
38 Finally, this thesis has explored an alternative measurement tool in order to define CEO overconfidence (in addition to the traditional option and press-based measures). This linguistic analysis extends the current use of text analysis on press-based measures and uses the annual letters to shareholders instead. This approach has the potential for a more simplified proxy for CEO overconfidence, as annual reports are a more accessible source of information and creates the possibility for researchers to accurately predict CEO overconfidence.
5.3 Managerial contribution
Besides having theoretical implications, the thesis identifies some practical and pragmatic findings related both to the overconfident CEO as well as the firm itself. These findings suggest that the results of this thesis could be beneficial in assisting the assessment, search and selection process for CEOs. Furthermore, the thesis results highlight the importance of organisational slack and provides the rationale for proper organisational slack target setting. Firstly, our findings indicate that as CEO tenure decreases, firm innovation performance increases. CEO tenure should be reviewed annually as a CEO tenure that is too long could indicate that a firm should call for fresh air within the organisation. Obviously, this is not the only factor to be considered in deciding whether a CEO should continue in the position, however it can play a significant role.
Secondly, when recruiting a new CEO several factors should be taken into consideration, amongst which the age of the CEO. According to our findings, having an older CEO may be beneficial within the pharmaceutical industry as they may have a more extensive track record and have proven themselves within the industry. This could lead to them being more willing to be more innovative, as our results suggest. This is a novel insight, not identified by previous studies and it would be worthwhile exploring this aspect further in future studies. Both CEO characteristics (age & tenure) mentioned above can have a significant influence on
39 the CEO’s effectiveness, are likely to impact the CEO’s decisions and hence the associated business results.
Finally, and most importantly, this thesis shows that organisational slack directly impacts firm innovation performance negatively as well as strengthens the negative relationship between CEO overconfidence and firm innovation performance. This double impact needs to be considered when setting firm-specific targets. It makes sense to set sensible targets for organisational slack as this allows for appropriate funding of innovative projects. As discussed in the “general discussion and findings” section, too little organisational slack inhibits expenditure on innovation projects, too much organisational slack may cause inefficient innovation projects to be started up that negatively impact form innovation performance. It is important to realize that having an overconfident CEO alone does not allow for successful firm innovation as an appropriate amount of organisational slack needs to be available for these overconfident CEOs to pursue innovative projects (Arena et al., 2018).
5.4 Limitations & Future Research
Despite the contributions mentioned, this thesis identifies several limitations that need to be addressed.
Firstly, although the sample size is considered sufficiently large, there are some limitations in the current data set. When looking into the data, the majority of the year entries came from Asian market firms (44%). The rest of the sample is equally distributed across Europe and the USA. It is unknown whether this data is representative for the total global pharmaceutical industry. It is worth noting that country-fixed effects are deemed to be significant (Hofstede, 1983). This raises the question whether country and/or regional differences play a more significant role and need to be further researched, also in view of the observed large standard deviation in the Hofstede variables. Furthermore, when considering