Long-term prognostic impact of CT-Leaman score in patients with
non-obstructive CAD: Results from the COronary CT Angiography EvaluatioN
For Clinical Outcomes InteRnational Multicenter (CONFIRM) study
☆
Daniele Andreini
i,⁎
, Gianluca Pontone
i, Saima Mushtaq
i, Heidi Gransar
d, Edoardo Conte
i,
Antonio L. Bartorelli
i, Mauro Pepi
i, Maksymilian P. Opolski
a, Bríain ó Hartaigh
b, Daniel S. Berman
d,
Matthew J. Budoff
e, Stephan Achenbach
f, Mouaz Al-Mallah
g, Filippo Cademartiri
j,y, Tracy Q. Callister
k,
Hyuk-Jae Chang
l, Kavitha Chinnaiyan
m, Benjamin J.W. Chow
n, Ricardo Cury
o, Augustin Delago
q,
Martin Hadamitzky
r, Joerg Hausleiter
s, Gudrun Feuchtner
t, Yong-Jin Kim
u, Philipp A. Kaufmann
v,
Jonathon Leipsic
w, Fay Y. Lin
b, Erica Maffei
y, Gilbert Raff
m, Leslee J. Shaw
z, Todd C. Villines
aa,
Allison Dunning
c, Hugo Marques
h, Ronen Rubinshtein
p, Niree Hindoyan
x, Millie Gomez
x, James K Min
ba
Department of Interventional Cardiology and Angiology, Institute of Cardiology, Warsaw, Poland
b
Department of Radiology, The New York-Presbyterian Hospital and the Weill Cornell Medical College, New York, NY, USA
c
Department of Healthcare Policy and Research, Weill Cornell Medical College, New York, NY, USA
d
Department of Imaging and Division of Cardiology, Department of Medicine, Cedars-Sinai Heart Institute, Cedars-Sinai Medical Center, Los Angeles, CA, USA
eDepartment of Medicine, Harbor UCLA Medical Center, Los Angeles, CA, USA f
Department of Medicine, University of Erlangen, Erlangen, Germany
g
King Saud bin Abdulaziz University for Health Sciences, King Abdullah International Medical Research Center, King Abdul Aziz Cardiac Center, Ministry of National Guard, Health Affairs, Saudi Arabia
h
Department of Surgery, Curry Cabral Hospital, Lisbon, Portugal
i
Department of Clinical Sciences and Community Health, University of Milan, Centro Cardiologico Monzino, IRCCS Milan, Italy
j
Department of Radiology, Erasmus Medical Center, Rotterdam, The Netherlands
kTennessee Heart and Vascular Institute, Hendersonville, TN, USA
lDivision of Cardiology, Severance Cardiovascular Hospital, Seoul, South Korea m
William Beaumont Hospital, Royal Oaks, MI, USA
n
Department of Medicine and Radiology, University of Ottawa Heart Institute, Ontario, Canada
o
Baptist Cardiac and Vascular Institute, Miami, FL, USA
p
Department of Cardiology at the Lady Davis Carmel Medical Center, The Ruth and Bruce Rappaport School of Medicine, Technion-Israel Institute of Technology, Haifa, Israel
q
Capitol Cardiology Associates, Albany, NY, USA
rDivision of Cardiology, Deutsches Herzzentrum München, Munich, Germany sMedizinische Klinik I der Ludwig-Maximilians-Universität München, Munich, Germany t
Department of Radiology, Medical University of Innsbruck, Innsbruck, Austria
u
Department of Medicine and Radiology, Seoul National University Hospital, Seoul, South Korea
v
Department of Nuclear Cardiology, Cardiovascular Center, University Hospital Zurich, Zurich, Switzerland
w
Department of Medical Imaging and Division of Cardiology, St. Paul's Hospital, University of British Columbia, Vancouver, BC, Canada
x
Dalio Institute of Cardiovascular Imaging, Weill Cornell Medical College and New York-Presbyterian Hospital, New York, NY, USA
yCardiovascular Imaging Unit, Giovanni XXIII Hospital, Monastier, Italy zDepartment of Medicine, Emory University School of Medicine, Atlanta, GA, USA aa
Department of Medicine, Walter Reed National Medical Center, Bethesda, MD, USA
a b s t r a c t
a r t i c l e i n f o
Article history:
Received 7 September 2016
Received in revised form 13 December 2016 Accepted 19 December 2016
Available online 28 December 2016
Background: Non-obstructive coronary artery disease (CAD) identified by coronary computed tomography angi-ography (CCTA) demonstrated prognostic value. CT-adapted Leaman score (CT-LeSc) showed to improve the prognostic stratification. Aim of the study was to evaluate the capability of CT-LeSc to assess long-term prognosis of patients with non-obstructive (CAD).
Methods: From 17 centers, we enrolled 2402 patients without prior CAD history who underwent CCTA that showed non-obstructive CAD and provided complete information on plaque composition. Patients were divided
☆ Relationships with industry. Dr. Min has served on the medical advisory boards Arineta; He is a consultant to Heart Flow and Cardiovascular Research Foundation; and has received research support from GE Healthcare.
⁎ Corresponding author at: Via C. Parea 4, 20138 Milan, Italy. E-mail address:[email protected](D. Andreini).
http://dx.doi.org/10.1016/j.ijcard.2016.12.137
0167-5273/© 2016 Elsevier Ireland Ltd. All rights reserved.
Contents lists available atScienceDirect
International Journal of Cardiology
into a group without CAD and a group with non-obstructive CAD (b50% stenosis). Segment-involvement score (SIS) and CT-LeSc were calculated. Outcomes were non-fatal myocardial infarction (MI) and the combined end-point of MI and all-cause mortality.
Results: Patient mean age was 56 ± 12 years. At follow-up (mean 59.8 ± 13.9 months), 183 events occurred (53 MI, 99 all-cause deaths and 31 late revascularizations). CT-LeSc was the only multivariate predictor of MI (HRs 2.84 and 2.98 in two models with Framingham and risk factors, respectively) and of MI plus all-cause mortality (HR 2.48 and 1.94 in two models with Framingham and risk factors, respectively). This was confirmed by a net reclas-sification analysis confirming that the CT-LeSc was able to correctly reclassify a significant proportion of patients (cNRI 0.28 and 0.23 for MI and MI plus all-cause mortality, respectively) vs. baseline model, whereas SIS did not. Conclusion: CT-LeSc is an independent predictor of major acute cardiac events, improving prognostic stratification of patients with non-obstructive CAD.
© 2016 Elsevier Ireland Ltd. All rights reserved.
Keywords:
Coronary CT angiography CT-adapted Leaman score Non-obstructive CAD Prognosis
Patients reclassification
1. Introduction
In recent years, studies supporting the prognostic value of coronary CT angiography (CCTA), including single-center studies and a large mul-ticenter registry, have been published[1,2]. According to these data, while the absence of identifiable plaques in the coronary tree is associat-ed with an excellent prognosis, it has also been consistently demonstrat-ed that the identification of non-obstructive lesions, a unique feature of CCTA as a non-invasive coronary imaging modality, has prognostic value. This has clinical implications because many patients fall in this cat-egory, as reflected by the high proportion of patients with atherosclerotic plaques in many CCTA databases[2–5]. Nevertheless, as non-obstructive CAD is a very heterogeneous and prevalent condition, there is the need for tools to quantify total coronary atherosclerotic burden in order to bet-ter stratify these patients. Recently, a new developed score, the CT-adapted Leaman score (CT-LeSc), using the comprehensive information on lesion localization, plaque composition and degree of stenosis provid-ed by CCTA, resultprovid-ed in a relatively small, single-center setting, to be an independent long-term predictor of hard cardiac events and to improve the CCTA prognostic stratification of non-obstructive CAD[6].
In the present prospective international multicenter study, we eval-uated the capability of the CT-LeSc to stratify the long-term prognosis of a large cohort of patients with non-obstructive CAD at CCTA evaluation. 2. Methods
2.1. Study population
The design and rationale of the CONFIRM (COronary CT Angiography EvaluatioN For Clinical Outcomes: An InteRnational Multicenter) regis-try has been described previously[7]. For the current study, we utilized the data from the CONFIRM long-term follow-up registry that included only patients who had a follow-up duration of more than three years. Overall, 17,181 patients who underwent CCTA at 17 centers in 9 coun-tries (Austria, Canada, Germany, Israel, Italy, Portugal, South Korea, Switzerland, and United States) were enrolled between February 2003 and May 2011 for long-term follow-up. Inclusion criteria were age N18 years, a CCTA performed with a scanner equipped with at least 64-detectors, and CCTA images of interpretable quality. Among the 5010 patients in whom MACE data at follow-up and complete plaque characteristics data were collected we excluded those with prior history of CAD (n = 1741), myocardial revascularization performed early after CCTA (b90 days) (n = 377) and presence of obstructive coronary le-sions (N50%) (n = 490). The analytic sample comprised 2402. patients. Informed consent was obtained from each patient and[2]the study pro-tocol conforms to the ethical guidelines of the 1975 Declaration of Helsinki as reflected in a priori approval by the institution's human re-search committee.
2.2. Risk factor assessment
Clinical CAD risk factors including smoking, hypertension, dyslipid-emia, diabetes, and family history were collected prior to CCTA
examination by direct patient interview performed by a physician or nurse research coordinator and/or with standardized site question-naires[7].
2.3. Imaging analysis
CCTA data were acquired using multi-detector row CT scanners consisting of 64-rows or greater. Expert readers analyzed all CCTA images according to the guidelines of the Society of Cardiovascular Computed Tomography (SCCT)[8,9]. We defined coronary athero-sclerosis in CCTA images as any tissue structure larger than 1 mm2,
which was either within the lumen of the coronary artery or adja-cent to the coronary artery lumen and could be distinguished from the adjacent epicardial fat, pericardial tissue, or the artery lumen. We used a modified American Heart Association 16-segment coro-nary artery tree model for analysis[10]. Coronary artery luminal narrowing was defined as the presence of any plaque resulting in a % diameter reductionN0. Non-obstructive lesions were defined as coronary artery segments showing plaques with a luminal diameter stenosisb50%. Normal CCTA was defined as the absence of any cor-onary artery luminal narrowing. The SIS, ranging from 0 to 16, was calculated as the total number of segments with plaques (any de-gree of stenosis). The methodology for the CT-LeSc has been previ-ously described[11]. Briefly, three sets of weighting factors are used for this score: 1) localization of the coronary plaques, account-ing for dominance; 2) type of plaque, with a multiplication factor of 1 for calcified plaques and of 1.5 for non-calcified and mixed plaques; and 3) degree of stenosis, with a multiplication factor of 0.615 for non-obstructive (b50% stenosis) and a multiplication fac-tor of 1 for obstructive (≥50% stenosis) lesions. The CT-LeSc was cal-culated on a patient level as the sum of the partial CT-LeSc of all evaluable coronary segments. For both the SIS and the CT-LeSc, prognostically validated cut-off values (N5) were used[4,6]. Analy-sis of coronary artery calcium score was performed when available. The total mean dose length product for CCTA was estimated to be 938 ± 379 mGy × cm, corresponding to an estimated radiation dose of 13 ± 5 mSv.
2.4. Patient follow-up
The primary outcomes of the current study were non-fatal myocar-dial infarction (MI) and the combined end-point of MI and all-cause mortality. As previously reported[7], the outcomes were assessed at each institution by direct interview, telephone contact, review of medi-cal records, or using a mailed standardized questionnaire. In the USA, all-cause mortality was additionally searched by the Social Security Death Index. Site physicians defined MI according to ACC/AHA guide-lines and the World Health Organization Universal Definition of Myo-cardial Infarction [12]. All revascularizations were recorded and patients with elective myocardial revascularization were censored at follow-up.
2.5. Statistical analysis
Categorical variables are presented as counts and proportions. Continuous variables are presented as means ± SD. A one-way ANOVA or the Kruskal–Wallis test was used to conduct continuous var-iables intergroup comparisons among patients without CAD, non-obstructive CAD but a LSb 5 and non-obstructive CAD but a LS N 5. Pearson's chi-square test (χ2) was used for categorical variables
com-parison. Time-to-event analysis for the study endpoints were calculated using univariable Cox proportional-hazards models reporting hazard ratios (HR) with 95% confidence intervals (95% CI). Multivariable Cox proportional hazards models were also constructed with variables based on clinical judgment univariate analysis results. All the analyses were performed evaluating combined endpoints (MI, MI plus all cause of death,). To avoid overfitting and multicollinearity issues, we devel-oped four different models, for all different combined endpoints. The first model was adjusted for the CT-LeSc and the Framingham risk score. The second model was adjusted for the SIS and the Framingham risk score. The third model was adjusted for the CT-LeSc and baseline clinical characteristics. The fourth model was adjusted for the SIS and baseline clinical characteristics.
A sub-analysis were performed in patients in which CACS was avail-able; a prognostically validated cut-offN400 was used as previously suggested[13]. Moreover we performed a separate sub-analysis for pa-tients with and without chest pain at baseline. Of note, in the analysis of symptomatic subjects the Morise score was included in model 1 and 2, instead of the Framingham score.
Survival curves were calculated using the Kaplan–Meier method for population stratified by the presence of non-obstructive CAD and the CT-LeSc, with each survival curve compared using the log-rank test. A two-tailed p value ofb0.05 was considered statistically significant. The comparison between performance of the CT-LeSc and SIS added to a baseline model was further quantified by a continuous net reclassifica-tion index (cNRI)[14].
3. Results
3.1. Patient characteristics and MACE
Indications for CCTA were chest pain (1200 patients, 49.9%), multiple CAD risk factors (595 patients, 24.7%), and equivocal or abnormal stress test results (607 patients, 25.3%). Mean pre-test probability of CAD was low-to-intermediate (mean Morise score 11.6 ± 4.2). The mean dura-tion of follow-up was 59.8 ± 13.9 months, up to 96 months (Table 1). One-hundred and eighty-three patients exhibited events during follow-up (53 MI, 99 all-cause deaths and 31 late revascularizations). 3.2. Univariate predictors of events
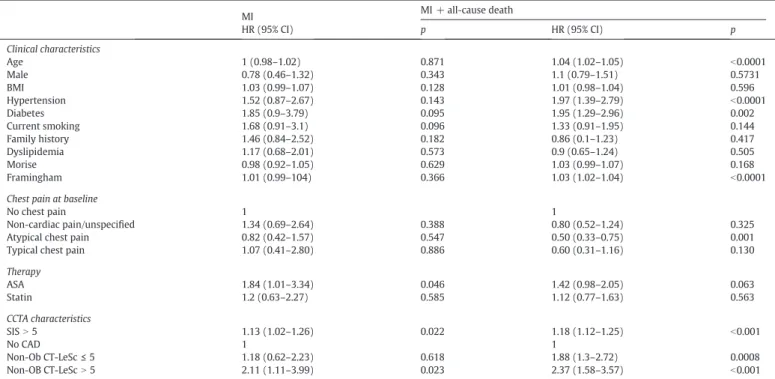
Among clinical characteristics, therapy with aspirin was the only pre-dictor of MI, whereas hypertension and diabetes were prepre-dictors of MI plus all-cause death. Among CCTA data, a SISN 5 and non-obstructive CAD with a CT-LeScN 5 were predictors of MI, whereas a SIS N 5, non-obstructive CAD with a CT-LeSc≤ 5 and non-obstructive CAD with a CT-LeScN 5 were predictors of MI plus all-cause death (Table 2). 3.3. Multivariate predictors of events
The only significant independent predictor of MI was non-obstructive CAD with a CT-LeScN 5 (HR 2.84 and 2.98 in model 1 and model 3, respectively). The independent predictors of MI plus all-cause death were the Framingham score (HR 1.02 and 1.03 in model 1 and model 2, respectively), age (HR 1.04 and 1.05 in model 3 and model 4, respectively), diabetes (HR 1.84 and 1.86 in model 3 and model 4, respectively), a SISN 5 (HR 1.95 in model 2, HR not significant in model 4), non-obstructive CAD with a CT-LeSc≤ 5 (HR 2.05 and 1.55 in model 1 and model 3, respectively) and non-obstructive CAD with a CT-LeScN 5 (HR 2.48 and 1.94 in model 1 and model 3, respectively) (Table 3).
Table 1
Clinical and CCTA baseline characteristics.
All patients (n = 2402)
No CAD (n = 1450)
Non-obstructive CAD with LS≤ 5 (n = 611)
Non-obstructive CAD with LSN 5 (n = 341) Clinical characteristics Age 56 ± 12 53 ± 12 61 ± 10⁎ 63 ± 11⁎,ç Male 1208 (50.3) 657 (45.3) 346 (56.7)⁎ 205 (60.1)⁎ BMI 28 ± 5.49 27.79 ± 5.39 28.09 ± 5.11 28.61 ± 6.40 Hypertension 1302 (54.2) 674 (46.5) 394 (64.5)⁎ 234 (68.6)⁎ Diabetes 252 (10.5) 116 (8) 74 (12.1)§ 62 (18.1)⁎,ç Current smoking 425 (17.7) 250 (17.2) 105 (17,2) 70 (20.53) Family history 798 (33.2) 492 (33.9) 188 (30,8) 118 (34.6) Dyslipidemia 1207 (50.3) 641 (44.2) 342 (56)⁎ 224 (65.7)⁎,ç Morise 11.57 ± 4.16 10.70 ± 4.42 12.68 ± 3.37⁎ 13.19 ± 3.31⁎ Framingham 11.99 ± 9.63 9.74 ± 7.78 14.83 ± 10.46⁎ 16.27 ± 11.98⁎
Chest pain at baseline
No chest pain 1053 (43.8) 590 (40.7) 308 (50.4) 155 (45.4)
Non-cardiac/unspecified pain 418 (17.4) 296 (20.4) 79 (12.9) 43 (12.6)
Atypical chest pain 737 (30.7) 436 (30.1) 184 (30.1) 117 (34.3)
Typical chest pain 194 (8.1) 128 (8.8) 40 (6.5) 26 (7.6)
Therapy ASA 503 (20.9) 265 (18.3) 137 (22.4)§ 101 (29.6)⁎,ç Statin 506 (21.1) 226(15.6) 161 (26.4)⁎ 119 (34.8)⁎,ç CCTA characteristics SIS 1.08 ± 1.89 0 1.61 ± 0.88⁎ 4.64 ± 2.36⁎,o
Continuous variable are expressed as mean ± SD; Ordinal variables are expressed as n (%); BMI: body mass index; SIS: segment involvement score; LS: Leaman score; CAD: coronary artery disease. ⁎ p b 0,0001 vs no CAD. o pb 0,0001 vs LS b 5. § pb 0,05 vs no CAD. ç pb 0,05 vs LS b 5.
3.4. Survival analysis
When MI only was considered as outcome, the event-free survival rates were 98% in patients without CAD, 98% in patients with non-obstructive CAD and a CT-LeSc≤ 5 and 95% in patients with
non-obstructive CAD and a CT-LeSc N 5 (log-rank p value = 0.01)
(Figure 1A). When the end-point of MI plus all-cause mortality was used, event-free survival rates were 97%, 92% and 88% in patients
without CAD, with non-obstructive CAD and a CT-LeSc ≤ 5 and
with non-obstructive CAD and a CT-LeScN 5, respectively (log-rank p valueb 0.0001) (Figure 1B).
3.5. Reclassification index
The net reclassification analysis (Table 4) showed that a CT-LeScN 5 is able to correctly reclassify a significant proportion of patients (0.28 and 0.23for MI and MI plus all-cause mortality, respectively), in compar-ison with the baseline model including age, male gender, diabetes, hypertension, smoking, dyslipidemia, and family history of premature CAD. Conversely, reclassification using a SIS N 5 was not statistically sig-nificant in any models.
3.6. Coronary artery calcium score sub-analysis
Coronary artery calcium score (CACS) was available in 1537 patients (64%). CACSN 400 was identified in 67 patients (4.4%) in the entire cohort; CACSN 400 was present in 6 patients (1.6%) with CT LeSc ≤ 5 and in 61 subjects (22.9%) among those with CT LeScN 5. At univariate analysis neither CACSN 400 or SIS N 5 was associated with MI (HR 1.85; 95% CI 0.57–5.98, p = 0.306 and 0.89; 0.22–3.68, p = 0.896), while only CT-LeScN 5 was a significantly predictors of MI (HR 2.09; 95% CI 1.02– 4.30, p = 0.04). When the composite endpoint including MI and all cause of death was considered, CACSN 400, SIS N 5 and CT-LeSc N 5
Table 2 Univariate analysis. MI MI + all-cause death HR (95% CI) p HR (95% CI) p Clinical characteristics Age 1 (0.98–1.02) 0.871 1.04 (1.02–1.05) b0.0001 Male 0.78 (0.46–1.32) 0.343 1.1 (0.79–1.51) 0.5731 BMI 1.03 (0.99–1.07) 0.128 1.01 (0.98–1.04) 0.596 Hypertension 1.52 (0.87–2.67) 0.143 1.97 (1.39–2.79) b0.0001 Diabetes 1.85 (0.9–3.79) 0.095 1.95 (1.29–2.96) 0.002 Current smoking 1.68 (0.91–3.1) 0.096 1.33 (0.91–1.95) 0.144 Family history 1.46 (0.84–2.52) 0.182 0.86 (0.1–1.23) 0.417 Dyslipidemia 1.17 (0.68–2.01) 0.573 0.9 (0.65–1.24) 0.505 Morise 0.98 (0.92–1.05) 0.629 1.03 (0.99–1.07) 0.168 Framingham 1.01 (0.99–104) 0.366 1.03 (1.02–1.04) b0.0001
Chest pain at baseline
No chest pain 1 1
Non-cardiac pain/unspecified 1.34 (0.69–2.64) 0.388 0.80 (0.52–1.24) 0.325
Atypical chest pain 0.82 (0.42–1.57) 0.547 0.50 (0.33–0.75) 0.001
Typical chest pain 1.07 (0.41–2.80) 0.886 0.60 (0.31–1.16) 0.130
Therapy ASA 1.84 (1.01–3.34) 0.046 1.42 (0.98–2.05) 0.063 Statin 1.2 (0.63–2.27) 0.585 1.12 (0.77–1.63) 0.563 CCTA characteristics SISN 5 1.13 (1.02–1.26) 0.022 1.18 (1.12–1.25) b0.001 No CAD 1 1 Non-Ob CT-LeSc≤ 5 1.18 (0.62–2.23) 0.618 1.88 (1.3–2.72) 0.0008 Non-OB CT-LeScN 5 2.11 (1.11–3.99) 0.023 2.37 (1.58–3.57) b0.001
BMI: body mass index; SIS: segment involvement score; CT-LeSc: CT-Adapted Leaman Score; Non-Ob: non-obstructive coronary artery disease (stenosisb50%); MI: non-fatal myocardial infarction; CAD: coronary artery disease.
Table 3 Multivariate analysis. MI MI + all-cause death HR (95% CI) p HR (95% CI) p Model 1 Framingham 1.01 (0.98–1.04) 0.4316 1.02 (1.01–1.04) 0.0006 ASA 1.51 (0.82–2.77) 0.1860 1.32 (0.91–1.93) 0.1402 Non-Ob CT-LeScb 5 1.70 (0.84–3.47) 0.1444 2.05 (1.36–3.01) 0.0006 Non-Ob CT-LeScN 5 2.84 (1.38–5.85) 0.0049 2.48 (1.58–3.90) 0.0001 Model 2 ASA 1.67 (0.91–3.05) 0.0995 1.41 (0.98–2.06) 0.0672 Framingham 1.02 (0.99–1.05) 0.1011 1.03 (1.02–1.04) b0.0001 SISN 5 0.85 (0.20–3.35) 0.8252 1.95 (1.09–3.49) 0.0244 Model 3 Age 0.99 (0.96–1.02) 0.7768 1.04 (1.02–1.06) b0.0001 Male 0.67 (0.35–1.28) 0.2363 0.91 (0.62–1.34) 0.6515 BMI 0.98 (0.93–1.04) 0.6053 0.99 (0.95–1.02) 0.6837 Hypertension 1.13 (0.57–2.26) 0.7140 1.39 (0.89–2.14) 0.1414 Diabetes 1.41 (0.60–3.32) 0.4242 1.84 (1.13–2.99) 0.0138 Current smoking 1.11 (0.50–2.43) 0.7914 1.42 (0.89–2.26) 0.1342 Dyslipidemia 1.10 (0.57–2.11) 0.7719 0.74 (0.50–1.09) 0.1342 Family history 1.23 (0.65–2.31) 0.5184 1.06 (0.71–1.59) 0.7598 ASA 1.42 (0.73–2.76) 0.2937 1.08 (0.71–1.65) 0.6983 Non-Ob CT-LeScb 5 1.64 (0.73–3.65) 0.2252 1.55 (0.97–2.45) 0.0627 Non-Ob CT-LeScN 5 2.98 (1.35–6.58) 0.0070 1.94 (1.18–3.12) 0.0095 Model 4 Age 1.01 (0.98–1.03) 0.5466 1.05 (1.03–1.07) b0.0001 Male 0.79 (0.42–1.49) 0.4813 0.99 (0.68–1.46) 0.9953 BMI 0.98 (0.93–1.04) 0.7247 0.99 (0.95–1.03) 0.7503 Hypertension 1.19 (0.59–2.37) 0.6170 1.46 (0.94–2.25) 0.0900 Diabetes 1.52 (0.65–3.55) 0.3278 1.86 (1.14–3.02) 0.0125 Current smoking 1.20 (0.55–2.64) 0.6413 1.49 (0.93–2.35) 0.0957 Dyslipidemia 1.21 (0.63–2.32) 0.5568 0.77 (0.52–1.13) 0.1878 Family history 1.28 (0.68–2.39) 0.4402 1.08 (0.72–1.61) 0.7032 ASA 1.54 (0.79–2.96) 0.2001 1.13 (0.74–1.72) 0.5560 SISN 5 0.83 (0.19–3.52) 0.8043 1.38 (0.74–2.56) 0.3083
were all significative predictors of events (HR 3.99, HR 2.38 and HR 2.73, respectively; pb 0.001).
At multivariate analysis CACSN 400 remains a significantly predictor of MI + all cause of death when adjusted for Framingham risk score (HR 3.04; 95% CI 1.72–5.36, p b 0.001) and for baseline clinical characteristics (HR 2.05; 95% CI 1.14–3.68, p = 0.017); SIS N 5 remains significantly as-sociated to MI + all cause of death only when adjusted for Framingham risk score (HR 1.96; 95% CI 1.09–3.55, p = 0.027), but not when adjusted for clinical baseline characteristics.
Of note, only CT-LeScN 5 was significantly associated to MI when ad-justed both for Framingham risk score (HR 2.68; 95% CI 1.18–6.12, p = 0.019) and for baseline clinical characteristics (HR 3.13; 95% CI 1.29– 7.53, p = 0.012) at multivariate analysis. When the composite endpoint including MI + all cause of death was considered CL-LeScN 5 was still associated to events both when adjusted for Framingham risk score (HR 2.52; 95% CI 1.52–4.16, p b 0.001) and for baseline characteristics (HR 1.79, 95% CI 1.05–3.05, p = 0.038).
In this subgroup of patients with CACS reported, the event free sur-vival rates were 98% in those with CT-LeScb 5 and 95% in those with CT-LeScN 5 (log-rank p = 0.0289) (Figure 2B); on the contrary CACSN 400 score was not significantly associated to worst survival rates (Figure 2A).
3.7. Asymptomatic patients vs symptomatic patients
Among the entire cohort 1053 patients (43.8%) did not report chest pain at baseline, while 1349 patients (56.2%) were symptomatic at the time of CCTA.
A separate sub-analysis in asymptomatic subjects showed that at univariate analysis there were no predictor of MI; on the contrary, age, hypertension, diabetes and the Framingham score were the clinical characteristics associated to MI + all cause of death, while among CT pa-rameters both SISN 5 and CT-LeSc N 5 were associated to MI + all cause of death (Table 5).
In the subgroups of patients with chest pain at baseline only CT-LeScN 5 was associated to MI at univariate (HR 2.5; 95% CI 1.13–5.75, p = 0.025), while age, hypertension and the Morise score were associ-ated to MI + all cause of death, but only CT-LeScN 5 (HR 2.53; 95% CI 1.42–4.48, p = 0.002) was found to be associated to this composite end-point among CCTA variables (Table 6).
At multivariate analysis SISN 5 was not associated to endpoints both in asymptomatic and symptomatic patients. On the contrary CT-LeScN 5 was found to be a predictor of MI in symptomatic patients ( HR 2.63 and 2.76 in Model 1 and 3, respectively) and to be associated with MI + All cause of death both in asymptomatic and symptomatic patients only when adjusted for Framingham or Morise score (HR 2.56 and 2.39 in asymptomatic and symptomatic patients, respectively), but not when clinical baseline characteristics were evaluated separately (Table 7). 4. Discussion
Coronary CTA has been demonstrated to be accurate for the detec-tion of non-obstructive CAD and coronary atherosclerosis when com-pared to coronary intravascular ultrasound[15]. Detection of non-obstructive CAD, which may be considered an unique feature of CCTA among other non-invasive imaging modalities, has relevant prognostic implications. Indeed, it may identify a population that has an higher event-free survival rate as compared to that of patients with obstructive disease but lower than that of patients with normal coronaries[4,5,16, 17]. In order to better stratify the prognosis among the large and hetero-geneous cohort of patients with non-obstructive CAD, different coro-nary plaque scores have been proposed. Among them, the SIS and SSS demonstrated a remarkable prognostic value[4,18]. Particularly, a single-center study by Bittencourt et al. demonstrated that among pa-tients with obstructive CAD, a greater extent of non-obstructive plaques, as quantified by SIS, was associated with a higher event rate[16]. 4.1. CT adapted-Leaman score
A recently proposed plaque score, the CT-LeSc based on lesion local-ization, plaque composition and degree of stenosis, demonstrated to im-prove the prognostic stratification of non-obstructive CAD in an another single-center study[6]. To the best of our knowledge, this is thefirst prospective international multicenter studyfinalized to evaluate if the CT-LeSc is able to stratify the long-term prognosis in a selected but large patient cohort with non-obstructive lesions. The mainfindings of the study are that the CT-LeSc allows to distinguish within patients with non-obstructive CAD those with a cardiac event risk similar to that shared by patients without plaques from those with a less favorable
Fig. 1. Kaplan-Meier survival curves for MI (A) showing the event-free survival rates of 98% in patients with non-obstructive CAD and a CT-LeSc≤ 5 and 95% in patients with non-obstructive CAD and a CT-LeScN 5 (log-rank p value = 0.01). When the end point was MI plus all-cause mortality (B), event-free survival rates were 97%, 92% and 88% in patients without CAD, with non-obstructive CAD and a CT-LeSc≤ 5 and with non-obstructive CAD and a CT-LeSc N 5, respectively (log-rank p value b 0.0001). MI: myocardial infarction; CAD: coronary artery disease; CT-LeSc: computed tomography adapted Leaman score.
Table 4
Net Reclassification Index for SIS N 5 and CT-LeSc N 5 for prediction of composite endpoints.
MI MI + all-cause death cNRI cNRI 95% CI p cNRI cNRI 95% CI p
BL − − − − − −
BL + SISN 5 0.15 −0.09–0.40 0.271 −0.039 −0.19–0.11 0.648 BL + CT-LeScN 5 0.28 0.02–0.54 0.046 0.23 0.07–0.39 0.006
prognosis. Moreover, the CT-LeSc appears to be superior to the SIS, de-spite the latter already showed to possess a good prognostic value. In particular, analyzing the primary outcomes of the study we found that a CT-LeScN 5 was an univariate predictor of MI and MI plus all-cause death and the only multivariate predictor of MI.
4.2. CT-LeSc vs SIS
The CT-LeSc appears to be superior to the SIS that exhibited HR sys-tematically lower than the CT-LeSc at both univariate and multivariate analysis. This is confirmed by the net reclassification analysis showing that the CT-LeSc, but not the SIS, was able to correctly reclassify a signif-icant proportion of patients vs. a baseline model including age, gender and risk factors for both primary and secondary endpoints.
4.3. CACS and CT-LeSc
In the sub-group of patients with calcium score, CACSN 400 has been confirmed to be a predictor of composite end-point including all cause of death, but only CT-LeSc appeared to correctly identify patients at higher risk of MI. Thesefindings could be explained by recent studies, suggesting that non-calcified plaques may be associated to higher risk of acute coronary syndrome when compared to calcified ones[19].
4.4. Asymptomatic and symptomatic patients
Approximately half of the patients included in this study were asymptomatic for chest pain at the time of CCTA. In order to better clar-ify the possible role of CCTA in the evaluation of asymptomatic patients we performed a specific separate analysis in asymptomatic vs symp-tomatic patients. Of note we have found no clinical or CCTA parameters resulting to be significantly associated to MI in asymptomatic patients. On the contrary in symptomatic patients only CT-LeScN 5 was associat-ed to MI both at univariate and multivariate analyses. Thisfindings sug-gest that CT-LeSc could be an important tool to discriminate patients at higher risk of MI among those symptomatic for chest pain, even if CCTA results to be negative for significative stenosis (N50%).
4.5. Survival analysis
Analyzing the survival curves for primary endpoints, we found that MI-free survival rate was 98% for patients with normal coronary arteries and for those with non-obstructive CAD and a CT-LeSc≤ 5. Conversely, the survival rate fell to 95% in the presence of a CT-LeScN 5, confirming the power of the CT-LeSc in stratifying the prognosis of patients with non-obstructive lesions. Adding all-cause mortality to MI in the survival analysis, patients with non-obstructive stenosis and a low CT-LeSc
Fig. 2. Kaplan Meyer survival curves for MI using CACS (A) and CT-LeSc (B). CACSN 400 was not able to stratify patients at higher risk of MI. On the contrary, patients with CT-LeSc N 5 was associated to an event free survival rate of 95%, that was found to be significantly lower than patients with CT-LeSc b 5 (log-rank p = 0.0289). MI: myocardial infarction; CACS: coronary artery calcium score; CT-LeSc: computed tomography adapted Leaman score.
Table 5
Univariate analysis for asymptomatic patients.
MI MI + all-cause death HR (95% CI) p HR (95% CI) p Clinical characteristics Age 1.01 (0.98–1.04) 0.578 1.03 (1.01–1.05) 0.001 Male 0.68 (0.31–1.52) 0.356 0.93 (0.60–1.43) 0.717 BMI 1.04 (0.98–1.09) 0.182 1.02 (0.98–1.05) 0.424 Hypertension 1.63 (0.70–3.78) 0.261 1.83 (1.15–2.94) 0.011 Diabetes 1.43 (0.43–4.79) 0.556 2.05 (1.15–3.63) 0.015 Current smoking 0.99 (0.34–2.89) 0.996 0.98 (0.55–1.75) 0.962 Family history 1.26 (0.54–2.93) 0.597 0.77 (0.46–1.29) 0.333 Dyslipidemia 0.62 (0.27–1.42) 0.263 0.67 (0.40–1.01) 0.052 Framingham 0.98 (0.93–1.03) 0.404 1.02 (1.01–1.03) 0.048 Therapy ASA 1.50 (0.56–3.99) 0.411 1.69 (1.03–2.77) 0.038 Statin 0.70 (0.20–2.40) 0.572 0.97 (0.55–1.72) 0.931 CCTA characteristics No CAD 1 1 SISN 5 1.94 (0.46–8.22) 0.367 2.02 (1.06–4.56) 0.034 Non-Ob CT-LeSc≤ 5 1.12 (0.44–2.85) 0.807 2.11 (1.29–3.42) 0.003 Non-OB CT-LeScN 5 1.61 (0.56–4.53) 0.376 2.17 (1.22–3.86) 0.009 Table 6
Univariate analysis for symptomatic patients.
MI MI + All-cause death HR (95% CI) p HR (95% CI) p Clinical characteristics Age 1.01 (0.97–1.03) 0.921 1.04 (1.02–1.07) b0.001 Male 0.86 (0.43–1.74) 0.862 0.74 (0.46–1.22) 0.246 BMI 1.02 (0.95–1.08) 0.641 1.01 (0.96–1.05) 0.754 Hypertension 1.15 (0.57–2.31) 0.696 1.76 (1.06–2.95) 0.031 Diabetes 1.93 (0.9–4.67) 0.149 1.83 (0.98–3.42) 0.059 Current smoking 1.49 (0.67–3.32) 0.323 1.39 (0.79–2.44) 0.249 Family history 1.38 (0.68–2.79) 0.373 1.05 (0.63–1.72) 0.866 Dyslipidemia 1.51 (0.74–3.08) 0.259 1.40 (0.87–2.29) 0.181 Morise 1.01 (0.92–1.09) 0.946 1.08 (1.02–1.16) 0.016 Therapy ASA 1.82 (0.84–3.93) 0.129 1.18 (0.66–2.08) 0.571 Statin 1.31 (0.59–2.87) 0.513 1.29 (0.76–2.18) 0.354 CCTA characteristics No CAD 1 1 SIS – – 2.03 (1.01–5.31) 0.051 Non-Ob CT-LeSc≤ 5 1.20 (0.49–2.92) 0.677 1.43 (0.80–2.57) 0.229 Non-OB CT-LeScN 5 2.54 (1.13–5.75) 0.025 2.53 (1.42–4.48) 0.002
exhibited a prognosis that was halfway between that of patients with-out plaques and that of patients with a CT-LeScN 5.
4.6. Future strategies for early detection of non-obstructive CAD
Previous studies have proposed that early identification of non-obstructive CAD with CCTA may lead to a more aggressive strategy to control cardiovascular risk factors and to improve clinical follow-up[4, 20]. Recently, a sub-study of CONFIRM performed in a cohort of patients receiving baseline statin and aspirin treatment showed that statin ther-apy was associated with a significant mortality reduction in patients with non-obstructive CAD but had no impact on patients without CAD [18]. These are valid arguments in support of the identification of pa-rameters, such as the CT-LeSc allowing to stratify the long-term progno-sis of the large and heterogeneous group of patients in whom CCTA shows non-obstructive CAD. Moreover, recent studies demonstrated the prognostic value of plaque characterization by CCTA. Indeed, this non-invasive imaging modality is able to identify some features, such as vessel positive remodeling and low-attenuation plaques, that have been associated with a higher risk of cardiac events[19]. High-risk plaques can be detected by CCTA and are independent predictors of fatal and non-fatal acute coronary syndrome, while positive remodeling has been observed in coronary stenoses that, regardless of the degree of narrowing, were found to be functionally important by invasive frac-tionalflow reserve[21]. Therefore, additional studies are needed to in-tegrate the CT-LeSc with other features such as positive remodeling or eventually with non-invasive FFR by CCTA for improving the prognostic characterization of patients without obstructive coronary lesions. 4.7. Study limitations
In interpreting these data some limitations should be considered. First, management decisions in all patient, such as medical therapies or revascularization, were left to the discretion of the referring physi-cians. Because some therapies (i.e. aspirin, statin) may have a positive effect on patient outcomes and were commonly used in patients with and without plaques, we expect that differences between subgroups would be even greater in the absence of such treatments. Second, we in-cluded all-cause mortality in the primary and secondary endpoints given its unparalleled clinical importance and freedom from ascertain-ment bias. However, as specific causes of death for each patient were not uniformly available at all sites, the true proportion of deaths that
could attributable to cardiovascular events in our patients is unknown. Third, this study included a cohort of patients who were referred for CCTA because of suspected CAD and were often symptomatic. Although it is unlikely that our patient symptoms were related to non-obstructive CAD, generalization of this studyfindings to asymptomatic patients re-mains uncertain. Fourth, data on coronary calcium score were not in-cluded in the analysis because they were available for two third only of the study population.
5. Conclusion
The CT-adapted Leaman score is an independent predictor of major acute cardiac events and allows to distinguish, among a population with non-obstructive CAD, patients with risk of cardiac events similar to those without plaques from patients with a less favorable prognosis. Conflict of interest
The authors report no relationships that could be construed as a con-flict of interest.
References
[1] F. Bamberg, W.H. Sommer, V. Hoffmann, et al., Meta-analysis and systematic review of the long-term predictive value of assessment of coronary atherosclerosis by contrast-enhanced coronary computed tomography angiography, J. Am. Coll. Cardiol. 57 (24) (2011) 2426–2436.
[2] A. Pen, Y. Yam, L. Chen, et al., Discordance between Framingham risk score and ath-erosclerotic plaque burden, Eur. Heart J. 34 (14) (2013) 1075–1082.
[3] G.P. de Araújo, H.M. Garcia-Garcia, M.S. Carvalho, et al., Diabetes as an independent predictor of high atherosclerotic burden assessed by coronary computed tomogra-phy angiogratomogra-phy: the coronary artery disease equivalent revisited, Int. J. Cardiovasc. Imaging 29 (5) (2013) 1105–1114.
[4] D. Andreini, G. Pontone, S. Mushtaq, et al., A long-term prognostic value of coronary CT angiography in suspected coronary artery disease, JACC Cardiovasc. Imaging 5 (7) (2012) 690–701.
[5] J.K. Min, A. Dunning, F.Y. Lin, et al., Age- and sex-related differences in all-cause mortality risk based on coronary computed tomography angiographyfindings re-sults from the International Multicenter CONFIRM, J. Am. Coll. Cardiol. 58 (8) (2011) 849–860.
[6] S. Mushtaq, G.P. De Araujo, H.M. Garcia-Garcia, et al., Long-term prognostic effect of coronary atherosclerotic burden: validation of the computed tomography-Leaman score, Circ. Cardiovasc. Imaging 8 (2) (2015) e002332.
[7] J.K. Min, A. Dunning, F.Y. Lin, et al., Rationale and design of the CONFIRM (COronary CT Angiography EvaluatioN For Clinical Outcomes: An InteRnational Multicenter) Registry, J. Cardiovasc. Comput. Tomogr. 5 (2) (2011) 84–92.
[8] J. Leipsic, S. Abbara, S. Achenbach, et al., SCCT guidelines for the interpretation and reporting of coronary CT angiography: a report of the Society of Cardiovascular Computed Tomography Guidelines Committee, J. Cardiovasc. Comput. Tomogr. 8 (5) (2014) 342–358.
[9] S. Abbara, A. Arbab-Zadeh, T.Q. Callister, et al., SCCT guidelines for performance of coronary computed tomographic angiography: a report of the Society of Cardiovas-cular Computed Tomography Guidelines Committee, J. Cardiovasc. Comput. Tomogr. 3 (2) (2009) 190–204.
[10] W.G. Austen, J.E. Edwards, R.L. Frye, et al., A reporting system on patients evaluated for coronary artery disease. Report of the Ad Hoc Committee for Grading of Coro-nary Artery Disease, Council on Cardiovascular Surgery, American Heart Association, Circulation 51 (4Suppl) (1975) 5–40.
[11] G.P. de Araújo, H.M. Garcia-Garcia, H. Dores, et al., Coronary computed tomography angiography-adapted Leaman score as a tool to noninvasively quantify total coro-nary atherosclerotic burden, Int. J. Cardiovasc. Imaging 29 (7) (2013) 1575–1584.
[12] K. Thygesen, J.S. Alpert, H.D. White, et al., Joint ESC/ACCF/AHA/WHF Task Force for the Redefinition of Myocardial. Universal definition of myocardial infarction, J. Am. Coll. Cardiol. 50 (22) (2007) 2173–2195.
[13] H.S. Hecht, Coronary artery calcium scanning: past, present, and future, JACC Cardiovasc. Imaging 5 (8) (2015) 579–596.
[14] M.J. Pencina, R.B. D'Agostino Sr., E.W. Steyerberg, Extensions of net reclassification improvement calculations to measure usefulness of new biomarkers, Stat. Med. 30 (1) (2011) 11–21.
[15]J.E. van Velzen, J.D. Schuijf, F.R. de Graaf, et al., Diagnostic performance of non-invasive multidetector computed tomography coronary angiography to detect cor-onary artery disease using different endpoints: detection of significant stenosis vs. detection of atherosclerosis, Eur. Heart J. 32 (5) (2011) 637–645.
[16] M.S. Bittencourt, E. Hulten, B. Ghoshhajra, et al., Prognostic value of nonobstructive and obstructive coronary artery disease detected by coronary computed tomogra-phy angiogratomogra-phy to identify cardiovascular events, Circ. Cardiovasc. Imaging 7 (2) (2014) 282–291.
[17] F.Y. Lin, L.J. Shaw, A.M. Dunning, et al., Mortality risk in symptomatic patients with nonobstructive coronary artery disease: a prospective 2-center study of 2,583
Table 7
Multivariate analysis for asymptomatic and asymptomatic patients.
MI MI + all-cause death HR (95% CI) p HR (95% CI) p Asymptomatic patients Model 1⁎ Non-Ob CT-LeScN 5 3.34 (0.97–11.44) 0.059 2.56 (1.31–4.99) 0.006 Model 2⁎ SISN 5 2.42 (0.55–10.73) 0.248 1.80 (0.82–3.95) 0.144 Model 3§ Non-Ob CT-LeScN 5 3.15 (0.84–11.78) 0.089 1.50 (0.73–2.94) 0.227 Model 4§ SISN 5 1.19 (0.26–5.51) 0.821 0.98 (0.41–2.35) 0.967 Symptomatic patients Model 1# Non-Ob CT-LeScN 5 2.63 (1.07–6.46) 0.035 2.39 (1.29–4.42) 0.006 Model 2# SISN 5 – – 2.03 (0.85–4.82) 0.110 Model 3§ Non-Ob CT-LeScN 5 2.76 (1.06–7.25) 0.040 1.81 (0.94–3.51) 0.075 Model 4§ SISN 5 – – 1.54 (0.64–1.86) 0.807
§Adjusted for ASA and baseline clinical characteristics. #
Adjusted for ASA and Morise score. ⁎ Adjusted for ASA and Framingham score.
patients undergoing 64-detector row coronary computed tomographic angiogra-phy, J. Am. Coll. Cardiol. 58 (5) (2011) 510–519.
[18] B.J. Chow, G. Small, Y. Yam, et al., Prognostic and therapeutic implications of statin and aspirin therapy in individuals with nonobstructive coronary artery disease: re-sults from the CONFIRM registry, Arterioscler. Thromb. Vasc. Biol. 35 (4) (2015) 981–989.
[19] S. Motoyama, H. Ito, M. Sarai, et al., Plaque characterization by coronary computed tomography angiography and the likelihood of acute coronary events in mid-term follow-up, J. Am. Coll. Cardiol. 66 (4) (2015) 337–346.
[20]D. Andreini, G. Pontone, S. Mushtaq, et al., Prognostic value of multidetector com-puted tomography coronary angiography in diabetes: excellent long-term progno-sis in patients with normal coronary arteries, Diabetes Care 36 (7) (2013) 1834–1841.
[21] Park HB, Heo R, ó Hartaigh B et al. Atherosclerotic plaque characteristics by CT angi-ography identify coronary lesions that cause ischemia: a direct comparison to frac-tionalflow reserve. JACC Cardiovasc. Imaging 2015;8(1):1-10.