Detection: an Object Oriented
Approach, Münster, Germany
Thesis
Master of Science in Geospatial Technologies
Tanmoy Das
Institute for Geoinformatics
University of Münster
March 2009
Münster, Germany
Tanmoy Das
Thesis submitted to the Institute for Geoinformatics, University of Münster in partial fulfillment of the requirements for the degree of Masters of Science in Geospatial
Technologies
Course Title: Geospatial Technologies
Level: Master of Science (M.Sc.)
Course Duration: September 2007 - March 2009
Consortium Partners: University of Münster (Germany) Universitat Jaume I (Spain)
Universidade Nova de Lisboa (Portugal)
Supervisors: Prof. Dr. Edzer Pebesma
Dr. Torsten Prinz
Prof. Dr. Mário Caetano
Date of Submission: 2nd March, 2009
Land use / land cover (LULC) change detection based on remote sensing (RS) data has been established as an indispensible tool for providing suitable and wide-ranging information to various decision support systems for natural resource management and sustainable development. LULC change is one of the major influencing factors for landscape changes. There are many change detection techniques developed over decades, in practice, it is still difficult to develop a suitable change detection method especially in case of urban and urban fringe areas where several impacts of complex factors are found including rapid changes from rural land uses to residential, commercial, industrial and recreational uses. Although these changes can be monitored using several techniques of RS application, adopting a suitable technique to represent the changes accurately is a challenging task. There are a number of challenges in RS application for analysis of LULC change detection. This study applies object-oriented (OO) method for mapping LULC and performing change detection analysis using post-classification technique.
This study consists of four major parts. The first part is implementing the OO method for mapping the LULC of the study area based on three consecutive satellite images: Landsat TM (1990), Landsat ETM+ (2000) and ASTER (2005). Principal component analysis (PCA) and image fusion are used to enhance the change assessment. Secondly, classification accuracy is another section of interest since the aim of this work is to accurately characterize the LULC changes. Due to unavailability of ground truth or reference data obtained at the time of image acquisition, the error matrix for accuracy is utilized supplied by the Definiens software based on training samples. An alternative method of accuracy assessment has also been adopted from the concept of the CORINE Land Cover (CLC) 2000 programme to justify the accuracy more robustly. The third part of this study focuses on LULC change detection analysis based on three classified LULC layers from (multi-temporal) images of 1990, 2000 and 2005. There are many methods of LULC change detection amongst which the post-classification comparison method has been implemented for this study. The fourth and final part is an additional chapter focusing on OO classification of very high resolution (aerial) image and its accuracy assessment based on a high quality existing reference layer. The study area is the Münster “Rieselfelder” (sanctuary) and its surroundings which covers some fringe area of Münster city, Germany and covers an area of 100 km square. Even though the study area contains some part of the Münster city urban fringe area, it can be considered as rural area as a whole.
The present study exhibits a great potential for accurate LULC change detection using object oriented image classification method using moderate to high resolution satellite images. It also shows us some technical steps that can influence the accuracy or enhance the change assessment. Although the preliminary results in this work seem to be promising, more study in this regard is required to improve classification results by utilizing OO method using very high resolution (VHR) satellite imagery in future.
Key Words: Land Use/ Land Cover (LULC), Change Detection, Remote Sensing, Object
I am grateful to the European Union and Erasmus Mundus Consortium (Westfälische Wilhelms-Universität Münster, Germany; Universitat Jaume I, Spain and Universidade Nova de Lisboa, Portugal) for awarding me the scholarship to undertake this course. It is a great opportunity for my lifetime experiences.
I would like to extend my thanks to my supervisors Prof. Dr. Edzer Pebesma, Dr. Torsten Prinz and Prof. Dr. Mário Caetano for their guidance, kind support and useful suggestions to bring the research into shape right from the conception stage to the finalization of thesis. I have gained a lot of scientific experiences from them. Special thanks to Dr. Torsten Prinz for providing me all the data required for the thesis work. I would like to acknowledge Prof. Dr. Pedro Cabral for providing me some valuable suggestions during the thesis defense.
I am pleased to extend my gratitude to Prof. Dr. Michael Gould, Prof. Dr. Joaquín Huerta, Prof. Dr. Werner Kuhn, Dr. Christoph Brox, Mrs. Dolores C. Apanewicz, and Ms. Caroline V. Wahle for their support and hospitality during my stay in Spain and Germany. I am also grateful to the all IFGI members for maintaining friendship relationship and inspiring attitude. My thanks and best wishes express to my classmates who are from around the globe and lovely friends for sharing their knowledge and giving inspirations during last eighteen months in Europe.
Finally, my heartfelt gratitude goes to my mother for support and encouragement during my stay away from home.
Table of contents
______________________________________________________________________
1 INTRODUCTION --- 1 1.1PROBLEM DEFINITION--- 1 1.2RESEARCH OBJECTIVES --- 2 1.3RESEARCH QUESTIONS--- 21.4SCOPE OF THE WORK--- 2
1.4THESIS OUTLINE--- 3
2 LITERATURE REVIEW --- 4
2.1REMOTE SENSING AS A TOOL FOR CHANGE DETECTION--- 4
2.2CLASSIFICATION METHOD--- 5
2.3CHANGE DETECTION TECHNIQUE--- 6
2.4ACCURACY ASSESSMENT--- 8
2.5SUMMARY--- 9
3 STUDY AREA AND DATA --- 10
3.1STUDY AREA--- 10 3.2DATA--- 12 3.2.1 LANDSAT DATA--- 12 3.2.2 ASTER DATA--- 13 3.2.3 AERIAL PHOTO--- 14 3.2.4 ANCILLARY DATA--- 14 4 THE METHODOLOGY --- 16 4.1PRE-PROCESSING--- 17 4.2IMAGE ENHANCEMENT--- 18
4.3IMAGE FUSION (RESOLUTION MERGE) --- 19
4.4IMAGE CLASSIFICATION FOR LAND USE /LAND COVER--- 21
4.4.1 OBJECT ORIENTED CLASSIFICATION USING DEFINIENS PROFESSIONAL --- 22
4.4.2 LAND USE / LAND COVER: PRINCIPLES & NOMENCLATURE--- 26
4.4.3 CLASSIFICATION OF LANDSAT TM IMAGE (1989) --- 28
4.4.4 CLASSIFICATION LANDSAT ETM+ IMAGE (2000) --- 32
4.4.5 CLASSIFICATION OF LANDSAT ETM+ PC IMAGE (2000) --- 35
4.4.6 CLASSIFICATION OF ASTER IMAGE (2005) --- 38
5 RESULT AND DISCUSSION --- 40
5.1ACCURACY ASSESSMENT--- 40
5.2CLASSIFICATION RESULT--- 44
6 AERIAL IMAGE CLASSIFICATION & ANALYSIS --- 50
7 CONCLUSION AND RECOMMENDATION --- 53
7.1CONCLUSION--- 53
7.2RECOMMENDATIONS--- 55
Fig.- 1.4.1: Flow diagram of thesis outline………3
Fig.- 2.3.1: Land cover change detection workflow for Belarus (Maryna Rymasheuskaya, 2007)………..7
Fig.- 2.5.1: Literature review summary……….9
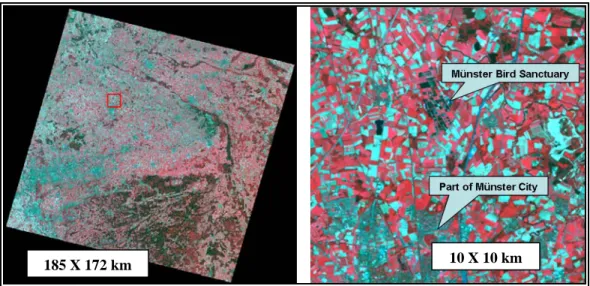
Fig.- 3.1.1: The map showing the study area (red square in left side map)……….10
Fig.- 3.1.2: Full scene of Landsat TM Image (band 4,3,2) with area of interest (marked as red square) and the study area after subset (right)……….11
Fig. - 3.1.3: The Münster Bird Sanctuary and its surrounding area (Source: Google Imagery).11 Fig.- 3.2.1.1: Landsat ETM+ Pan (Left) and MS, band 432 (Right) of the study area………...13
Fig.- 3.2.1.2: ASTER MS Data (Band 3,2,1) of the study area………..14
Fig.- 4.1: Workflow diagram for proposed methodology………16
Fig.- 4.1.1: Three bands (band 5, 6 &7 respectively) with histograms of Landsat TM………..17
Fig.- 4.1.2: Two image window (ASTER and Fused Landsat) with GCP Tool……….17
Fig.- 4.2.1: Input Landsat TM image with histogram after contrast stretching (Linear 2%)….18 Fig.- 4.2.2: Histogram (R-band) after contrast stretching (Histogram Equalization)………….19
Fig.- 4.3.1: Two resultant image from modified IHS (L) and HPF (R) fusion technique……..20
Fig.- 4.3.2: The resultant image (Pansharp band 4,3,2) from PANSHARP fusion technique…21 Fig.- 4.1.1.1: Workflow for OO classification using Definiens Professional……….23
Fig.- 4.1.1.2: Segmentation parameters for creating objects………...24
Fig.- 4.1.1.3: Features used for Nearest Neighbour (L) and Membership Function (R)……….25
Fig. - 4.4.3.1: Class hierarchy (L) for TM image & image object information (R)………31
Fig.- 4.4.3.2: Classification accuracy (Error Matrix) of the Landsat TM Image………32
Fig.- 4.4.4.1: Error matrix for the classification derived from ETM+ fused image………34
Fig.- 4.4.5.1: Four PC components of ETM+ fused image (1-4)………36
Fig.- 4.4.5.2: Colour composite using PC 1, 2, 3 (L) and PC 1, 2, 4 (R)………36
Fig.- 4.4.5.3: Error matrix for the classification of ETM+ fused PC image……….37
Fig.- 4.4.6.1:Error matrix for the classification of ASTER image……….39
Fig.- 5.1.1: Workflow diagram for accuracy assessment………41
Fig.- 5.1.2: Error map for the classification of Landsat Fused, 2000 (L) & its PC Image (R)…42 Fig.- 5.1.3: Error map for classification of Landsat TM, 1990 (L) & ASTER Image, 2005 (R)………42
Fig.- 5.2.1 (a-d): Classified images derived from TM, Fused, Fused PC & ASTER images…..45
Fig.- 5.2.2: Classification result from Landsat TM and ASTER images………46
Fig.- 5.2.3: Classification result from Fused and Fused PC images………..46
Fig.- 5.3.1: Change in area of different land use/ land cover classes………..49
______________________________________________________________________
Table- 3.2.1: Data used for the purpose of study………..12
Table- 3.2.1.1: Bands of Landsat TM (left) and ETM+ (right) (source, NASA web)………..12
Table- 3.2.2.1: Technical specification of ASTER satellite (source: NASA web)………13
Table- 4.4.2.1: LULC nomenclature for the study area (modified from Luma, 2005)………..28
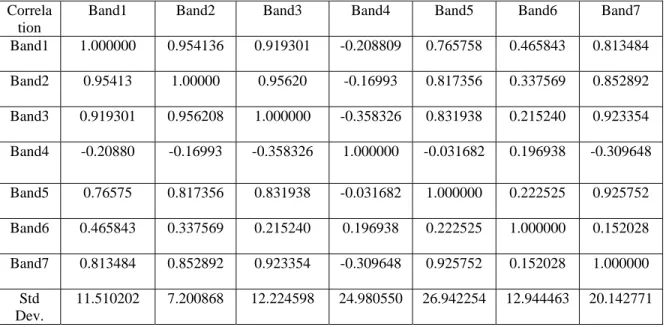
Table- 4.4.3.1: Spatial statistics for the Landsat TM image……….. 29
Table- 4.4.3.2: OIF value with rank for possible band composition of TM image………30
Table- 4.4.3.3: Segmentation parameters for Landsat TM classification………...30
Table- 4.4.4.1: Classification methods for TM & Fused Image……….34
Table- 4.4.5.1: Statistical reports for four pc components of fused ETM+ image……….35
Table- 4.4.5.2: OIF value with rank for possible band composition of TM Image………36
Table- 4.4.5.3: Segmentation parameters for PC Image classification………...37
Table- 4.4.6.1: Land use / land cover classes and classification methods for ASTER………...39
Table- 5.1.1: Percentage of error for the classification of TM and ASTER images…………...43
Table- 5.1.2: Percentage of error for the classification of fused and fused PC images………..43
Table- 5.3.1: Classification result (1990, 2000 and 2005)………..48
Table- 5.3.2: Status of LULC change detection……….48
Table- 6.1: Segmentation parameters for aerial image classification………50
Table- 6.2: Confusion matrix for the classification of aerial image, 2006 based on TTA mask using reference data (rieselfelder)………..51
______________________________________________________________________
ASTER Advanced Spaceborne Thermal Emission and Reflection Radiometer CLC Corine Land Cover
DGK Deutsche Grundkarte
EEA European Environmental Agency ETM+ Enhanced Thematic Mapper Plus FCC False Colour Composite
GCP Ground Control Point HPF High Pass Filter
IHS Intensity-Hue-Saturation IRS Indian Remote Sensing LULC Land Use / Land Cover LWIR Long Wave Infrared MF Membership Function MMU Minimum Mapping Unit MS Multispectral MSS Multispectral Scanner
NASA National Aeronautics and Space Administration NN Nearest Neighbour
OIF Optimum Index Factor OO Object Oriented Pan Panchromatic
PC Principal Component PCA Principal Component Analysis RS Remote Sensing
SNN Standard Nearest Neighbour SWIR Short Wave Infrared
TM Thematic Mapper
TTA Mask Training and Test Area Mask UTM Universal Transverse Mercator VNIR Visible and Near Infra-Red WGS 84 World Geodetic System 1984
WiFS
Wide Field Sensor
phenomena such as agricultural demand and trade, population growth and consumption patterns, urbanization and economic development, science and technology, and other factors (Research on Land use change & Agriculture, International Institute for Applied Systems Analysis, 2007). As a consequence, information about LULC is essential for any kind of natural resource management and action planning. Timely and precise information about LULC change detection of earth’s surface is extremely important for understanding relationships and interactions between human and natural phenomena for better management of decision making (Lu et al., 2004). There is a continuing demand for accurate and up-to-date LULC information for any kind of sustainable development programme where LULC serves as one of the major input criteria. As a result, the importance of properly mapping LULC and its change as well as updating it through time has been acknowledged by various research workers for decision making activities; as for example, application of land cover change in urban environment by Deng et al., (2005) and land cover dynamic monitoring by Sobrino & Raissouni, (2000).
1.1 Problem Definition
The application of remote sensing (RS) for extracting LULC information has been exploited since the advent of optical satellite systems. Various improvement and techniques have been developed through past decades with the development of RS technology. Many change detection techniques have been developed and utilized by several research workers. Due to the importance of monitoring LULC change, research of change detection techniques is an active field and several new methods are emerging regularly. Recent advancement of RS with wide-ranging spectral and higher spatial resolution of satellite images and repetitive coverage, this research field of change detection has been growing strongly. Coupled with the availability of historical RS data, the reduction in data acquisition and processing as well as higher spatial, spectral and temporal resolution, the application of RS has great impact on growing development of change detection techniques (Rogan & Chen, 2004).
Successful use of RS for LULC change detection largely depends on an adequate understanding of the study area, the satellite imaging system and the various information extraction methods for change detection in order to fulfill the aim of the present study (Yang & Lo, 2002). Extracting meaningful LULC change information from satellite data using various techniques has been performed and established by a large number of authors. However, it is still sometimes appeared difficult in practice to select a good change detection method. Moreover, the choice of methods depends on the RS data available, the performed time limit and the objective of the study. The determination of suitable LULC change detection techniques from the various methods is a problem in the present research. There are a number of challenges in applying suitable set of techniques from change detection considering a series of dynamic factors ranging from selection of input data and their classification algorithm, to accuracy assessment to the ultimate aim of the study. Most of them were discussed by Lu et al., 2004. However, change detection methods have their own merits (and demerits as well) and no single method has been proven as optimal to all cases. In the present study, investigating the efficacy of preferred change detection methods, selected based on existing case studies, availability of
1.2 Research Objectives
To address the above mentioned problem, the primary aim of the study is to identify change detection of land use / land cover (LULC) in the study area with emphasis on:
• Object oriented (OO) classification of three consecutive satellite images from the study area.
• Accuracy assessment to judge the applicability of OO classification method in this case study and to ensure the accurate change detection.
• Identify the LULC changes in the study area during the time periods of 1990 to 2000 and 2000 to 2005 as well as 1990 to 2005 using post-classification method.
• Perspective view on aerial image classification using OO method for LULC change & accuracy assessment based on the existing reference layer.
1.3 Research Questions
The following research questions can be made in order to fulfill the above mentioned objectives of the present research work:
• Can the LULC Changes in the study area be assessed using the applied satellite images?
• How effective is the OO method for image classification in the context of the present study?
• Is there a relationship between this advanced method of classification and the resolution of images?
• Does the application of Principal Component Analysis (PCA) improve the accuracy of classification?
• Is the method of accuracy assessment using the error matrix based on samples in the Definien software environment well enough for the accuracy assessment?
• How can an alternative method of accuracy assessment be used to strengthen the justification of accuracy for the derived classification?
• What are the LULC changes in the study area in three time periods considering the aspects of aerial extent?
• How suitable is the use of the aerial image for the present context and how effective is the accuracy assessment based on the existing reference layer.
1.4 Scope of the Work
The present research is not completely free of limitation. First of all, considering the technical aspects of the satellites images used are restricted to certain spatial and spectral resolution. The effectiveness of the OO method has a great impact on the resolution. Secondly, for accuracy assessment, a true high quality reference data or ground truth data with the same number of classes was not available. Thirdly, due to time limitations, the choice of data, aerial extent of study area and number of methodologies used are also restricted.
1.4 Thesis Outline
The thesis outline can be divided into seven chapters (fig.- 1.4.1). This chapter primarily gives the aim of the present research work. The rest of the thesis is arranged as follows: Chapter 2 is for the literature review where related research wok has been discussed. This chapter shows how the application of remote sensing is utilized for the LULC change detection study and briefly reviews various existing techniques and their advantages through several case studies. After this chapter, a workflow has been proposed for the present work. Chapter 3 is allocated for the description of study area and data used for the whole work. Chapter 4 illustrates the methodologies used in detail with focus on object oriented methods for image classification after image preprocessing, enhancement and fusion. Then the several approach used for classification is introduced and briefly described as well as provided the result with accuracy assessment by the classification software.
Fig.- 1.4.1: Flow diagram of thesis outline
An alternative method of accuracy assessment is proposed in Chapter 5 along with detailed analysis and discussion of result of LULC change detection. The discussion is provided in detail in relation to the objectives. Chapter 6 adds to the present study a focus on aerial image classification and its accuracy assessment based on existing reference data. Chapter 7 concludes the research work and recommends the future work.
2 Literature Review
Over the past decades, Remote Sensing (RS) has played a large role in studying land use / land cover (LULC) change detection. LULC change detection studies are becoming demanding tasks with the availability of a suite of wide range sensors operating at various imaging scales and scope of using various techniques as well as increasing avenues for monitoring effective and accurate LULC change. Considerable research has been directed at the various components of LULC change including the accuracy assessment which is drawing an equal attention by scientists nowadays. The literature review looks into the following aspects considering the objective of the present study.
2.1 Remote Sensing As a Tool for Change Detection
“Remote Sensing is the science and art of obtaining information about an object, area, or phenomenon through the analysis of data acquired by a device that is not in contact with object, area, or phenomenon under investigation” (Lillesand and Kiefer, 1987). It provides a large variety and amount of data about the earth surface for detailed analysis and change detection with the help of various spaceborne and airborne sensors. It presents powerful capabilities for understanding and managing earth resources. RS have been proven to be a very useful tool for LULC change detection (Matinfar, Sarmadian, Panah, Heck, 2007).
A large number of change detection techniques have been developed since the advent of the orbital system (Lillestrand 1972). Weismiller et al. (1977) have used various RS techniques for evaluating change detection for coastal zone environments. In 1980, Byrne, Crapper and Mayo have shown that Landsat multispectral data can be used to identify LULC changes very effectively.
Change detection and monitoring involve the use of several multi-date images to evaluate the differences in LULC due to various environmental conditions and human actions between the acquisition dates of images (Singh 1989). Successful use of satellite RS for LULC change detection depends upon an adequate understanding of landscape features, imaging systems, and methodology employed in relation to the aim of the analysis (Yang & Lo, 2002). Various RS data products over time have often been incorporated into historical land use information (Acevedo, Foresman, & Buchanan, 1996; Clarke, Parks & Crane, 2002; Meaille & Wald, 1990).
With the availability of historical RS data, the reduction in data cost and increased resolution from satellite platforms, RS technology appears poised to make an even greater impact on monitoring land-cover and land-use change (Rogan & Chen, 2004). In general, change detection of LULC involves the interpretation and analysis of multi-temporal and multi-source satellite images to identify temporal phenomenon or changes trough a certain period of time. RS data are the primary source for change detection in recent decades and have made a greater impact on urban planning agencies and land management initiatives (Yeh and Li 1999, Yang and Lo 2002, Rogan and Chen 2004).
2.2 Classification Method
Classifying the satellite images to extract the land use / land cover theme is the one of the major steps in this type of study. Classification is the process of assigning classes to the pixels in images. Moreover, successful utilization of remotely sensed data for LULC studies demands careful selection of an appropriate data set and image processing technique(s) (Lunetta, 1998). The most common image analysis for extracting LULC is digital image classification. Sabins (1997) explains that image classification techniques are most generally applied to the spectral data of a single-date image or to the varying spectral data of a series of multi-date images. The complexity of image classification techniques can range from the use of a simple threshold value for a single spectral band to complex statistically based decision rules that operate on multivariate data. The purpose of image classification is to label the pixels in the image with the real information (Jensen & Gorte, 2001). Through classification of RS image, thematic maps such as the LULC can be obtained (Tso and Mather, 2001). Classification involves labelling the pixels as belonging to particular classes using the spectral data available.
There are two broad types of classification procedure and each finds application in processing of RS image. One is referred to as supervised classification and the other one is unsupervised classification. These can be used as alternative approaches but are often combined into hybrid methodologies using more than one method (Richards and Jia, 2006). Both the supervised and unsupervised classification methods used for classifying various multispectral images are based on so called traditional pixel-based method which has been played a great importance for classifying low resolution images. On the other hand, when using new generation images, characterized by a higher spatial and spectral resolution, it is still difficult to obtain satisfactory result (Lewinski and Zaremski, 2004).
With the advancement of RS technology, a new concept of classification technique-object oriented method has been emerged. Advantages of this method are meaningful statistic and texture calculation, an increased uncorrelated feature space using shape (e.g. length, number of edges, etc.) and topological features (neighbor, super-object, etc.), and the close relation between real-world objects and image objects (Definiens User Guide, 2006). This relation improves the value of the final classification unlike the traditional pixel-based approaches (Benz et al., 2004). Context techniques assume that the spectral response and the neighbour pixels are highly correlated and thus efficient when compared with those techniques used previously for images with medium spatial resolution (Whiteside & Ahmad, 2005). Object oriented method is a new concept, allows the integration of a wide field of different object features such as spectral values, shape, and texture. Such classification techniques incorporate contextual and semantic information, image object attributes and relationship among different image objects (Laliberte et al. 2004; Gitas et al., 2004). Several studies investigated the capability of satellite imagery, including Landsat TM and ETM+, to perform change detection analysis (Owojori and Xie, 2005).
2.3 Change Detection Technique
Although coarse-spatial resolution meteorological satellite data have been available since the 1960s, civilian RS of the Earth’s surface from space at medium spatial resolutions (i.e. <250 m) only began in 1972 with the launch of the first of a series of Landsat Satellites (Rogan & Chen, 2004). Since then a large numbers of change detection techniques have been developed after the launching of Landsat orbital system as described in the article titled “Techniques for Change Detection” by Lillestrand in 1972. Many methods of change detection have been developed to detect land cover change (Lambin & Ehrlich, 1997; Mas, 1999; Singh, 1989), but by far the most popular has been the utilization of post classification comparison method. In spite of the numerous evaluations of these techniques (Weismiller et al. 1977; Singh 1989; Stow, 1990), no standard techniques have yet been adopted (Macleod and Congalton 1998) for all cases. Although the development of RS technology has been developed dramatically within last few years, examples of effective LULC change detection studies remain relatively rare (Loveland et al., 2002; Rogan et al., 2004).
Numerous researchers have addressed the problem of accurately monitoring LULC change in wide applications with greater success (Muchoney and Haack, 1994; Chan et al., 2001). One of the most definite reasons is that a wide variety of digital change detection techniques and algorithm have been developed and manipulated over last few decades commensurate with the fast-pace advancement of RS technology with spatial, spectral, thematic and temporal properties. They can be broadly divided into two which are pre-classification spectral change detection or post-classification methods (Nelson 1983, Pilon et al. 1988, Singh 1989). The simplest rule separates LULC changes that are categorical versus those that are continuous (Abuelgasim et al., 1999). Basically, the detection of categorical and continuous changes are also known as post-classification and pre-classification method respectively.
In case of post classification change detection, two multi-temporal images are classified separately and labelled with proper attributes. The area of change is then extracted through the direct comparison after obtaining the classification results (Colwell and Weber 1981, Howarth and Wickware 1981). With the post-classification methods basic issues are the accuracies of the component classifications and more subtle issues associated with the sensors and data preprocessing methods (Khorram, 1999). Though it avoids the difficulties in change detection, it has significant limitations because the comparison of land cover classifications for temporal images does not allow the detection of subtle changes within land cover classes (Macleod and Congalton, 1998). Owojori and Xie (2005) have shown the example of post classification in the study demonstrated the potential for accurate LULC change assessment with advanced atmospheric correction and object-oriented image analysis using medium resolution satellite data (Landsat TM).
Pre-classification technique, where changes occur in the amount or concentration of some attribute that can be continuously measured (Coppin and Bauer, 1996). Image differencing (one of the most common pre-classification methods) is the most commonly used change detection algorithm (Singh, 1989). It involves subtracting one date of imagery from a second date that has been precisely registered to the first. According to recent research, image differencing emerges to perform generally better than other methods of pre-classification change detection (Coppin & Bauer, 1996). Maryna Rymasheuskaya (2007) in recent study has proved that both image differencing and post-classification comparison confirms their ability to be used for detecting land cover changes over northern Belarusian landscapes. The presented study allows
estimating the amount of changes occurred at the study area. Fig.- 2.3.1 is showing the used general sequence of land cover change detection (taken from Rymasheuskaya, 2007).
Fig.- 2.3.1: Land cover change detection workflow for Belarus (Maryna Rymasheuskaya, 2007) Spectral change detection technique is also considered as pre-classification category where the conception is about spectral signature change of the affected land surface through certain period of time. The largest number of change-detection techniques are considered as spectral change category, such as image differencing, image ratioing, vegetation index differencing, principal-component analysis (PCA) and change vector analysis (CVA) (Deng et al., 2008). Despite many factors affecting the selection of suitable change-detection methods, image differencing, PCA, and post-classification are, in practice, the most commonly used methods (Lu et al. 2004). Principal component analysis (PCA) has been proven as efficient and basic economical technique for change detection in most cases (Byrne et al. 1980; Fung and LeDrew, 1988). According to Byrne et al. (1980), PCA has provided an effective way of identifying areas in which change has occurred between two four-channel multispectral images (Maldonado et al., 2002). In 2005, Deng et al. adopted the technique of combining PCA with interactive supervised classification to detect changes. The method of combining PCA and supervised classification is common practice to detect temporal changes with satisfying results (Xlago, 1998; Li & Ye, 2004; Eastman & Filk, 1993).
Other not so common change detection techniques in the category of spectral change detection are Change vector analysis and composite analysis. Change vector analysis (CVA) (Malila, 1980) involves the calculation of two change features (magnitude and direction of change) based on a multi-temporal dataset. Composite analysis (CA) is often performed in change
data). Supervised or unsupervised classification is then performed on the data set to obtain the desired number of output classes (Rogan & Chen, 2004).
2.4 Accuracy Assessment
Accuracy assessment is an essential and most crucial part of studying image classification and thus LULC change detection in order to understand and estimate the changes accurately. It is important to be able to derive accuracy for individual classification if the resulting data are to be useful in change detection analysis (Owojori and Xie, 2005). Another part that is continuing to get increased attention by research workers is classification accuracy (Lillesand et al, 2004). The post-classification method for LULC change detection has dependency on the accuracy of individual classification results (Foody, 2002). Furthermore the change map of two multi-date classifications of LULC often reveals accuracies similar to the product of multiplying the accuracies of each individual classification (Stow et al., 1980; Mas, 1999). Error in the individual classifications may also be confused with change detection (Khorram, 1999) – which must lead to misinterpret about the actual change in reality. Sometimes it is quite impossible to get ground truth or referenced data for assessing accuracy for the classified result from the historical image data.
As a consequence of these and other issues, the estimation of the accuracy of a change product is a substantially more difficult and challenging task when compare to the assessment of the accuracy of a single image classification (Congalton & Green, 1999). There is no single and appropriate method for assessing the accuracy of change detection products. The most common and popular method for accuracy assessment for LULC is the error matrix or confusion matrix method which can be further used for change detection accuracy assessment (Foody, 2002). The elements of change detection confusion matrix also used for showing individual from/to class change scenarios (Congalton & Green, 1999; Khorram, 1999). The related assessment elements include overall accuracy, producer accuracy, user accuracy, and kappa coefficient. Previous studies provided the meanings and methods of calculation for these statistical elements for judging the accuracy (Congalton 1991, Congalton and Green 1999, Foody 2002). The two approaches to assess accuracy using this method are – random sampling or using referenced data. Bock et al. (2005) have shown the use of random sampling method for accuracy assessment by means of error matrix based on stratified and randomly selected points across the classified image. Instead of purely random method, stratified random sampling is usually recommended so that the sampling points are fairly spread in each LULC change class (Congalton 1991). He also gave suggestion about the number of sample size- a collection of minimum 50 samples for each class. On the other hand, accuracy assessment with error matrix using reference data requires a high-accuracy LULC data with the same number of classes which is sometime difficult to obtain. Stanislaw Lewinski in the research studies of land use classification of ASTER image (2005) and applying fused Landsat data to object oriented classification (2006) have proposed the accuracy assessment can be performed using a method of visual interpretation according to the way adopted by CORINE Land Cover (CLC) 2000 project. The interpreter edits the edges of objects and the codes of classes directly on the screen displaying the vector database and the satellite image in the background. “As a result of interpretation, a so-called change layer was obtained, which provided information about the correctness of the classification” (Lewinski, 2006).
2.5 Summary
The studies from various literature of related work revealed that the use of RS application is a key instrument for studying LULC change detection. However, a careful selection of RS data has to be stipulated considering the scope and type of actual work. With rapid advancement of RS techniques, a bunch of classification techniques have been developed as well. Those can be primarily grouped into two broad types which are tradition pixel based method and advance object oriented method. The preference of employing them is fairly driven by the resolution of RS data. Evolution of RS technology also accelerated the growing development of various change detection techniques which are implemented through case studies. The case studies in this regard have greatly influenced the development of new techniques. However, it has not been established any single technique as optimum and best. Every techniques are useful and having a balance between pros and cons. Because of impacts of complex factors and objectives, different researchers often arrived at different conclusion about which the efficacy of various methods. Accuracy assessment is also a part of good change detection research work. Moreover, it can be mentioned that accuracy assessment itself is an active field of research nowadays. The chapter briefly reviews the background and methods for various accuracy assessments that are most commonly used and recommended. In summary, the chapter discusses about several aspects (fig.- 2.5.1) of related work for LULC change detection.
Literature Review Remote Sensing Classification Method Change Detection Accuracy Assessment Muti Resolution Multi Spectral Multi Temporal Pixel Based Object Oriented Pre Classification Post Classification Error Matrix Random Sampling Reference Data Fig.- 2.5.1: Literature review summary
3 Study Area and Data
This chapter describes the area and data used for the study. At first, a short description of the study area is given to demonstrate the characteristics of the area in terms of geography, land use / land cover and general narrative. Then, it illustrates about the technical details of the various data used for the proposed study.
3.1 Study Area
The study area lies in the region (Bundesländer) of Nordhein-Westfalen, close to the city of Munster (fig- 3.1.1) in Germany. The study area covers a part of the Münster city urban area. The study area is situated in the northern part of the state (source:
Stadt Münster)
.Fig.- 3.1.1: The map showing the study area (red square in left side map)
The geographical co-ordinate of the area under study is between 52 01 15.72 N to 51 55 58.23 N and 7 33 18.38 E to 7 42 12.24 E. The study was performed on the subset of images covering an area of 100 km2. The area of interest has been chosen after a visual examination of the study area which is a 10 km X 10 km square area based on which all the full scene images have been subset (fig.- 3.1.2).
“A well known saying in Münster is "Entweder es regnet oder es läuten die Glocken. Und wenn beides zusammen fällt, dann ist Sonntag" ("Either it rains or the church bells ring. And if both occurs at the same time, it's Sunday."), but in reality the rainfall of the area is approximately 744 mm per year – which is the average rainfall in Germany. The impression of Münster as a rain-laden city depends not on the absolute amount of rainfall but on the above-average number of rainy days with relatively little rainfall” (source: Wikipedia).
Fig.- 3.1.2: Full scene of Landsat TM Image (band 4,3,2) with area of interest (marked as red square) and the study area after subset (right).
The study area can be considered as rural-urban fringe area. In the southern part, it is mostly covered by part of Münster city and its surroundings while the rest part is dominated by rural and agricultural land use / land cover. The study area has a bird sanctuary (Rieselfelder), located about 6 km north of the Münster city. This man-made wetland on the former “Verrieselungsflächen” (agricultural land) has an important resting and molting place for migratory birds. Viewed from the air sanctuary provide a picture of a large lakes with over 130 individual ponds (fig.- 3.1.3). The division of the zone is clear. In the northern part, the original checkerboard-like parceling are extensively prominent. The southern part boasts “naturerlebnisgebiet”. Both areas are European bird reserve, as protected Natura 2000 network for the conservation of Europe's natural heritage (source: EU-Vogelschutzgebiet Rieselfelder Münster).
Fig. - 3.1.3: The Münster Bird Sanctuary and its surrounding area (Source: Google Imagery)
Münster Bird Sanctuary
1.2 km
3.2 Data
Several types of data, have been used for this research work, are listed in the table 3.2.1. The data used can be subdivided into remote sensing data and ancillary data. Both satellite images and aerial image have been used for remote sensing application. Among ancillary data, the Germans basic maps at a scale of 1: 5000 (DGK 5) for the study area are mainly used. Apart from this, some vector data have also been used from different sources.
Table- 3.2.1: Data used for the purpose of study
RS Data Date of Acquisition
Band /Colour Resolution Source
Landsat TM 25 May, 1989 Multi-spectral 30 m IVV Geowissenschaften
(University of Münster) Landsat ETM+ 15 May, 2000 Multi-spectral &
Panchromatic
30 m (MS) 15 m(Pan)
IVV Geowissenschaften
(University of Münster) ASTER 2 April, 2005 Multi-spectral 15m (VNIR) IVV Geowissenschaften
(University of Münster)
Aerial Photo 2006 True Colour 10 cm IVV Geowissenschaften
(University of Münster)
Anciallary Data
Date Format Scale Source
DGK 5 1987 GeoTiff 1:5000 IVV Geowissenschaften
(University of Münster) Bundesläander,
Stadt Layer
2001-2002 Shapefile 1:5,000,000 Exercise data
(University of Münster)
CLC 2000 2000 Shapefile 1:100000 European Environment
Agency
Rieselfelder data 2007 Shapefile 1:5000 Vermessungs-und Kata-
steramt (Stadt Münster)
3.2.1 Landsat Data
The Landsat images used for the study are from two Landsat operations. The Landsat TM imagery is part of Landsat 5 mission, launched in March 1, 1984 by NASA. And the Landsat ETM+ images are part of Landsat 7 mission, launched on April 15, 1999 (source, NASA web).
Table- 3.2.1.1: Bands of Landsat TM (left) and ETM+ (right) (source, NASA web)
Band µm Resolutionn Band µm Resolutionn
1 0.45-0.52 30 m 1 0.45-0.515 30 m 2 0.52-0.60 30 m 2 0.525-0.605 30 m 3 0.63-0.69 30 m 3 0.63-0.69 30 m 4 0.76-0.90 30 m 4 0.75-0.90 30 m 5 1.55-1.75 30 m 5 1.55-1.75 30 m 6 10.4-12.5 120 m 6 10.4-12.5 60 m 7 2.08-2.35 30 m 7 2.09-2.35 30 m - - - 8 0.52-0.9 15 m
Fig.- 3.2.1.1: Landsat ETM+ Pan (Left) and MS, band 432 (Right) of the study area The technical details of Landsat TM and Landsat ETM+ bands have been provided in the table- 3.2.1.1.For other specification; refer to the official portal of Landsat (Landsat Program, NASA web). The Landsat TM image of the study area is shown in fig.- 3.1.2
3.2.2 Aster Data
ASTER (Advanced Spaceborne Thermal Emission and Reflection Radiometer) is an RS imaging instrument on Terra, a satellite launched in December 1999 as part of NASA's Earth Observing System (EOS). ASTER is a collaborative project between NASA, Japan’s Ministry of Economy, Trade and Industry (METI) and Japan's Earth Remote Sensing Data Analysis Center (ERSDAC). ASTER is being used to obtain detailed maps of earth surface features (study area on ASTER, fig.- 3.2.1.2).
ASTER consists of three separate instruments, each operating in different spectral region, using a separate optical system. These subsystems are the visible and near infrared (VNIR), the Short Wave Infrared (SWIR) and the Thermal Infrared (TIR) respectively. The present study is only concerned for VNIR subsystem which has 15 m ground resolution (table- 3.2.2.1) (source: ASTER, NASA Web).
Table- 3.2.2.1: Technical specification of ASTER satellite (source: NASA web)
Characteristic VNIR
Bands Band 1: 0.52 - 0.60 µm & Band 2: 0.63 - 0.69 µm (Nadir looking), Band 3: 0.76 - 0.86 µm (Nadir & Backward looking)
Ground Resolution 15 m
Data Rate (Mbits/sec) 62 Cross-track Pointing (deg./km) ±24/60
Swath Width (km) ±318
Detector Type Si
Fig.- 3.2.1.2: ASTER MS Data (Band 3,2,1) of the study area
3.2.3 Aerial Photo
One aerial photo from 2006 has also been used for the classification of the land use / land cover. The aerial photo is having 10 cm resolution mainly covers the Münster sanctuary and its adjacent area to some extent. The aerial photo covering the whole study area was not available. The aerial photo came in both GeoTiff and MrSID format. Moreover, aerial photograph were split into several part which have been mosaicked later on.
3.2.4 Ancillary Data
In general, ancillary data are used for various purposes including geometric correction of the remote sensing data and extraction of some base layers like road, railways, contour etc. In the present study, three types of such data have been used.
The German basic maps (DGK 5) on scale of 1:5000 have been primarily used for geometric correction. The DGK 5 is the basis of topographic maps in North Rhine-Westphalia. The scale of 1:5000 permits a largely complete and faithful description of the ground surface in its natural human activity is influenced by manifestations. The DGK 5 is suitable mainly for planning large-scale tasks and as a basis for thematic surveys. Applications include, for example road planning and management, administration, transportation, housing and others (source: Landesvermessungsamt, Nordhein-Westfalen).
Some thematic layers have been used for delineating the study area, creating the area of interest (AOI) and for some other references. Those layers are mainly administrative boundaries (Bundesläander) of Germany, cities of Germany in shapefile format. All those thematic are capable of importing into GIS software for having proper reference system with required non-spatial attribute data. These data from other sources than remote sensing have been used to aid
in the classification, to assist in image processing and to populate metadata as well. Most importantly, a detailed LULC data (rieselfelder) from survey and cadastre, Stadt Münster was available for the accuracy assessment of aerial image classification.
It is very important to mention about CORINE land cover (CLC) data has been used for the present study. CLC is a data of the European environmental landscape based on interpretation of satellite images. It provides comparable digital maps of land cover for each country for much of Europe (European Environment Agency Web, 1995-2009). The classification nomenclatures used here have been adopted from CORINE for better acceptability and easy use. These datasets were frequently used as training site, wherever required, for the classification of LULC. Those datasets are downloadable for the study area in shapefile format. The scale of all output products of CLC is set to 1:100000, facilitating the detection of essential features of the terrain by means of satellite images (Spot, Landsat MSS and TM) and their representation. The detailed technical description and methodology about the data can be found from official portal of CORINE.
It is also worthy mention that Google map and Google earth were frequently using whenever some confusion arose regarding the decision of land use / land cover type. As we know Google Maps is a free web mapping service application and technology provided by Google. It is also a source of high-resolution satellite images for most urban and rural areas. A related product is Google earth - is a virtual globe, map and geographic information programme. It maps the earth by the superimposition of images obtained from satellite imagery, aerial photography and GIS 3D globe (source: Wikipedia). It is quite useful to use to check the classified data from remote sensing images using Google earth programme. The derived land use / land cover data can easily be overlaid upon high resolution images used by Google earth in order to check and compare the classified images.
4 The Methodology
In this chapter, a general sketch of the methodology adopted has been described. The present research is a framework of digital image processing using a case study to meet the expected result in order to solve the specified research problems. Towards this approach, information extraction using digital image processing using remote sensing (RS) data has been adopted. There are several techniques exist for improved information extraction from various sources of RS from simple visual interpretation of aerial photographs to complex automatic digital interpretation using various developed classification procedures. These techniques are directly influenced by several technical factors – resolution and type of the image, target information to be extracted, objective the study and accuracy requirements are worthy mentioned. Object oriented method for image classification along with required preprocessing; enhancement and post-classification analysis for change detection have been utilized for the whole study. The following sections are devoting to describe the various steps (fig.- 4.1) of the present work.
Fig.- 4.1: Workflow Diagram for proposed methodology
However, this chapter does not include the methodology for the study of aerial image classification and its accuracy assessment based on existing reference layer (land use / land cover from Survey and Cadastre, Stadt Münster). Chapter 6 is provided for implementing this work including methodology and result.
4.1 Pre-processing
Before performing the classification of the RS data, it is important to pre-process the data to correct the error during scanning, transmission and recording of the data. It refers to the functions which are frequently performed to improve geometric and radiometric qualities of the images. Typically, the pre-processing steps are (i) radiometric correction to compensate the effects of atmosphere (ii) geometric correction i.e. registration of the image to make it usable with other maps or images of the applied reference system , and (iii) noise removal to remove any type of unwanted noise due to the limitation of transmission and recording processes. In this study, the radiometric correction has not been adopted due to the following reasons (i) first of all, the data for this study were already corrected to some extent (fig.- 4.1.1). From the histogram, it is noticed that all bands have ‘offsets’ from zero which is acceptable except for the case of Band 6 (Band 6 will not be exploited for the classification later on). (ii) For radiometric correction or normalization, calibrated data is required to achieve the higher accuracy (iii) most importantly; radiometric correction is obligatory only when image differencing is used for change detection analysis.
In the present study all the datasets except the ASTER image and the German basic maps (DGK 5) were geometrically corrected by the source in UTM WGS 84 system. The ASTER image has been geo-referenced to the other datasets in UTM WGS 84 system using image to image registration method. The Landsat ETM+ fused image has been used as a reference image in this case. During registration, initially 4 ground control points (GCP) were used from the Landsat image but finally 8 GCPs have been used to improve the positional accuracy and the root mean square was 0.371 (fig.- 4.1.2). During resampling nearest neighbour algorithm was used as it has advantages of preserving the pixel value or nearest pixel value of the original image which is useful for further image classification. The German basic maps were corrected using the same reference system but in different way. The GCP has been collected from the map itself as it has some cross-points with known latitude / longitude value.
After close examination of all the datasets and their image statistics and histogram, there were no noise or image pixel dropout, primarily because those might be removed by the data centre who delivered the data to the source. However, all the images have been enhanced its quality in terms of visual appealing which is described in the next section under image enhancement.
4.2 Image Enhancement
Image enhancement involves the technique to increase the visual distinction of the features or classes in the image. This step alters the pixel value of the image and therefore image enhancement is followed after the pre-processing step is completed. The choice of enhancement technique depends upon the features to be used for extracting from the image. The most commonly used one is the simple contrast stretching which has also been adopted in this study. This step has been considered and proved to increase effectively the overall contrast of the image elements by accomplishing few simple steps. There are several methods for contrast stretching as well. After performing those methods on the complete dataset, it has been found that linear stretching and histogram equalization are the suitable ones for this purpose.
Almost all image processing software have the facility of performing contrast stretching and those are nearly the same with some subtle differences in the way they follow the procedure. ENVI has been used in this case for having interactive stretching which allows real-time visualization of the image and its histogram together. At first, Landsat TM (multispectral) has been chosen for enhancement and ‘Linear 2%’ method was applied (fig.- 4.2.1). Although the contrast of the image has been improved, it was not visibly distinguishable. After that, histogram equalization was applied which improved the image significantly (fig.- 4.2.2).
Fig.- 4.2.2: Histogram (R-band) after contrast stretching (Histogram Equalization) After finishing the contrast enhancement of the Landsat TM image, the same methods were followed for rest of the datasets. It has been decided to use histogram equalization method for enhancement since it is supposed to be best for this case study. A histogram equalization stretch assigns the image values to the display levels on the basis of their frequency of occurrence (Lillesand & Kiefer, 1987). As it can be easily seen form the previous figures (fig.- 4.2.1 and 4.2.2), more display values are assigned to the frequently occurring portion of the histogram which consequently increased the radiometric quality of the image.
4.3 Image Fusion (Resolution Merge)
Image fusion is the spatial enhancement technique to make the best use of different complementary information from multi-source and multi-temporal imagery. A multi-spectral image can be fused with a higher resolution panchromatic (pan) image to create the high resolution multi-spectral (MS) image. The technique of fusing MS image with pan one is most popular and widely used to increase the resolution. The resulting fused image will have more information than the input image. This is common practice in almost all kind of LULC studies especially when high resolution MS data are unavailable due to various limitations.
Before running the fusion, it has to be kept in mind that both images should have registered in a common reference system and they should matched one-to-one without any displacement of the same features within the images. To ensure (although they were geometrically corrected) this, two images were displayed in the same image window and took advantage of the tool sets of swipe, blend and flicker which are the dedicated tools for comparing two superimposed layers of images. After visual inspection, they were found acceptable for image fusion further.
Various techniques of image fusion (sometimes called merging or sharpening) have been developed by scientist and software vendors. The most common are IHS (Intensity-Hue-Saturation), HPF (High Pass Filter), Colour Normalized (Brovey), PC (Principal Component) Spectral, Gram-Schmidt Spectral, Wavelet etc. Examples of using those methods have been found in various literature and case studies – in every cases, analyst have their own logic to use specific type of image fusion. However, after consulting several literature and books, it has been originated that the most widely used and affective methods in this purpose are IHS (Intensity-Hue-Saturation) and HPF (High Pass Filter) image fusion. However, PC method has not been adopted since it has been applied as an enhancement for better classification later on.
Both methods offered by ERDAS Imagine have been selected for the datasets of Landsat ETM+ multispectral and Pan images. Moreover, the IHS method is known as modified IHS in ERDAS Imagine (ERDAS Field Guide, 2005). This tool provides an implementation of "The Modified IHS Method for Fusing Satellite Imagery," proposed by Siddiqui, 2003. Normally, the limitation of a method based on IHS processing is that it can only process three bands at a time (because of using the RGB to IHS method). “However, the color consistency is so good that this implementation of the approach enables images with more than three bands to be merged by running multiple passes of the algorithm and merging the resulting layers” (ERDAS Tour Guide, 2006). The HPF resolution merge function also allows merging high-resolution pan data with lower resolution MS data. The process involves applying high pass filter (HPF) on the high resolution PAN data before merging it with multispectral data.
As mentioned before, both modified IHS and HPF methods have been used to combine the Landsat ETM+ multispectral and pan data and produced excellent fused images. Sometimes more pre-processing steps are required before merging especially when the images are from different satellites and not from the same date. The images used are both from the same satellite and of same time which was the one of the great advantage to get accurate fused image. In both cases, the steps followed are more or less the same except the resampling technique. In case of modified IHS method, there are three techniques for resampling like nearest neighbour, bilinear interpolation and cubic convolution whereas there is no option for choosing resampling technique in HPF method. It is to be noted that in case of modified IHS method, bilinear interpolation is chosen as it was advised in the software manual that if the ratio of high resolution to low resolution is 2:1 (for example, Landsat 15m Pan to Landsat 30m multispectral), then bilinear interpolation is a reasonable compromise of image quality and speed of processing (ERDAS Tour Guide, 2006).
The following diagram (fig.- 4.3.1) shows the two outputs images from the IHS and the HPS fusion. After displaying them in two image windows for visual comparison, both of them provide sharper than input multispectral image at a first glance. But after close examination, the result of IHS method is sharper than the other one. Moreover, the texture in the resultant image of modified IHS is more vivid especially if look into the urban area (lower part of the image). Since the image has been used for object oriented classification where texture is one element for classification and having more sharpness and contrast the image from modified IHS fusion technique was considered for use initially for the study.
Fig.- 4.3.1: Two resultant image from modified IHS (L) and HPF (R) fusion technique 10 X 10 km
Although modified IHS method was found to be considered best suited for the fusion in this case, another alternative method of fusion technique has been adopted for improving the quality. As suggested by Lewinski (2006), the fusion of Landsat ETM+ multispectral and panchromatic data by PANSHARP algorithm is an obvious choice because other methods achieved result depending on the skills of the operating person. The power of PANSHARP lies in the simplicity of its algorithm and its versatility. It is an algorithm newly developed by PCI Geomatica based on thorough studies and analyses of existing fusion algorithms and fusion effects for applying the automatic image fusion algorithm to increase the resolution of multispectral (colour) image data by using a high resolution panchromatic (B&W) image. It is to be noted that for best results, the input image channels have to be selected in such a way that the multispectral bands cover as close as possible the frequency range of the high resolution panchromatic image (Geomatica help tool, PCI Geomatica 9). As a consequence, band 2, 3 & are chosen for fusion with panchromatic band for better result (fig.- 4.3.2)
Fig.- 4.3.2: The resultant image (pansharp band 4,3,2) from PANSHARP fusion technique After performing the fusion, three new channels were obtained which are PANSHARP 2, PANSHARP 3 and PANSHARP 4 to combine FCC image (fig.- 4.2.2). After visual examine with previously fused images by IHS and HPF methods, this fused image was considered to use for image classification subsequently.
4.4 Image Classification for Land use / Land cover
Image classification is the most widely used technique in various remote sensing applications for extraction of target thematic information. In the context of present study, the land use / land cover (LULC) is the main ‘theme’ which is to be extracted using a suitable classification method for LULC change detection. Basically, image classification is a mapping process to generalize the image pixels into meaningful groups each resembling different land category (Jensen, 1995). The process requires an optimum and specifically designed classification algorithm for precise application purpose because it largely varies depending upon the type and
Typical method for RS image classification is so called pixel based method in which the classifier considers different pixel values and group them into classes solely based on their spectral properties. This practice is based on conventional statistical techniques such as supervised and unsupervised classification where the classes are supervised by analyst and are not supervised (i.e. fully automatic based on spectral values) respectively. The expediency of traditional pixel based image classification often proves very effective especially in case of low and medium resolution satellite images, e.g.- Landsat MSS, IRS WiFS etc. The CORINE programme of European LULC database is good example where visual interpretation technique has been adopted instead of traditional pixel based method to obtain accurate result. But with increasing availability of various high resolution (both spatial and spectral) data (e.g.- Quickbird, IKONOS, Cartosat etc.), a new generation of classification technique, object oriented (OO) classification has been emerged which has proved to obtain result with full satisfaction (Lewinski, 2005).
The object oriented method is a newly developed image classification techniques considering not only the spectral information of the image but also shape, texture, contextual and semantic information (Owojori & Xie, 2005). It also considers relationship within different image objects. This method mostly resembles the visual interpretation technique. This new technique for image classification is assumed as more efficient when compared with those techniques used previously for low and medium resolution images. The reason behind such reality is that the automatic classifiers previously used neglects the important information of the image like texture, shape, context which are considered in the object oriented technique for creating meaningful objects of different category.
The object oriented method for image classification has been adopted in the present study considering the spatial and spectral resolution of the imagery used and for expectation of acceptable result. The commercially available software for OO classification method is Definiens Professional which has been used for entire classification using three satellite images. In the present study, the Professional is exploited to show how it can be used for OO classification to extract LULC more effectively. The following section delivers the basic concepts for such classification techniques and important steps which are to be followed to perform the required information extraction of LULC.
4.4.1 Object Oriented Classification using Definiens Professional
Definiens Professional (previously called eCognition) offers the cutting-edge technology for OO classification methods with wide-ranging image analysis tools. Before proper utilization of the software, it is most important to understand the basic concepts of the OO classification using this software. The software offers various tools for precise classification of image depending upon the type, scale and level of classification. Expert knowledge of the system helps to opt for the suitable approach and thus largely influence the classification result.
As an importance, the workflow (fig.- 4.1.1.1) used for the classification in the present study should be understood. The workflow followed here has been developed from the user manual of the software (eCognition Professional User Guide, 2004) according to the purpose. The following major steps are included for the classification scheme:
Image Layers (Landsat TM, Landsat ETM+, ASTER) Layer Mixing Segmentation Parameters Segmented Image (Mutiresolution Segmentation) Load Data &
Create Project Create Image Objects Class Description Image with Defined Classes Create / Load Class Hierarchy Sample Editor Image with Defined Classes & their
samples Sample Selection Iterative steps-refinement of classes Classified Image Classification Final Classification, Accuracy Assessment Accuracy Statistics Raster Output Vector Output Validate & Export Result
Fig.- 4.1.1.1: Workflow for OO classification using Definiens Professional
I. Segmentation: The image is segmented to create meaningful objects
.The object size is adjusted by the ‘scale’ parameter which has to be mentioned before the segmentation process. It is possible to get image objects resembling those in the visual interpretation technique by applying correct scale factor. The quality of segmentation is decisive for outcome of subsequent classification- so it is most important step and sometimes, manual editing might be required to ensure accurate image objects (Lewinski, 2005 & 2006). Hence, the shape of the segmented image objects is determined by the following parameters (Definiens Professional User Guide, 2006) (fig.- 4.4.1.2):• Weight of Image channels - It is used to give weight to different channels of the image which influences the segmentation. The weight is related to the type of images. In most cases, equal weights are given especially when only three channels are used, e.g. – Quickbird. In this case (fig.- 4.1.1.2), channel 4 of ASTER image is given no weight since it will not be used for the segmentation.
• Scale – Scale parameter is the most important to regulate the object size. The default size is 10. But, in most case, it is required to increase if the larger objects are required. The size of the objects increases with higher scale.
• Colour and Shape – These are the composition of homogeneity criteria and they are mutually exclusive. The higher the colour the less shape criterion influences the size of
• Smoothness and Compactness - These are the composition of homogeneity criteria and mutually exclusive like colour and shape.
• Level – It is used to mention the levels which directly influence the size of the objects.
Fig.- 4.1.1.2: Segmentation parameters for creating objects
However, although the quality of classification largely depends on the segmentation process which is influenced by those parameters but there is no created rule for choosing suitable segmentation criteria. The suitable criteria or parameters for different land cover can be achieved through trial and error process and by expert knowledge or previous experiences. The parameters used for the entire classification of the present study have been selected after trying the combination of several parameters. Parameter(s) used for one land cover might not be strong for another land cover. As for example, for artificial lake, higher value of shape should be consider where as colour is the primary criteria to distinct between water and forest. If only one level of segmentation is used where all land category are to be defined at once, in that cases those parameters are chosen such a way that fulfils the conditions for all land classes at optimum level. Manual object editing might be needed to refine the result of segmentation process which, in turn, improves the subsequent classification.
II. Classification: This classification process is based upon the fuzzy set theory, used in the
nearest neighbour method of classification and in the membership function (TSo & Mather, 2001). So, there are two classification techniques available in the software – nearest neighbour classifier which assigns class based on minimum distance measures and membership function in which classes are precisely described based on expert knowledge. Using the nearest neighbour classifier which is similar to supervised classification, training samples are required prior to the classification. On the other hand, the classification using membership function required good practical knowledge about the objects and the attributes used to define membership function for separation of classes. The nearest neighbour is quite easier compare to membership function method as it demands very good knowledge about the attributes of the image objects. But, membership function is more advanced and sometimes performing more effectively than nearest neighbour. Either one of the methods or both together can be used depending on the preferences, nature of images and expected accuracy of the outcome.
The Definiens offers some features which are used for class description. Those features can be utilized using both techniques. But, some features are only restricted to membership function (fig.- 4.1.1.3). The most commonly used features are (Baatz et al., 2004):
• Object features :
- Layer values of image bands (Mean, S.D., Mean Difference etc.) - Shape of objects (Area, Perimeter, Length/Width etc.)
- Texture (GLCM Statistics, Layer value texture etc.) - Hierarchy (Level, Number of neighbours etc.) • Class-related features:
- Relations to neighbour objects - Relations to sub objects - Relations to super objects - Relations to classification • Scene features:
- Class-related (Number of classified objects, area etc.) - Scene-related (Number of pixels, Number of objects etc.) • Logical terms:
- Operators for building expression and including more than one expression in the class description (And, Or, Not etc.)
Fig.- 4.1.1.3: Features used for Nearest Neighbour (L) and Membership Function (R) Layer values are most common feature used for almost every classification – it concerns about the pixel value of each image channel. Mean Layer value is most widely used (especially for nearest neighbour technique) for differentiating dissimilar features based on spectral values. Using layer value of one single band is also quite common to further refinement for separation of classes using membership function. As for example, NIR band has higher spectral value for