António Afonso, José Alves
Reconsidering Wagner's Law: evidence from the
functions of the government
WP09/2016/DE/UECE
_________________________________________________________
Department of Economics
W
ORKINGP
APERSReconsidering Wagner’s Law: evidence from the
functions of the government
∗
Ant´
onio Afonso
†Jos´
e Alves
‡March 2016
Abstract
We revisit Wagner’s law of increasing state expenditure by function of government expenditure. Using data of 14 European countries between 1996 and 2013, we apply panel data and SUR methods to assess public expenditure-income elasticities. We find that some functions of government spending for a few countries (e.g. Austria, France, the Netherlands, and Portugal) validate Wagner’s law. For the Netherlands expenditures with environment protection increase more than proportionately to eco-nomic growth, and for France that is the case of spending in housing and community amenities. In addition, Greece is the only country where two public spending items react more than one to one to growth.
Keywords: Fiscal Policies; Government spending; SUR estimation; Wagner’s Law. JEL: C33; E62; H50; O47.
∗The opinions expressed are those of the authors and not necessarily those of the respective employers.
†ISEG/UL - University of Lisbon, Department of Economics; UECE – Research Unit on Complexity
and Economics. UECE is supported by Funda¸c˜ao para a Ciˆencia e a Tecnologia (Portuguese Foundation
for Science and Technology). email: [email protected].
‡ISEG/ULisbon – University of Lisbon, R. Miguel Lupi 20, 1249-078 Lisbon, Portugal; UECE –
Research Unit on Complexity and Economics, R. Miguel Lupi 20, 1249-078, Lisbon, Portugal. email: [email protected].
1. Introduction
The role of the state in the economy has been a recurring debated subject, between politicians and the academic community. The different perspective – more liberal or more interventionist – about the government effect on macroeconomic dynamics has led to the analysis of government spending effects on economic activity. More liberal viewpoints claim for a lesser interventionist role of the state in economics. On the other hand, a more active behaviour, by the government on economic activity might induce better economic performance, through policies aiming at economic stabilization, leading and improving the welfare of all society.
The German economist Adolph Wagner in 1883 highlighted patterns in the relationship between the increase of public expenditures and economic growth, his so-called “Law of increasing state activity”. According to Peacock and Scott (2000), this law refers to an ab-solute and relative increase of the government within the economy, namely an expansion on providing defence, administrative, law, and education and welfare services, among others. Another view of how government should react to economic growth is the Fiscal Stimulus Hypothesis, where the government can implement counter-cyclical policies to reduce the impact of the business cycle. Finally, the Budget Stickiness Hypothesis argues that public spending should not change since public expenditure policies are targeted in a long-run perspective. Therefore, those policies could become too rigid to face short-run economic fluctuations.
We assess government expenditures’ response to an increasing economic activity, namely to verify an empirical validation of Wagner’s law by dissecting the expenditures by function of government, via the Classification of Functions of the Government (COFOG) nomen-clature.
Our results show that, when we analyse the various function of government expenditure, there are some evidences of Wagner’s law. Specifically, and analysing the behaviour of public expenditures of individual countries of our sample, we find that some countries such as Austria, France and Portugal highlight some patterns which suggest the validation of the law.
The remaining of this paper is organised as follows. Section Two provides the literature review. Section Three presents the methodology, the data and sources. Section Four provides the empirical analysis. The last section presents the conclusions.
2. Literature
Regarding earlier the articles studying Wagner’s law, we can for instance mention Ram (1987) who used data for 115 countries for the period 1950-1980, and find no support for the law. Bairam (1995) finds that only government spending not-related with defence supports the verification of the law for the United States.
Wahab (2004) splits the government expenditure-economic activity relationship be-tween periods with strong and weak economic growth, i.e., above, or at, and below eco-nomic growth trend, respectively. The author finds that there is an only limited evidence of Wagner’s law validation. Akitoby et al. (2006) determine a long-term relationship between economic activity and public expenditure, using data for 51 developing countries for a time span of 32 years. Kolluri and Wahab (2007) formulate a new empirical methodology to test Wagner’s law. The authors mention that government spending reacts more actively in economic slowdowns and report evidence supporting Wagner’s law for OECD countries but not for EU countries.
Shelton (2007) disaggregates the various rubrics of public spending and argues that the empirical validations depend upon the preferences of fiscal policies set by the governments. On the other hand, Durevall and Henrekson (2011) study the ratchet effect hypotheses for Sweden and United Kingdom since the XIX century until 2006. They find no long-run evidence empiricism of Wagner’s result, despite some evidence of public expenditures and growth relationship in some particular periods.
Magazzino (2011) studies the connection between spending and growth, controlling for money supply, for the Italian case during 20 years at a disaggregated level, and he finds that economic affairs and education favours the German economist perspective. For a 23 OECD country sample, between 1970 and 2006, Lamartina and Zaghini (2011) conclude that the poorer the country is, measured by the initial per capita GDP, and the higher is the elasticity between public expenditures and economic growth. This analysis made for the years between 1970 and 2006 give support to Wagner’s law validation. Br¨uckner et al. (2012) use panel data techniques and argue for support of Wagner’s phenomenon only when considering the upper bound for long-run estimations of income elasticity of government spending.
Kumar et al. (2012) study the issue for New Zealand, between 1960 and 2007, and reach the conclusion that the law is verified. Afonso and Jalles (2014) study the causal relation between spending and growth for 155 countries over 30 years. The authors’
con-clusions support the idea of a GDP per capita causality on government expenditures and, furthermore, the existence of Wagner’s law concept.
Kuckuck (201) studies the validity of the law for Italy, Denmark, Finland, Sweden and United Kingdom, concluding that the stronger is the evidence of Wagner’s phenomenon, the lower is the development stage of each country. Lastly, Fedeli (2015) assesses the linkage between regional per capita health care expenditures and per capita GDP for the Italian case between 1982 and 2009, via panel cointegration, reporting evidence for the validity of Wagner’s law.
3. Methodology and Data
3.1. Methodology
We assess Wagner’s law using two approaches. First, we will apply a panel data method-ology to compute the relevant coefficient regarding the law. In this framework, we use three data sets: 1) Full sample; 2) periods in which a country’s economic growth rate is at or above its economic growth rate trend; 3) periods with an economic growth rate below its trend. In the second approach, we apply a Seemingly Unrelated Regression (SUR) estima-tion, distinguishing each function of government expenditure-economic growth elasticity for every country in our sample. In the SUR approach, we do not split between above and below economic growth time trend.
Therefore, our regression for each function of government expenditure (GOVEXP) and for both approaches, for country i (i = 1, ..., N ) at time t (t = 1, ..., T ), is represented in the following form:
∆GOV EXPi,t = γ + β∆RGDPi,t+ ηi+ ϕt+ εi,t, (1)
where ηi, ϕt are the country-specific and time effects, respectively, and varepsiloni,t is
the independent errors across countries. For Wagner’s law of expanding state expenditure validation we may obtain a statistical significance of an elastic symmetric relationship between government expenditure and economic growth. As Kolluri and Wahab (2007) demonstrate, this would imply in our case that ∆GOV EXP ≥ ∆RGDP . In other words, the estimated regression coefficient associated to real GDP must be greater or equal than one (β ≥ 1).
endogeneity problems. Additionally, and in order to assume a residual heteroscedasticity, we also use the White diagonal covariance matrix.
3.2. Data
The model is estimated for the period between 1996 and 2013 for 14 European countries: Austria (AT), Belgium (BE), Denmark (DK), Finland (FI), France (FR), Germany (DE), Greece (GR), Ireland (IE), Italy (IT), the Netherlands (NL), Portugal (PT), Spain (ES), Sweden (SE) and the United Kingdom (UK).
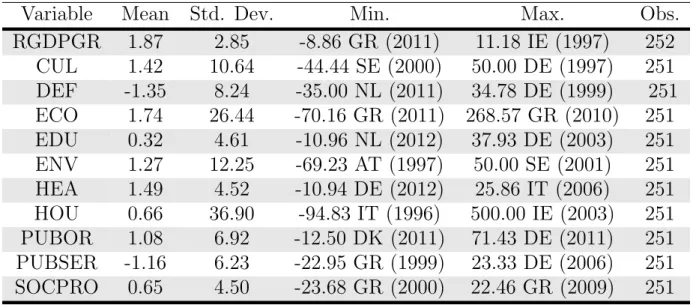
Our data was retrieved from International Monetary Fund sources. For the data regard-ing the evolution of economic activity, we use the annual growth rate of gross domestic product at constant prices (RGDPGR) from World Economic Outlook. From the Gov-ernment Financial Statistics, we use the annual growth rate of the following statistics of expenditures by function of government in percentage of GDP: culture, recreation and religion (CUL); defence (DEF); economic affairs (ECO); education (EDU); environment protection (ENV); health (HEA); housing and community amenities (HOU); public or-der (PUBOR); expenditures on general public services (PUBSER); and social protection (SOCPRO)1. We present in Table 1 the respective summary statistics.
1The ten United Nations COFOG categories are as follows: 01 – General public services; 02 – Defence;
03 – Public order and safety; 04 – Economic affairs; 05 – Environmental protection; 06 – Housing and community amenities; 07 – Health; 08 – Recreation, culture and religion; 09 – Education; 10 – Social protection.
Table 1: Summary statistics for the panel - 1996-2013 (annual growth rates)
Variable
Mean
Std. Dev.
Min.
Max.
Obs.
RGDPGR
1.87
2.85
-8.86 GR (2011)
11.18 IE (1997)
252
CUL
1.42
10.64
-44.44 SE (2000)
50.00 DE (1997)
251
DEF
-1.35
8.24
-35.00 NL (2011)
34.78 DE (1999)
251
ECO
1.74
26.44
-70.16 GR (2011)
268.57 GR (2010)
251
EDU
0.32
4.61
-10.96 NL (2012)
37.93 DE (2003)
251
ENV
1.27
12.25
-69.23 AT (1997)
50.00 SE (2001)
251
HEA
1.49
4.52
-10.94 DE (2012)
25.86 IT (2006)
251
HOU
0.66
36.90
-94.83 IT (1996)
500.00 IE (2003)
251
PUBOR
1.08
6.92
-12.50 DK (2011)
71.43 DE (2011)
251
PUBSER
-1.16
6.23
-22.95 GR (1999)
23.33 DE (2006)
251
SOCPRO
0.65
4.50
-23.68 GR (2000)
22.46 GR (2009)
251
Source: IMF, WEO, GFS, and own calculations.
4. Empirical Analysis
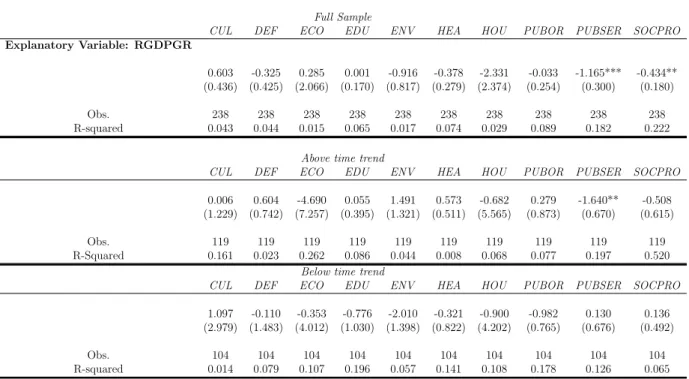
The results displayed in Table 2 show the absence of evidence of Wagner’s law. In fact, the few statistical significant coefficients of public expenditures obtained for some government spending functions support the existence of counter-cyclicality.
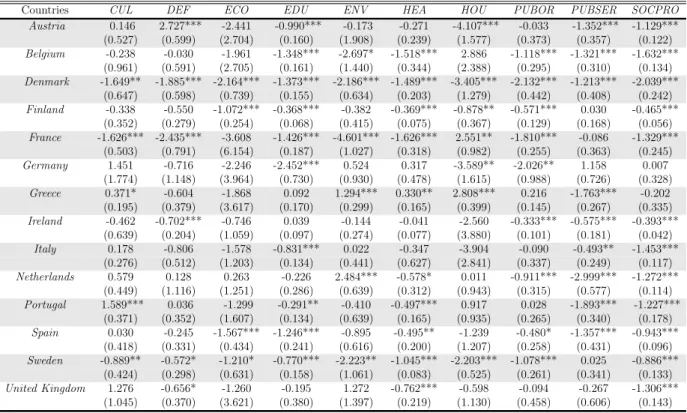
Nevertheless, in the SUR estimation we find some evidence of the law of increasing state activity for some countries and functions of government expenditures. In fact, for the expenditures regarding culture, recreation and religion, Portugal shows a statistical signifi-cant coefficient, and greater than one. With respect to defense, Austria shows an elasticity consistent with the German economist’s proposition. On the other hand, Netherlands seems to increase more than proportionately the expenditures with environment protec-tion, whilst for France spending in housing and community amenities increase more than the GDP growth rate. In addition, Greece is the only country with two public spending-economic performance elasticities greater than one.
Table 2: Panel coefficients estimates for Wagner’s law, 1996-2013, 2SLS
Full Sample
CUL DEF ECO EDU ENV HEA HOU PUBOR PUBSER SOCPRO Explanatory Variable: RGDPGR
0.603 -0.325 0.285 0.001 -0.916 -0.378 -2.331 -0.033 -1.165*** -0.434** (0.436) (0.425) (2.066) (0.170) (0.817) (0.279) (2.374) (0.254) (0.300) (0.180)
Obs. 238 238 238 238 238 238 238 238 238 238
R-squared 0.043 0.044 0.015 0.065 0.017 0.074 0.029 0.089 0.182 0.222 Above time trend
CUL DEF ECO EDU ENV HEA HOU PUBOR PUBSER SOCPRO 0.006 0.604 -4.690 0.055 1.491 0.573 -0.682 0.279 -1.640** -0.508 (1.229) (0.742) (7.257) (0.395) (1.321) (0.511) (5.565) (0.873) (0.670) (0.615)
Obs. 119 119 119 119 119 119 119 119 119 119
R-Squared 0.161 0.023 0.262 0.086 0.044 0.008 0.068 0.077 0.197 0.520 Below time trend
CUL DEF ECO EDU ENV HEA HOU PUBOR PUBSER SOCPRO 1.097 -0.110 -0.353 -0.776 -2.010 -0.321 -0.900 -0.982 0.130 0.136 (2.979) (1.483) (4.012) (1.030) (1.398) (0.822) (4.202) (0.765) (0.676) (0.492)
Obs. 104 104 104 104 104 104 104 104 104 104
R-squared 0.014 0.079 0.107 0.196 0.057 0.141 0.108 0.178 0.126 0.065 Notes: *, ** and *** represent statistical significance at levels of 10%, 5% and 1% respectively. The robust standard errors are in brackets. The White diagonal covariance matrix is used in order to assume residual heteroscedasticity.
Table 3: SUR estimation of Wagner law, 1996-2013.
Countries CUL DEF ECO EDU ENV HEA HOU PUBOR PUBSER SOCPRO
Austria 0.146 2.727*** -2.441 -0.990*** -0.173 -0.271 -4.107*** -0.033 -1.352*** -1.129*** (0.527) (0.599) (2.704) (0.160) (1.908) (0.239) (1.577) (0.373) (0.357) (0.122) Belgium -0.238 -0.030 -1.961 -1.348*** -2.697* -1.518*** 2.886 -1.118*** -1.321*** -1.632*** (0.961) (0.591) (2.705) (0.161) (1.440) (0.344) (2.388) (0.295) (0.310) (0.134) Denmark -1.649** -1.885*** -2.164*** -1.373*** -2.186*** -1.489*** -3.405*** -2.132*** -1.213*** -2.039*** (0.647) (0.598) (0.739) (0.155) (0.634) (0.203) (1.279) (0.442) (0.408) (0.242) Finland -0.338 -0.550 -1.072*** -0.368*** -0.382 -0.369*** -0.878** -0.571*** 0.030 -0.465*** (0.352) (0.279) (0.254) (0.068) (0.415) (0.075) (0.367) (0.129) (0.168) (0.056) France -1.626*** -2.435*** -3.608 -1.426*** -4.601*** -1.626*** 2.551** -1.810*** -0.086 -1.329*** (0.503) (0.791) (6.154) (0.187) (1.027) (0.318) (0.982) (0.255) (0.363) (0.245) Germany 1.451 -0.716 -2.246 -2.452*** 0.524 0.317 -3.589** -2.026** 1.158 0.007 (1.774) (1.148) (3.964) (0.730) (0.930) (0.478) (1.615) (0.988) (0.726) (0.328) Greece 0.371* -0.604 -1.868 0.092 1.294*** 0.330** 2.808*** 0.216 -1.763*** -0.202 (0.195) (0.379) (3.617) (0.170) (0.299) (0.165) (0.399) (0.145) (0.267) (0.335) Ireland -0.462 -0.702*** -0.746 0.039 -0.144 -0.041 -2.560 -0.333*** -0.575*** -0.393*** (0.639) (0.204) (1.059) (0.097) (0.274) (0.077) (3.880) (0.101) (0.181) (0.042) Italy 0.178 -0.806 -1.578 -0.831*** 0.022 -0.347 -3.904 -0.090 -0.493** -1.453*** (0.276) (0.512) (1.203) (0.134) (0.441) (0.627) (2.841) (0.337) (0.249) (0.117) Netherlands 0.579 0.128 0.263 -0.226 2.484*** -0.578* 0.011 -0.911*** -2.999*** -1.272*** (0.449) (1.116) (1.251) (0.286) (0.639) (0.312) (0.943) (0.315) (0.577) (0.114) Portugal 1.589*** 0.036 -1.299 -0.291** -0.410 -0.497*** 0.917 0.028 -1.893*** -1.227*** (0.371) (0.352) (1.607) (0.134) (0.639) (0.165) (0.935) (0.265) (0.340) (0.178) Spain 0.030 -0.245 -1.567*** -1.246*** -0.895 -0.495** -1.239 -0.480* -1.357*** -0.943*** (0.418) (0.331) (0.434) (0.241) (0.616) (0.200) (1.207) (0.258) (0.431) (0.096) Sweden -0.889** -0.572* -1.210* -0.770*** -2.223** -1.045*** -2.203*** -1.078*** 0.025 -0.886*** (0.424) (0.298) (0.631) (0.158) (1.061) (0.083) (0.525) (0.261) (0.341) (0.133) United Kingdom 1.276 -0.656* -1.260 -0.195 1.272 -0.762*** -0.598 -0.094 -0.267 -1.306*** (1.045) (0.370) (3.621) (0.380) (1.397) (0.219) (1.130) (0.458) (0.606) (0.143) Notes: *, ** and *** represent statistical significance at levels of 10%, 5% and 1% respectively. The robust standard errors are in brackets. The White diagonal covariance matrix is used in order to assume residual heteroscedasticity.
5. Conclusions
We assessed Wagner’s proposition throughout functions of government spending for 14 EU countries in the period 1996-2013. Applying panel data and SUR estimation techniques we have found some evidence of Wagner’s result.
Looking in detail to the public spending-economic growth elasticities, some functions of government spending for a few countries (e.g. Austria, France, the Netherlands, and Portugal) do validate Wagner’s law. For instance, for the Netherlands expenditures with environment protection increase more than proportionately to economic growth, and for France that is the case of spending in housing and community amenities. In addition, Greece is the only country where two public spending items react more than one to one to growth.
Therefore, and even is some cases there is counter-cyclicality in several government spending items in the full panel sample, the existence of higher than unity elasticities vis-`a-vis economic growth hints at the Wagner’s regularity.
References
Afonso, A. and Jalles, J. T. (2014). Causality for the government budget and economic growth. Applied Economics Letters, 21(17):1198–1201.
Akitoby, B., Clements, B., Gupta, S., and Inchauste, G. (2006). Public spending, vorac-ity, and wagner’s law in developing countries. European Journal of Political Economy, 22(4):908 – 924.
Bairam, E. I. (1995). Level of aggregation, variable elasticity and wagner’s law. Economics Letters, 48(3–4):341 – 344.
Br¨uckner, M., Chong, A., and Gradstein, M. (2012). Estimating the permanent income elasticity of government expenditures: Evidence on wagner’s law based on oil price shocks. Journal of Public Economics, 96(11–12):1025 – 1035.
Durevall, D. and Henrekson, M. (2011). The futile quest for a grand explanation of long-run government expenditure. Journal of Public Economics, 95(7–8):708 – 722.
Fedeli, S. (2015). The impact of gdp on health care expenditure: The case of italy (1982–2009). Social Indicators Research, 122(2):347–370.
Kolluri, B. and Wahab, M. (2007). Asymmetries in the conditional relation of government expenditure and economic growth. Applied Economics, 39(18):2303–2322.
Kuckuck, J. (201). Testing wagner’s law at different stages of economic development. FinanzArchiv, 70(1):128–168.
Kumar, S., Webber, D. J., and Fargher, S. (2012). Wagner’s law revisited: cointegration and causality tests for new zealand. Applied Economics, 44(5):607–616.
Lamartina, S. and Zaghini, A. (2011). Increasing public expenditure: Wagner’s law in oecd countries. German Economic Review, 12(2):149–164.
Magazzino, C. (2011). Disaggregated public spending, gdp and money supply: Evidence for italy. European Journal of Economics, Finance and Administrative Sciences, (41):118– 131.
Peacock, A. and Scott, A. (2000). The curious attraction of wagner’s law. Public Choice, 102(1/2):1–17.
Ram, R. (1987). Wagner’s hypothesis in time-series and cross-section perspectives: Ev-idence from ”real” data for 115 countries. The Review of Economics and Statistics, 69(2):194–204.
Shelton, C. A. (2007). The size and composition of government expenditure. Journal of Public Economics, 91(11–12):2230 – 2260.
Wahab, M. (2004). Economic growth and government expenditure: evidence from a new test specification. Applied Economics, 36(19):2125–2135.