DOCUMENTOS DE TRABALHO
WORKING PAPERS
ECONOMIA
ECONOMICS
Nº 03/2012
EMPIRICAL DETERMINANTS OF GOVERNMENT
EFFICIENCY: A STUDY BASED ON OBJECTIVE
INDICATORS
Francisca Guedes de Oliveira
Universidade Católica Portuguesa (Porto)
Empirical Determinants of Government
Efficiency: A study Based on Objective
Indicators
Francisca Guedes de Oliveira
Universidade Católica Portuguesa
Centro Regional do Porto
Faculdade de Economia e Gestão
Rua Diogo Botelho 1327
4169-005 Porto Portugal
March 8, 2012
Abstract
This paper is concerned with two things: finding an objective and easily quantifiable measure of government efficiency and testing possible determinants of such quality. As measures of government efficiency we use the ratios of infant mortality rate to health expenditures as a percentage of GDP and the ratios of drop out and illiteracy rates to education expen-ditures as a percentage of GDP. We assume that government efficiency in providing health and education services depends on economic, political and cultural factors.
Keywords: Government quality; Public good provision; Efficiency; po-litical determinants, cultural determinants, economic determinants.
1
Introduction
Nowadays a consensus has emerged that the efficiency of governments has an impact on a country’s economic performance. High quality of public institutions - and of governments more generally - is viewed as necessary to assure that policies have a positive and lasting effect on income (Tanzi 2000). Assuming the relative importance of good government, this paper addresses two related issues of great interest: how can government efficiency be measured and why do some countries have better government than others?
It is essential to start by defining what government efficiency is. In La Porta et al (1999), good government stands for ”good-for-capitalistic development”. Following this perspective the authors propose several measures of performance: a good government protects property rights, intervenes little and taxes lightly; it has a small dimension and a well- functioning bureaucracy free of corruption; it is politically free and sustained by a democracy; it provides public goods of high quality and, finally, it is efficient.
Some of these aspects generate controversy as they clearly have an ideological content, as for instance low taxes and little intervention.
As to corruption and limitations to political freedom it can be argued that more than proxies of good governing they determine the existence of good or bad public institutions, which in turn may be able to provide better or worse services. The same reasoning can be applied to bureaucratic systems: a well-functioning bureaucracy can bee seen as a proxy or as a cause of good gov-ernment. Following Brixiová (2001) we will consider bureaucracy as a possible determinant of government quality: ”Bureaucratically organized systems tend to be less efficient...”.
Contrary to other measures of government quality the provision of public goods of superior quality is quite consensual. However assessing public good quality can be as challenging as measuring government quality itself.
We seek to improve upon the existing measures of government efficiency which can be of a qualitative nature or supported on subjective responses to survey questions such as those carried out by the international country risk guide.
In this paper we use the term good government to stand for a government that provides services in essential sectors like health and education in an
effi-cient way, i.e., where the relation between output indicators and the amount of resources necessary to achieve them is high. Our measures compare govern-ment output in a given sector with the amount of resources/money necessary to provide that output1. Health and education are two of the most important sec-tors of government provision (St. Aubyn et al., 2004). According to the World Development Indicators, average health expenditure (public and private) in the nineties was around 5,5% of GDP in the United Sates and United Kingdom, al-most 7% in Belgium, Canada, Denmark, Norway or Switzerland and above 7% in Germany, France and Sweden. The data on education is as striking. In USA and UK more than 5% of GDP was spent in education; in Canada and Finland this number rises to almost 7% and in Denmark, Norway or Sweden it goes way beyond 7%. In addition, in these two sectors there are ample quantifiable measures of output as well as information on sectorial public spending.2 So as measures of government efficiency we use the ratios of infant mortality rate to health expenditures as a percentage of GDP and the ratios of drop out and illit-eracy rates to education expenditures as a percentage of GDP. We believe that one of our contribution to the literature is providing new quantifiable measures of government efficiency, different but related to the qualitative measures used thus far.
As to the determinants of government efficiency, we believe there are struc-tural factors that affect beliefs and behavior and that lend inertia to any institu-tional change. At the same time institutions tend to be created or transformed when the benefits of innovation are patently greater than the costs of inertia. Whereas determinants such as major religion and the origins of the legal sys-tem may mostly relate to very long-term determinants of government efficiency, variables such as wealth and openness alter the trade-off between the benefits and costs of institutional change and test the policy and structural variables that affect government efficiency. We test the importance of the determinants of government grouped as economic, political and cultural factors.
Concerning economic factors and following La Porta et al. (1999) we can claim that institutions are created whenever the benefits of their existence are
1Virtually any specific service can be provided and financed by the state and/or the private
sector so government efficiency needs to take into account the source of the financing.
2In St. Aubyn et al., (2004), the authors use essentially the same measures but their
concern is to evaluate the performance of those sectors. As the authors point out ”We intend to measure inefficiency and not so much explain it”. In this paper we try not so much to explain inefficiencies in the health or educational systems per se, but inefficiencies in the government provision of public services (using education and health as examples).
greater than the costs os their creation. Wealth and development would make this trade-off in favor of good governance, not only because development would make good institutions affordable but also because it would make them more re-liable. In Afonso and St. Aubyn (2004) the authors suggest that different levels of GDP per capita or educational attainment by the adult population (which could serve as a proxy for the level of development) could be decisive in explain-ing differences in government efficiency across countries.3 We will consider a set of indicators that represent characteristics that differentiate the way societies are shaped relating to their level of development. In particular, concentration of urban population and the population age composition. The first can be re-lated to the proximity to the decision makers. If the population, in general, is located in or around cities, where the number (and sometimes the quality) of hospitals and schools is bigger, will it interfere with the efficiency in which the government is able to render its services? In Alejandro and Ernesto (2000) the authors establish a link between the growth rate of urban concentration and the ability of central authorities to provide adequate public services. Although in Ades and Glaeser (1995) the authors defend a clear link between political factors and urban concentration. The second tells us that the age structure of the population is often seen as a sign of development. In Fougére and Merette (1999) the authors establish and empirical relation between ageing population and growth. There is also some literature that addresses the effects of the in-verted demographic pyramid and public spending in education or health (see Cattaneo and Wolter (2009) or Getzen (1991)).
In terms of political factors, the theory of political determinants of insti-tutions states that those in power will shape policies and instiinsti-tutions to allow them to remain in power and transfer resources toward themselves (La Porta et al (1999)). Some groups and some societies allow rent seeking behavior in a more generalized way than others. When this kind of behavior becomes per-vasive and/or the groups in power care more about their own interest than common interest, worse governance is the most likely outcome. In La Porta et al. (1998), ethnic heterogeneity is used as a proxy for these political factors: if there are several groups with different interests, the eagerness to stay in power
3There are other variables that could indicate the level of development. In Evans et al
(2001) references are made to geographical location as an important factor in explaining the poor performance of some governments.
will be bigger. Governments become more interventionist and less efficient and the quality of public goods falls4. A member of a certain group will use its power to generate benefits to the members of his group. In Lutz-Alexandre and Muthoo (2003) the authors refer to the fact that the reluctance in changing inefficient institutions into more efficient ones has also to do with the existence of different groups with different bargaining power. In Alesina et al (2003) the authors refer to links between inefficient policies and ethnic diversity. They claim: ”Conflicts of preferences, racism, prejudices often lead to policies which are suboptimal from the point of view of a society as a whole”.
Social polarization is also related to the existence of groups with different and often opposed interests. Once again, when polarization is significant, we tend to have worse governments. In Keefer and Knack (2002) the authors refer that this factor alone can diminish the ability of government response to a crisis as well as the stability of its decisions. Inequality in income distribution is one of the main causes of social polarization.
The rent seeking behavior described above, will distort the way institutions work making them more prone to corruption, excessive bureaucracy, etc. In Mauro (2002) it is argued that corruption lowers investment (public or private) distorting it (in a worse way than taxes Sheleifer and Vishny(1993)) in such a way that will surely affect efficiency. In Aziz and Ul Haque (1998) the authors consider that weak and inefficient governments are typically built around rent seeking elites. In Gupta et al. (2000) the authors provide evidence that reducing corruption increases efficiency or at least improves the quality of the outputs measured by infant mortality and primary school drop out rates. InTanzi and Davoodi (2000), the authors state that corruption may have negative impacts in terms of public spending in education and health. If we assume that the amount spent by a given government is the ”correct” one, if corrupt agents reduce it than it will necessarily generate inefficiencies. Also concerning corruption and efficiency, Tanzi and Davoodi (1997) show evidence that corruption may increase public investment but will diminish its productivity.
In a related issue there is also some literature that deals with excessive bu-reaucracy and inefficiencies of the public sector. Rauch(1995) makes reference to the public provision of inputs that are complementary to the private sector.
This provision tends to decrease in countries with a non-professional state bu-reaucracy. Referring also to bureaucracy Brixiová and Bluir (2001) state that systems with excessive bureaucracy tend to generate less efficient institutions.5 We will use some variables related with diversity and others with distor-tions to the normal functioning of institudistor-tions as proxies of political theories of institutional performance.
Finally as for the cultural factors, theories supporting cultural determinants of institutions rely on the fact that societies have beliefs that induce collective actions and make certain kind of behaviors more probable. When these beliefs are strongly persistent they tend to be associated with culture (La Porta et al. (1999)). An excessive intolerance or lack of self confidence can make it impossi-ble for a society to have good institutions and consequently good governments. In La Porta et. al (1997) the authors state that ”trust determines the perfor-mance of a society’s institutions”. In Barro and McClay (2001) the authors discuss the role of religion in a country’s institutional development. Religion can be seen as a proxy of cultural characteristics since it strongly influences individual and social actions. The authors establish a link between religion and corruption showing some evidence that Protestant countries are less corrupt than Catholic ones. In La Porta et al (1998) it is found that there is a negative association between trust and the dominance of the main religion. It could be argued that if different groups with different power hinder government quality, then the existence of several religious groups would have a negative impact on government quality. We believe that both arguments put forward concerning re-ligious diversity may be true. However, and following the related literature, we believe that the positive effect of religious diversity (which will lead to greater trust and tolerance) may surpass the negative impact (presence of different so-cial groups with different and colliding interests). Nevertheless the direction of the effect of religious fractionalization on government efficiency remains to be seen. We will also test if the dominance of one particular religion is relevant to government performance.
Another possibility to account for the cultural diversity among countries is their legal system. The legal system adopted by a country can be very closely
5In Aziz and Ul Haque (1998) the authors sustain this idea when saying: ”Africa has
stagnated because its governments are weak and inefficient and often times made up of narrow rent seeking elites”.
related to the kind of habits and practices of its inhabitants (La Porta et al (1997)). Following the literature we will consider five possible legal origins: Socialist, Scandinavian, English Civil law, French Civil law and German legal tradition.
The paper is structured as follows: in section 2 we will present the data and the indicators that assess government quality as well as the variables that are representative of each group of determinants described above. In section 3 we present and discuss the regression results exploring the data in order to find a meaningful relation between efficiency and its determinants. Finally in section 4 we conclude.
2
Data
2.1
Definitions and Sources
The analysis presented in this paper uses a set of variables covering up to 208 countries. The definition and sources of all the variables are summarized in Table 1, appendix A. For all variables, we used five year averages (1970 to 1974; 1975 to 1980, etc.) .
2.2
Dependent Variables
In this paper we try to build quantifiable and objective measures of government performance. We selected Education, one of the fundamental sectors in almost any country around the world and use two measures of output (Drop out rate and illiteracy rate). We confirm our results testing also a health sector indicator (infant mortality)6. Our main focus is the efficiency in the use of government resources, which means that more than being concerned with the output we are interested in its relation with the amount of resources spent to deliver it. For that purpose we do not use output per se but ratios of each of the output vari-ables to public spending in the corresponding sector. We selected the following measures of government performance:
6As we refered previously these are the two sectors that consume consitently a bigger cut
infant mortality rate
public health expenditures as a percentage of GDP
drop−out rate
public education expenditures as a percentage of GDP
illiteracy rate
public education expenditures as a percentage of GDP
Notice that, for all measures, if we increase the numerator for the same denominator we are in a worse situation which means that a higher value means worse performance. However if we increase the denominator maintaining the numerator (for example we increase health expenditures and infant mortality rate remains the same) the ratio decreases and we are also worse of. Because we cannot have different readings for the same variation of the measure we decided to redefine our ratios in the following way:
100−infant mortality rate
public health expenditures as a percentage of GDP 100−drop−out rate
public education expenditures as a percentage of GDP 100−illiteracy rate
public education expenditures as a percentage of GDP
The three indicators for government efficiency divide a positive output mea-sure by the expenditure incurred. Thus, an increase in the value of any of the indicators can be interpreted as an increase in government efficiency. It means that governments are able to deliver more for a lower cost.
Although there is no doubt that the input measures in the denominator are measures of public sector inputs, it could be argued that the output measures in the numerator depend at least as much on private investment. Thus these output measures would be only partly the consequences of governmental activities. To overcome this doubt we correlated each of our indicators with public and private spending in both the health and the education sectors. We found, while having positive correlations with both variables, the correlation with public spending was at least five times higher than with private spending. This leads us to conclude that those are much more dependent on public rather than private investment.
We analyzed the relation between the subjective measures of efficiency used in the literature such as political rights index, corruption index or bureaucracy
index [La Porta et al (1997)]. We found that there were positive correlations but far from 1. We believe that although we might be talking about similar realities our variables are, in fact, capturing new information.7
2.3
Regressors
As independent economic variables we use per capita GDP, the percentage of urban population, the age structure of the population, the sector structure of employment, openness to trade and to foreign direct investment, and the share of government expenditure in GDP .
As to political determinants, we used ethnic fractionalization index and gini index to account for the number of different groups. To asses the degree of distortion induced in the normal functioning of institutions we use tow indexes: political freedom and law and order tradition. More likely law and order dis-tortions associated to high corruption and excessive bureaucracy will lead to less investment (public or private) and to the channeling of investment towards the interests of certain groups, as in Sheleifer (1993). The relationship between public and private sectors will also be damaged by the prevalence of distortions in the political process, as shown in Rauch (1995). The absence of political or civic liberties themselves can also damage government efficiency. As noted by the authors of Tavares (2001), ”Democracy may also influence the ”quality of governance”: rulers with discretionary power tend to set up distortionary poli-cies that benefit a small set of insiders at the expense of the general population (...). The exercise of power is potentially more arbitrary in autocratic regimes that lack public scrutiny of policy makers”.
As to cultural determinants, we use religious fractionalization, the main religion in the country , and the origins of a country´s legal system .
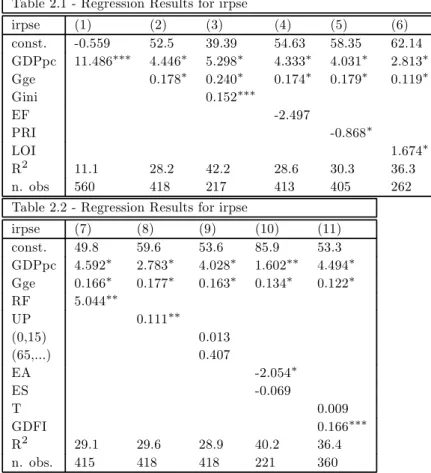
Table 2.1 to Table 2.6 present the main regression results. We start by ver-ifying our intuition that income is positively related to government efficiency, patent in the positive and significant coefficient for income per capita. A sec-ond issue was the relation between government size and government efficiency:
7It could be argued that a government could be extremely efficient but because previous
governments were very inefficient it would be difficult to increase our output indicators. One way to overcome this issue is to consider variation of output measures. We believe that considering averages we tackle this issue, if not completely at least to some considerable extent. If a country has a very bad government followed by a very efficient one it will come out as having a moderate quality government.
is there a trade-off between the two, or, on the contrary, countries that can ”afford” larger governments also tend to have more efficient governments? We found that general expenditures are positively and significantly associated with government performance, independent of the relation between either to income per capita. Though the literature is ambiguous on the relation between size and government efficiency, our data using objective indicators of efficiency delivers a strong result. We then add political and cultural indicators to determine their relevance in explaining different government performance. We can also verify that urban population is statistically relevant and positively associated with government efficiency. This means that rather than being a proxy for the level of underdevelopment, urban concentration makes it easier to provide good quality services. The age structure of the population does not have a consistent effect on government efficiency. As to the employment structure, an interesting result emerges: the more agricultural oriented a society is, the less efficient its government will be, but the percentage of employment in services is also detri-mental to government efficiency. While gross foreign direct investment has no relevance in explaining government efficiency, openness to trade does matter and has a positive effect on all indices considered. In the literature there is evidence of a linkage between this indicators and efficiency using the subjective indica-tors of government performance. The authors in Larain (2007) conclude that both foreign direct investment and openness have a positive effect on corruption (meaning less corruption)
According to the literature, we expected that larger differences between groups within a society — be it income inequality or ethnic differences - leads to social polarization and government inefficiency. While the introduction of the Gini income inequality and the ethnic fractionalization indices do not alter results on income per capita and government size, the results for the former are not consistent, though ethnic fractionalization has a statistically significant negative impact on infant mortality . In the second set of political variables we observe that increases in the law and order index and in political rights are associated with increases in government performance. However, the later index is only statistically relevant in the first regression.
Cultural traditions that favor trust and confidence, that protect the individual against the state and that limit the power of politicians should im-prove government efficiency. According to La Porta (1997), there is a negative
association between trust and the dominance of a strong religion. Hence, reli-gious fractionalization may lead to higher government efficiency if societies are able to overcome differences. A related issue has to do with the influence of the country’s main religious confession in government efficiency. Following La Porta (1998) and Barro (2000), we expect that Protestant countries have more efficient governments than Catholic or Muslim ones. Our results allow us to conclude that religious fractionalization has, in fact, a positive effect on gov-ernment efficiency, the case being stronger in the education sector. Religious dummies for the main religious denomination in the country do not have rel-evance in determining government performance, and the same is true for the country’s legal system.
Table 2.1 - Regression Results for irpse
irpse (1) (2) (3) (4) (5) (6) const. -0.559 52.5 39.39 54.63 58.35 62.14 GDPpc 11.486∗∗∗ 4.446∗ 5.298∗ 4.333∗ 4.031∗ 2.813∗ Gge 0.178∗ 0.240∗ 0.174∗ 0.179∗ 0.119∗ Gini 0.152∗∗∗ EF -2.497 PRI -0.868∗ LOI 1.674∗ R2 11.1 28.2 42.2 28.6 30.3 36.3 n. obs 560 418 217 413 405 262 Table 2.2 - Regression Results for irpse
irpse (7) (8) (9) (10) (11) const. 49.8 59.6 53.6 85.9 53.3 GDPpc 4.592∗ 2.783∗ 4.028∗ 1.602∗∗ 4.494∗ Gge 0.166∗ 0.177∗ 0.163∗ 0.134∗ 0.122∗ RF 5.044∗∗ UP 0.111∗∗ (0,15) 0.013 (65,...) 0.407 EA -2.054∗ ES -0.069 T 0.009 GDFI 0.166∗∗∗ R2 29.1 29.6 28.9 40.2 36.4 n. obs. 415 418 418 221 360
Table 2.3 - Regression Results for dorpse dorpse (1) (2) (3) (4) (5) (6) const. 63.49 62.34 46.74 60.59 64.87 59.55 GDPpc 3.619∗ 3.016∗ 3.979∗ 3.146∗ 2.785∗ 3.079∗ Gge 0.212∗ 0.269∗ 0.213∗ 0.214∗ 0.179∗ Gini 0.131 EF 1.724 PRI -0.221 LOI 0.634 R2 22.1 28.6 33.5 28.7 28.4 33.7 n. obs. 459 380 220 380 374 215 Table 2.4 - Regression Results for dorpse
dorpse (7) (8) (9) (10) (11) const. 61.04 60.233 66.35 77.88 59.97 GDPpc 0.343∗ 3.549∗ 3.329∗ 3.138∗ 3.109∗ Gge 0.207∗ 0.214∗ 0.219∗ 0.146∗ 0.186∗ RF 2.987∗∗∗ UP -0.047 (0,15) -0.113 (65,...) -0.427 EA -0.143∗ ES -0.225∗ T 0.027∗ GDFI 0.076 R2 28.9 28.8 28.9 55.9 30.3 n. obs. 380 380 375 191 328 Table 2.5 - Regression Results for mrihepu
mrihepu (1) (2) (3) (4) (5) (6) const. -41.66 -31.58 44.88 -4.773 -16.52 -28.63 GDPpc 15.232∗ 12.463∗ 5.951∗ 10.841∗ 11.201∗ 11.855∗ Gge 0.407∗ 0.259∗∗ 0.297∗∗ 0.417∗ 0.362∗∗ Gini -0.355∗∗ EF -26.390∗ PRI -1.486∗∗∗ LOI 0.470 R2 42.5 47.0 43.8 49.8 47.3 48.3 n. obs. 328 231 149 227 222 190
Table 2.2 - Regression Results for mrihepu mrihepu (7) (8) (9) (10) (11) const. -32.09 -21.42 81.56 89.82 -44.13 GDPpc 12.525∗ 9.207∗ 8.416∗ 6.212∗ 13.265∗ Ge 0.395∗ 0.451∗ 0.677∗ 0.199∗∗∗ 0.244∗∗ RF 0.688 UP 0.255∗ (0,15) -2.059∗ (65,...) -3.272∗ EA -1.039∗ ES -0.770∗ T 0.138∗ GDFI -0.073 R2 47.7 48.4 52.3 55.9 29.6 no obs. 229 231 223 194 215
∗signif icantat1%; ∗ ∗ signif icantat5%; ∗ ∗ ∗significantat10% 2.3.1 Endogeneity Issues
The main question of this paper is weather a country’s economic, political or cultural conditions explain the differences in government performance. we are aware that this is a difficult task because most of the variables considered may, in turn, be influenced by government quality (this being particularly true in the case of economic factors). there is some literature on the tight link between institutions and development or wealth and most of them address endogeneity issues. In particular the seminal work of Acemoglu et al. (2001), try to establish that income today is determined by a proxy for institutional quality and other non economic variables. The authors address the problem of the possible endo-geneity of institutional quality: good institutions can foster wealth but richer countries can afford institutions of an higher quality. The problem is apparently solved by using settler mortality as an instrumental variable. There were some criticism of the work of Acemouglu et al. (2001) namely a paper by Albouy (2004). This issue is complex and probably the biggest weakness of research concerning institutional quality and GDP (or other measures of richness).
To trust in our results we wanted to confirm if we had major endogeneity issues with our variables.
We used the Hausman test for endogeneity that can briefly be explained as follows :
Suppose that we are running the regression:
We suspect that y2 may be endogenous (we assume that all Xi are exoge-nous). To perform the test we first regress y2 against all the variables X in the previous model and a set of instrumental variables Z.
y2i= β1+ β2X2i+ ... + βkXki+ α1Z1i+ ... + αjZji+ υi (2) if y2is exogenous, than E(µi, υi) = 0. This would mean that E(y1i, υi) = 0. We can run the regression:
y1i= β1+ β2X2i+ ... + βkXki+ δy2i+ ρυi+ εi (3) An test the hypothesis : H0: ρ = 0. Under H0 y2 is exogenous.
So, the first thing we have to do is to find instrumental variables for all the variables we want to test.
Previously we concluded that loggdppc was one of the main determinants of government efficiency variability around the world. Following the literature we were particularly concerned with the possible endogeneity of this variable. We choose latitude as an instrumental for loggdppc8 and run the Hausman test9. In table 3 v1are the estimation residuals of 1 .
Table 3 irpse dorpse mrihepu v1(coefficient) 1.859 3.118 26.158
t-stat 0.31 0.50 3.56 P > |t| 0.756 0.618 0.000
We can see from the results that loggdppc seems to be exogenous to the model (at least when we are talking about education).
Because of the nature of the variable we were also interested in testing en-dogeneity of general expenditures. We used as instruments for government expenditures both the electoral rule (Majorit) and the political regime (Pres). The link between electoral institutions and the size and composition of public expenditures can be seen in (Miles-Ferretti et al., 2000). In Person (2001) the authors conclude that political institutions (such as electoral rules and political regimes) do shape economic policy and consequently are linked to the size of
8In (Hall et al., 1999) the authors conclude that there is a strong link between output per
worker and social infrastructure using latitude as an instrument.
9To run the Hausman test we chose the variables that were more consistently significant
public expenditures10. In table 4 u
1are the estimation residuals of 1 . The con-clusion are not as reassuring as the one we draw for loggpdpc, although at 5% we can say that the variable is exogenous in terms of the education regressions.
Table 4 irpse dorpse mrihepu u1 (coefficient) 0.322 0.218 0.827
t-stat 1.98 0.1.57 2.58 P > |t| 0.057 0.12 0.011
1 0For more on the relation between political institutions and public spending see also Persson
3
Conclusion
We examine the relationship between indicators of government efficiency in the health and education sector and several of its aggregate determinants. We confirm our initial intuition that income is positively related to government effi-ciency made clear by the positive and significant coefficient of income per capita in all regressions. We also verify that general expenditures are positively and significantly related with government performance. We can then conclude that the most consistent and robust determinants of government efficiency are the level of income per capita, with richer countries displaying higher government efficiency, and government size, with increases in the amount spent by general government as share of GDP positively related to efficiency.
Urban population is statistically relevant and positively associated with gov-ernment efficiency. This means that a higher share of the population in urban areas makes it easier to provide good public services.
The age structure of the population does not have a consistent effect on government efficiency. On the other hand, agricultural oriented societies lead to less efficient governments. The data also indicates that high percentages of employment in services does not foster government quality.
In terms of openness we conclude that while foreign direct investment has no relevance in explaining government efficiency, openness to trade does matter and is good for efficiency.
We also find some evidence that the existence of different groups in society has some bearing in government performance, while political rights and law and order affect government performance in a positive manner.
As to cultural factors, only religious fractionalization seems to matter, with the main religious denomination irrelevant for government efficiency.
We can conclude that there is a wide range of factors contributing to dif-ferences in government efficiency across the world. We have economic, political and cultural variables all relevant to government efficiency. However the data points out that income per capita and government size stand as particularly important.
References
[1] Acemoglu, Daron; Johnson, Simon and Robinson, James A., " The colonial Origins of comparative Development: An Empirical Investigation", The American Economic Review, Vol. 91, No 5 pp. 1369-1401, Dec. 2001 [2] Albouy, David; "The Colonial Origins of Comparative development: A
Reinvestigation of the Data" University of California - Berkeley July (2004) [3] Ades, A. and Glaeser, E. ” Trade and Circuses: Explaining Urban Giants”,
Quarterly Journals of Economics, 110(1), pp.195-228, 1995
[4] Alesina, Alberto and La Ferrara, Eliana, ”Eth-nic Diversity and Economic Performance”, Dec. 2003 http://post.economics.harvard.edu/faculty/alesina/papers.html
[5] Alesina, Alberto; Baqir, Reza and Easterly, William, 1999, "Public Goods and Ethnic Divisions", The Quarterly Journal of Economics 114(4), 1243-1248.
[6] Alesina, Alberto; Devleeschauwer, Arnaud; Easterly, William; Kurlat, Sergio and Wacziarg, Romain, ”Fractionalization”; Journal of Economic Growth, vol.8, no2, June 2003, pp. 155-194
[7] Aziz, Jahangir and Ul Haque, Nadeem, ”Second Generation Civil Service Reform in Africa” IMF WP/98/164, Nov. 1998
[8] Barro, Robert J. and McClay, Rachel M., (2001) ”Reli-gion, Economy and Society in an International Panel Data”, http://www.wcfia.harvard.edu/seminars/papergroups/barro.pdf
[9] Barro, Robert J. and McClay, Rachel M., ”Religion and Political Economy in an International Panel”, Harvard University, May 2 2002
[10] Becker, Gary S., ”A Theory of Competition Among Pressure Groups for Political Influence”, Quarterly Journal of Economics, vol. 98, no 3, Aug. 1983
[11] Brixiová, Zusana and Bulir, Ales, ”Growth Slowdown in Bureaucratic Eco-nomic Systems: An Issue Revisited”, IMF WP/01/6 Jan. 2001
[12] Bush, Lutz-Alexandre and Muthoo, Abhinay, (2003)”Power and In-efficient Institutions” http://www.essex.ac.uk/economics/discussion-papers/papers-text/dp561.pdf
[13] Evans, David B; Tandon, Ajay; Murray, Christopher J.L. and Lauer, Jeremy A., ” The Comparative Efficiency of National Health Systems in Producing Health: An analysis of 191 Countries”, GPE Discussion Paper Series no29, World Health Organization (2001)
[14] Fougére, Masime and Mérette Marcel, (1999), "Population Ageing and Eco-nomic Growth in 7 OECD Countries", EcoEco-nomic Modelling, Vol. 16, Issue 3, pp. 411-427
[15] Gaviria, Alejandro and Stein, Ernesto, ” The Evolution of Urban Concen-tration Around the World: a Panel Approach”, Banco Interamericano de Desarollo, Departamento de Investigacion, Working Paper no4, April 2000 [16] Getzen, Thomas E. (1991), "Population Ageing and the growth of Health expenditures", The Journal of Gerontology, vol. 47, Issue 3, pp.S98-S104. [17] Gupta, Sanjeev; Davoodi Hamid and Tiongmon, Erwin, ” Competition and
the Provision of Health Care and Education Services”, IMF WP/00/116, June 2000
[18] Hall, Robert E. and Jones, Charles I.; ”Why do Some Countries Produce so Much More Output per Worker than Others?”, Quarterly Journal of Economics, Feb. 1999, Vol. 114, pp 83-116
[19] Knack, Stephen and Zax, Paul J., "Trust and Growth", Economic Journal, Vl. 111, no 470, Mar. 2000
[20] La Porta, Rafael; Lopez-de-Silanes, Florencio; Shleifer, Andre and Vishny, Robert, ”Trust in Large Organizations”, America Economic Review Papers and Proceedings vol. 87, no 2, pp. 333-338, May 1997
[21] La Porta, Rafael; Lopez-de-Silanes, Florencio; Schleifer, Andrei and Vishny, Robert, (1999), "The Quality of Government", The Journal of Law Eco-nomics and Organization 15 (1), 222-279.
[22] Mauro, Paolo (1995), "Corruption and Growth" Quarterly Journal of Eco-nomics, vol. 110 pp. 681-712
[23] Miles-Ferretti, Gian Maria; Perotti, Roberto and Rostagno, Massimo; ”Electoral Systems and Pub-lic Spending”, Nov. 2000, http://www.igier.uni-bocconi.it/who.php?vedi=1657&tbn=albero&id_folder=117
[24] Milesi-Ferrati, Gian Maria and Perotti, Roberto with Rostagno, Massimo, ”Electoral Systems and Public Spending” Nov. 2000
[25] Persson, Torsten and Tabellini, Guido, ”The Size and Scope of Government: Comparative Politics with Rational Politicians”, European Economic Re-view, 43, pp. 699-735, 1999
[26] Persson, Torsten; ”Do Political Institutions Shape Economic Policy?” NBER WP No8214, 2001
[27] Rauch, James E, "Bureaucracy, Infrastructure and Economic Growth: Ev-idence from U.S. Cities During the Progressive Era", The American Eco-nomic Review, vol. 108, pp. 968-979, Set. 1995
[28] Sheleifer, Andrei and Vishny, Robert W., ”Corruption” Quarterly Journal of Economics, vol. 108, pp. 599-617, 1993.
[29] St. Aubyn, Miguel and Afonso, António, ”Non Parametric Approaches to Education and Health Expenditures Efficiency in OECD Countries” ISEG-UTL Economics Working Papers No1 Jan. 2004
[30] St. Aubyn, Miguel, ”Evaluating Efficiency in the Portuguese Health and Education Sectors”, Economia, vol. 26, Oct. 2003
[31] Tanzi, Vito and Davoodi, Hamid R., ” Corruption, Growth and Public Finance”, IMF WP/00/182, Nov. 2000
[32] Tanzi, Vito and Davoodi, Hamid R., ”Corruption, Public Investment and Growth”, IMF WP/97/139, Oct. 1997
[33] Tavares, José and Wacziarg, Romain, ”How Democracy affects Growth” European Economic Review, vol. 45, pp. 1341-1378, 2001
[34] Freedom House (2003), ”Freedom House Country Ratings”, http://www.freedomhouse.org, Freedom House, New York
[35] International Country Risk Guide (2003), ”Financial, Politi-cal and Economic Risk Ratings for 140 Countries”, PRS Group http://www.prsgroup.com/icrg/icrg.html
Appendix A
Table 1
Name Description Source
dor drop out rate Barro (1996) Education expenditures public public education expenditures, % gdp WDI 2000 Employment agriculture (EA) employment agriculture, % total WDI 2000 Employment services (ES) employment services, % total WDI 2000
Ethn frac. (EF) Index ethnic fractionalization Alesina et al (1999) Gov. expenditures (Gge) Central government expenditures, % gdp WDI 2000
Gini Index Gini index WDI 2000 Foreign direct Invest. (GFDI) Gross foreign direct investment, % gdp WDI 2000 Health expenditures public Public Health expenditures, % gdp WDI 2000 Illiteracy rate Illiteracy rate, adult (above 15) WDI 2000 Income per capita (GDPpc) gdp constant prices 1995 US$, per capita WDI 2000
Law and order index (LOI) Law and order index Freedom House 2003 mri Mortality rate infant WDI 2000
% Pop [0, 15[ (0;15) Population∈[0; 15]% total population WDI 2000 % Pop [65, ...[ (65,...) Population≧65, % total population WDI 2000
Political rights index (PRI) Political rights index Freedom House 2003 Religious frac. (RF) Religious fractionalization index La Porta et al (1999) Trade % gdp (T) Exports + Imports, % gdp WDI 2000