Introduction
Forest and woodland are recognized as important multi-functional resources (Slee, 2005) providing a wide variety of social, economic and environmental benefits, ranging from easily quantified economic va-lues associated with forest products and less tangible services and contributions to society, to environmen-tal amenities related to air purification, carbon seques-tration and prevention of land degradation and deser-tification (Führer, 2000; FAO, 2010).
The natural vegetation in most of Europe is essen-tially forest and woodland from the Mediterranean through the deciduous forests of Central and Western Europe to the boreal forests in Fennoscandia (Bengtsson et al., 2000). European forests occupy 1.02 billion ha
corresponding to 25% of the total forested area world-wide. Over the last 20 years, the forested area has ex-panded in all European regions and has gained 0.8 mi-llion ha each year (Forest Europe, 2011) except in southern European countries, where fires burnt large areas every year (Schmuck et al., 2011). These coun-tries are an integral part of the Mediterranean region with a temperate type of climate characterized by rainy mild winters and warm dry summers associated to geographical and topographical variation related to the presence of variable coastline and of many mountain ranges. The above mentioned climate characteris-tics of the region sustain the Mediterranean fo-rests, woodlands and shrub vegetation. Forests and woodlands of Mediterranean region cover about 80 million hectares, almost 9% of the region’s land area and constitute a unique world natural heritage in terms of biological diversity, a high degree of tree richness and endemism with extraordinary genetic diversity
Land cover fire proneness in Europe
Mario G. Pereira
1,2*, Jose Aranha
1and Malik Amraoui
2,31 Centro de Investigación e de Tecnologias Agro-Ambientais e Biológicas, CITAB, Universidade de Trás-os-Montes
e Alto Douro, UTAD, Quinta de Prados, 5000-801 Vila Real, Portugal. 2 Instituto Dom Luiz (IDL),
University of Lisbon. Lisbon, Potugal. 3 Universidade de Trás-os-Montes, UTAD, Quinta de Prados,
5000-801 Vila Real, Portugal
Abstract
Aim of study: The characterization of the fuels is an important aspect of the fire regime in each specific ecosystem while fire is an important disturbance for global vegetation dynamics. This study aims to identify and characterize the spatial and temporal evolution of the fire incidence and of the vegetation types that are most affected by forest fires in Europe, with emphasis on the mixed forests.
Area of study: Europe.
Material and methods: Corine Land Cover maps for 2000 and 2006 (CLC2000, CLC2006) and burned area (BA) perimeters, from 2000 to 2013 in Europe are combined to access the spatial and temporal evolution of the types of vegetation that are most affected by fires using geostatistics and Geographical Information System (GIS) techniques. Main results: The spatial and temporal distribution of BA perimeters, vegetation and burnt vegetation by fires was performed and different statistics were obtained for Mediterranean and northern Europe, confirming the usefulness of the used land cover classification. A fire proneness index (FPI) is proposed to assess the fire selectivity of land cover classes, to quantify and compare the propensity of vegetation classes and countries to fire.
Research highlights: Mixed forests area is 5% of total European area but has increased 2.1% from 2000 to 2006, while other forest types followed an opposite trend. FPI for scrubs is twice (quadruple) of the value for the forests (agricultural areas) except during the occurrence of mega fire events, when the LCC of forest present higher FPI than the LCC of scrub.
Key words: fire proneness; mixed forests; land cover/land use; fire regime; Europe; GIS; corine land cover.
* Corresponding author: gpereira@utad.pt Received: 20-04-14. Accepted: 13-10-14.
eISSN: 2171-9845
which must be preserved (Scarascia-Mugnozza & Matteucci, 2012).
Fires affect a larger area over a wider variety of bio-mes across the globe than any other natural distur-bance to land-based eco-systems (Lavorel et al., 2007; Ichoku et al., 2008). On this respect, the Medi-terranean region occupies a prominent position, given the occurrence of devastating summertime fires that burn hundreds of thousands hectares of forests, scru-blands and grasslands every year, causing extensive economic and ecological losses and often human ca-sualties (Pyne, 2006; Ventura & Vasconcelos, 2006). A recent review on the role of natural disturbances in European forests from 1850 to 2000 reveals that fires are the second most important disturbance (after the storms) been responsible for 16% of total damage over the 1950-2000 period (Schelhaas et al., 2003). A com-bination of natural factors (vegetation stress, slopping topography, weather and climate), with a long history of human management practices of natural environ-ments by means of fire, that favour anthropogenic ig-nitions in the Mediterranean countries, makes this re-gion especially prone to the occurrence of a large number of fire events and to the onset of extreme fire episodes that determine per se the majority of the to-tal amount of burnt area (hereafter, BA) in a whole fi-re season (Viegas et al., 1992; Pefi-reira et al., 2005; Pyne, 2006; Benson et al., 2008; Rasilla et al., 2010; Amraoui et al., 2013). Therefore, it is not surprising that the largest numbers of f ires and burnt area in Europe are found in southern European countries, namely Portugal, Spain, France, Italy and Greece (Pereira et al., 2006; Schmuck et al., 2011; Amraoui et al., 2013). On the other hand, several authors repor-ted that the Mediterranean region is considered a “hot spot” for climate change studies, not only because of its high sensitivity to changes in recent decades (Qin et al., 2007; Solomon et al., 2007) but also for the most likely evolution of this region towards a hotter and drier climate, with a significant higher risk of intense heat wave episodes that favour the occurrence of large ve-getation fires (Fischer and Schär, 2010; Lindner et al., 2010; Pereira et al., 2013).
There is a long-term interaction between vege-tation and f ire regime in the Mediterranean region (Colombaroli et al., 2007). Fire selectivity has been studied for vegetation classes in terms of fire frequency and fire size in Canton Ticino, Switzerland (Pezzatti et al., 2009) and Portugal (Barros & Pereira, 2014), alone or integrated with other landscape variables such
as topography (slope, aspect, elevation) and distance to roads and towns in central Spain (Moreno et al., 2011) and northern Portugal (Carmo et al., 2011), to test the sensitivity of the landscape to forest fires in peri-urban area of Athens, Greece, to land cover chan-ges (Salvati & Ferrara, 2014) and to define landscape management guidelines and policies based on the re-lationships between landscape and fires in the Medi-terranean region (Moreira et al., 2011). These studies inspired the present work which aims to: (i) analyse the spatial and temporal variability of these statistics within the European countries; and, (ii) identify and characterize the land cover classes most affected by fi-res and consequently their f ire proneness, devoting special attention to mixed forests.
This work is also motivated by the need to study: (a) the propensity of fire on a continental scale, taking in-to account the spatio-temporal variability of land co-ver and fire incidence in Europe; (b) the propensity of fire in the different sub classes of forest and scrubland, taking advantage of the large number of classes of Co-rine Land Cover database, which was developed spe-cifically for Europe; and, (c) using the most comple-te, reliable, larger and updated datasets.
Material and methods
To achieve the purposed objectives, this study must rely on land cover and f ire datasets with detailed spatial information as those obtained from satellite me-asurements and provided in GIS framework. The for-mer is the Corine Land Cover (hereafter, CLC) data-base which was finalized in the early 1990s as part of the European Commission programme to COoRdina-te INformation on the Environment (Corine) and it pro-vides consistent, reliable and comparable informa-tion on land cover across Europe (Stathopoulou and Cartalis, 2007). This study is based on the CLC inven-tories for 2000 (hereafter, CLC2000) and 2006 (here-after, CLC2006). Detailed information about the CLC may be found in European Environment Agency web-site and on official publications of the European Com-munity (Annoni and Perdigao, 1997; Büttner et al., 2004).
The CLC has a standardized nomenclature based mainly upon physiognomic attributes of landscape ob-jects and spatial relationships of the landscape obob-jects with three class levels (Feranec et al., 2010). In this study, a specific combination of first, second and third
level CLC classes was considered resulting in the following set of 11 Land Cover Classes (LCC): Arti-f icial surArti-faces, Agricultural areas, Broad-leaved Arti- fo-rest, Coniferous fofo-rest, Mixed fofo-rest, Natural grass-lands, Sclerophyllous vegetation (which comprises the Moors and heathland, Sclerophyllous vegetation, Tran-sitional woodland-shrub and Sparsely vegetated areas CLC classes), Non vegetated areas (that encompasses the Beaches, dunes, sands, Bare rocks and Burnt areas), Glaciers and perpetual snow, Inland water (which is the union of Inland marshes, Peat bogs, Salt marshes, Salines, Intertidal flats, Water courses, Wa-ter bodies and Coastal lagoons) and Estuaries, coastal water and sea (which represents the Estuaries and Sea and ocean CLC classes). In general, results obtained for the non-flammable LCC are not presented in the Tables and Figures nor discussed in the manuscript. Since the CLC2006 does not contain information for Greece, this country was not considered in some of the analysis performed and, in those cases, Greek data was excluded from the CLC2000.
The fire database is composed by the perimeters of area burnt by f ires in Europe provided by the Euro-pean Forest Fire Information System (EFFIS). This comprehensive dataset (hereafter, EFFIS) comprises f ire records for 21 European countries (Bulgaria, Croatia, Cyprus, Czech, Estonia, Finland, France, Ger-many, Greece, Hungary, Italy, Latvia, Lithuania, Po-land, Portugal, Romania, Slovakia, Spain, Sweden, Switzerland and Turkey) recently updated for the 14-year period defined between 2000-2013. The EFFIS database contains a total of 15,518 fire records provi-ding a detailed description of the shape, size and loca-tion (geographical coordinates as well as the country, province and place) of each fire. However, the com-plete f ire ignition date information (day, month and year) is only available for 8,784 f ires which corres-ponds to 57% of total number of fires (NF) while for the remaining records only the year of occurrence is provided. For this reason, this study was performed at annual temporal scale. For proper comparison purpo-ses, the BA in each country should be normalized, by dividing the annual total values by each country land area.
The CLC and EFFIS databases were managed, analysed and combined with GIS to assess the amount of each LCC’s area burnt by fires in each year, by in-tercepting the yearly BA perimeters with the LCC for the most recent previous year. For example, perime-ters for the periods of 2000-2006 and 2007-2013
we-re combined with CLC2000 and CLC2006, we- respecti-vely. Descriptive statistics were used to perform exploratory data analysis to characterize the spatial distribution and temporal evolution of BA in most affected LCC. Two specific spatial/geo statistical me-thods were used in this study: the Kappa test (Cohen, 1960) to compare LCC changes in time; and the Glo-bal Moran’s I test (Anselin, 1995) which is a spatial autocorrelation statistic, to describe the overall depen-dence of fire perimeters over the entire region. The Co-hen’s k is defined by
k = (na– nε) / (n – nε),
where n is the number of subjects, nathe number of
agreements and nεthe number of agreements due to
chance. Assuming the independency of CLC classifi-cations and taking into account the large size of the Corine database, k is normally distributed, the stan-dard error and the 95% conf idence interval may be easily computed.
In this study, a fire proneness index (FPI) is propo-sed to assess the fire propensity of the different LCC to fire in Europe. The FPI is defined as the ratio bet-ween the area burned by fire in each class (BAi) and
the area of each class (LCCAi),
FPI = (BAi) / (LCCAi)
The assessment of the fire proneness of the land co-ver types took into account the eventual changes in the area of the LCC over time.
Results
Obtained results for the spatial distribution and the temporal evolution of land cover/land use types, fire incidence and fire proneness will be presented in the following subsections.
Land use/land cover types
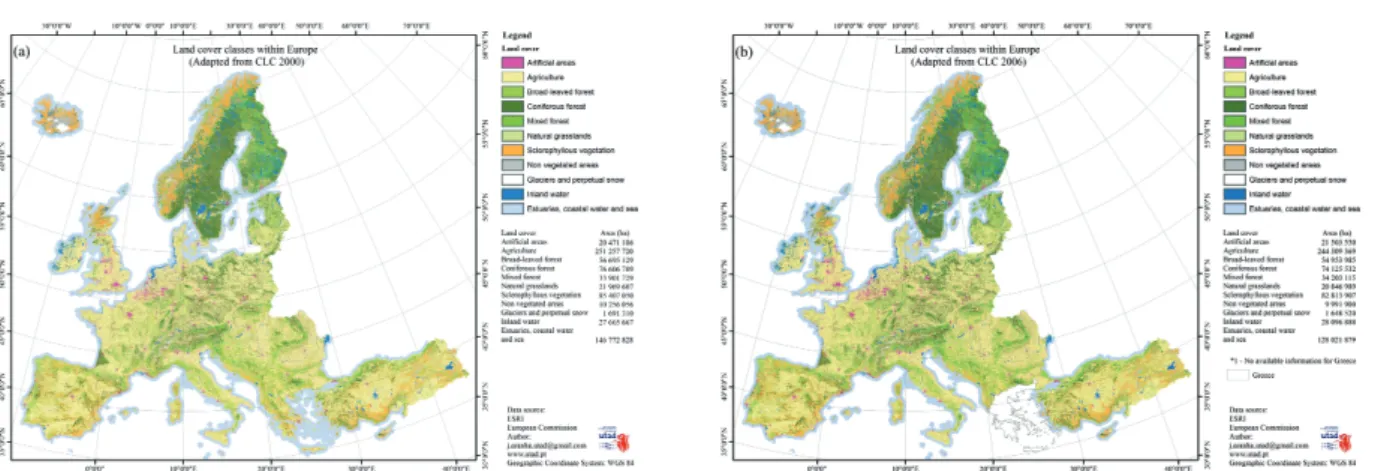
The most important features of the spatial distribu-tion of the land use/land cover in Europe (Fig. 1) are: (i) the apparent contrast between the highly forested Sweden and Finland and the remaining Europe domi-nated by Agricultural areas in the low lands and fo-rests in the highlands; (ii) the high abundance of Scle-rophyllous vegetation in Norway and Iceland; and, (iii) the low amount of the European area devoted to non-flammable LCC (e.g., Non vegetated areas and
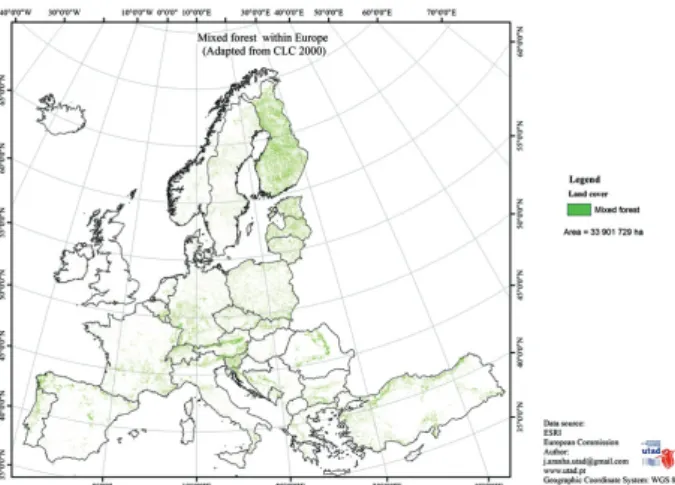
artifi-cial areas, surrounding the most important cities). In 2000, the vegetation classes that occupy higher per-centage of total area (Table 1) are Agricultural areas (34%), forests (23%) and scrubs (15%), here defined as the LCC of Sclerophyllous vegetation and Natural grasslands. The forested area is dominated by Conife-rous forests (11%) and Broad-leaved forests (8%). The Mixed forests occupy only 5% of total area, are rela-tively wide spread within continental Europe (Fig. 2) but are particularly concentrated around the Baltic Sea (Finland, Baltic States and Poland), Alpine states, Tur-key and NW Iberia.
Changes between the CLC2000 and CLC2006 classi-fications for entire Europe were evaluated using the Cohen’s kappa coeff icient and obtained result (k = 0.963) points for an excellent agreement. In fact, from 2000 to 2006, the percentage of total area of each
LCC did not change much (< 0.3%) in time except in the area devoted to agriculture (0.7%) and occupied by Sclerophyllous vegetation (0.5%). Maximum rela-tive differences from 2000 to 2006 were detected on the non-flammable land cover types. The area covered by Sclerophyllous vegetation and Natural grasslands increased (1.4% and 0.2% respectively) whereas the Coniferous and Broad-leaved forests present a cumu-lative recumu-lative decrease of 3.3%. On the contrary, Mi-xed forests have increased 2.1%.
Fire incidence
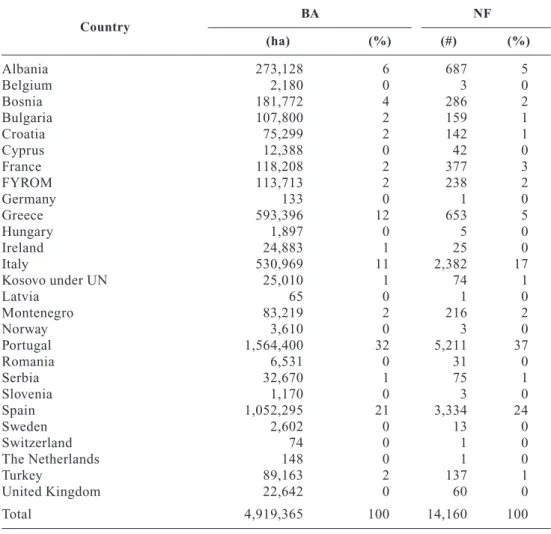
According to the EFFIS database, the Mediterra-nean countries are the most prone for fires (Table 3). In fact, by decreasing order of total BA, Portugal,
Table 1. Total and relative area of each Land Cover Type (LCC) in Europe for the two assessment years of 2000 and 2006
Area
Land cover class (LCC) 2000 2006
(ha) (%) (ha) (%) Artificial surfaces 20,171,326 2.9 21,503,550 3.1 Agricultural areas 245,850,008 35.1 244,309,369 34.9 Broad-leaved forest 55,436,997 7.9 54,953,985 7.8 Coniferous forest 75,834,087 10.8 74,125,532 10.6 Mixed forest 33,464,345 4.8 34,203,115 4.9 Natural grasslands 20,764,441 3.0 20,846,989 3.0 Sclerophyllous vegetation 81,587,010 11.6 82,813,907 11.8
Non vegetated areas 10,200,693 1.5 9,991,900 1.4
Glaciers and perpetual snow 1,764,581 0.3 1,648,520 0.2
Inland water 27,375,728 3.9 28,096,888 4.0
Estuaries, coastal water and sea 128,066,418 18.3 128,021,879 18.3
Sum 700,515,634 100.0 700,515,634 100.0
Figure 1. Land Cover Classes (LCC) for Europe based on a specific combination of first, second and third level the Corine land
cover classes respecting to (a) 2000 and (b) 2006.
Spain, Greece, Italy and France accounts for an im-pressive 78% of the grand total burnt area by f ires within Europe during the 2000-2013 period. These southern European countries account for an even hig-her fraction (83%) of the total number of fire records but with a higher NF in Italy than in Greece. Only two other European countries (Albania and Bosnia) pre-sent values of fire incidence comparable to those of the lesser affected southern European countries (Fran-ce and Gree(Fran-ce, respectively). For this reason, most of this study will be focused on Mediterranean Europe.
Total, relative (to take into account the country si-ze) and average fire incidence statistics (Table 4) also help to put in evidence the distinct magnitude of this hazard within the Mediterranean region. All fire sta-tistics, except average fire size, are much higher for Portugal than for the other countries. For example, the ratio between the NF in Portugal and in each of the other countries ranges between 2.4 (with Spain) to 13.2 (with Greece) while the correspondent fraction for BA ranges between 1.3 (also with Spain) and 11.2 (with France). Opposite results are obtained for the average size of fires where the lowest values are obtained for Portugal and Italy and are about half of those obtained for Spain and France and nearly a sixth of the annual average fire size in Greece.
The spatial distribution of the fire incidence are only shown for these five most affected countries (Fig. 3) because the BA perimeters are almost imperceptible in the other European Countries. The obtained spatial pattern is also non-uniform, revealing regions with high density of fire polygons, namely the Northern half of Portugal, Spanish region of Galicia, southern Italy, Greek regions of Peloponnese and southern Euboea
and the islands of Corsica, Sardinia and Sicily. Large fire perimeters are also found in the southern coast of Portugal and eastern Spain. France is much less affec-ted by fires and the BA are concentraaffec-ted near the Me-diterranean coast.
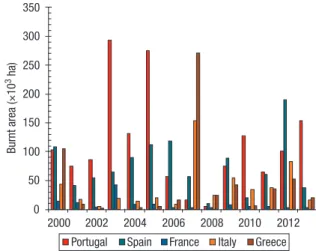
The evolution of total annual BA (Fig. 4) reveals a pronounced inter-annual variability with maximum va-lues registered in 2003 and 2005 in Portugal, 2007 in Greece and Italy, and 2012 in Spain. In the fourteen years of the study period, values of annual BA are hig-her in Portugal and/or Spain in ten years and in Italy and/or Greece in just two years. Maximum fire
recu-Table 2. Total and relative area of Mixed Forests in each European country for the year 2000
Country Area (ha) (%) Austria 1,296,133 3.8 Belgium 277,611 0.8 Bulgaria 643,358 1.9 Switzerland 470,874 1.4 Cyprus 614 0.0 Czech Republic 613,160 1.8 Germany 2,420,192 7.1 Denmark 131,947 0.4 Estonia 854,535 2.5 Greece 409,661 1.2 Spain 1,542,830 4.6 Finland 9,030,859 26.6 France 1,930,892 5.7 Croatia 268,501 0.8 Hungary 162,452 0.5 Ireland 22,418 0.1 Iceland 7,984 0.0 Italy 1,066,019 3.1 Liechtenstein 4,299 0.0 Lithuania 747,564 2.2 Luxembourg 16,174 0.0 Latvia 1,219,769 3.6 Montenegro 104,514 0.3 Macedonia 53,946 0.2 Malta 102 0.0 Netherlands 94,789 0.3 Norway 485,820 1.4 Poland 2,266,032 6.7 Portugal 545,907 1.6 Romania 1,035,207 3.1 Sweden 1,653,998 4.9 Slovenia 462,583 1.4 Slovakia 363,802 1.1 Turkey 3,646,001 10.8 United Kingdom 51,182 0.2 Sum 33,901,729 100.0
Figure 2. Spatial distribution of the Mixed forests in Europe
rrence is very similar in Portugal and Italy (where the same parcel may burn 6-7 times in the last 14 years) and much higher than for Spain, Greece and France (3-4 times).
The results of this subsection lead to focus the following analysis on the countries of southern Euro-pe with the exception of Greece because the CLC2006 do not comprise information for this country.
Table 3. Fire incidence in European countries. Total and relative number of fires (NF) and bur-ned area (BA) for the countries contemplated in EFFIS fire database for the 2000-2013 period
Country BA NF (ha) (%) (#) (%) Albania 273,128 6 687 5 Belgium 2,180 0 3 0 Bosnia 181,772 4 286 2 Bulgaria 107,800 2 159 1 Croatia 75,299 2 142 1 Cyprus 12,388 0 42 0 France 118,208 2 377 3 FYROM 113,713 2 238 2 Germany 133 0 1 0 Greece 593,396 12 653 5 Hungary 1,897 0 5 0 Ireland 24,883 1 25 0 Italy 530,969 11 2,382 17 Kosovo under UN 25,010 1 74 1 Latvia 65 0 1 0 Montenegro 83,219 2 216 2 Norway 3,610 0 3 0 Portugal 1,564,400 32 5,211 37 Romania 6,531 0 31 0 Serbia 32,670 1 75 1 Slovenia 1,170 0 3 0 Spain 1,052,295 21 3,334 24 Sweden 2,602 0 13 0 Switzerland 74 0 1 0 The Netherlands 148 0 1 0 Turkey 89,163 2 137 1 United Kingdom 22,642 0 60 0 Total 4,919,365 100 14,160 100
Table 4. Absolute and relative fire incidence statistics for the most affect Mediterranean coun-tries of Europe in the period 2000-2013. Descriptive statistics includes absolute total number of fires (NF) and burned area (BA), and relative to country land area (CLA), maximum fire recurrence, annual averaged NF, BA and size of the fire (BA/NF)
Country France Greece Italy Portugal Spain
Total number of fires (NF) (#) 410 771 3,482 10,143 4,190
Maximum fire recurrence (#) 3 4 6 7 4
Total burned are (BA) (×103ha) 116 565 467 1,304 1,003
Land area (LA) (×106ha) 55 13 30 9 50
BA/LA (%) 0.211 4.279 1.553 14.656 2.011
NF/LA (%) 0.001 0.006 0.012 0.114 0.008
Annual average BA (ha) 8,304 40,328 33,386 93,117 71,639
Annual average NF (#) 29 55 249 725 299
Fire proneness
The relative burnt area in each LCC for each and for all of the four Mediterranean countries together are pre-sented in Fig. 5. At regional scale, about 60% of the total burnt area occur in the Sclerophyllous vegetation (42.5%) and Agricultural areas (17.6%). These results are a
con-sequence of the higher relative burnt area in the Scle-rophyllous vegetation for Portugal, Spain and France (bet-ween 45% and 49%) and in the Agricultural areas for Italy (40%). Percentage of total burnt area is similar (10%) for Natural grasslands, Coniferous and Broad-leaved forests but much smaller for Mixed forests (6.1%).
Figure 3. Perimeters of area burnt by fires in the five most
af-fect Mediterranean countries of Europe in the 2000-2013 period.
0 50 100 150 200 250 300 350 2000 2002 2004 2006 2008 2010 2012 Burnt area ( × 10 3 ha)
Portugal Spain France Italy Greece
Figure 4. Total annual burnt area in the five most affect
Medi-terranean countries of Europe. Same colour palette for coun-tries as Fig. 3.
Figure 5. Total burnt area in each land cover class (BAi) in percentage of total burnt areas in all land cover classes (ΣBAi) for each
and for and all (Total) of the four southern European countries most affected by fires. Same colour palette for countries as Fig. 3.
Portugal Spain France Italy Total
Artificial Agricultural Broad-leaved Coniferus
Mixed forest Natural Sclerophyllous Non vegetated
surface areas forest forest grassland vegetation areas
Portugal 0.2% 14.3% 11.6% 13.4% 6.7% 6.4% 44.6% 2.9% Spain 0.4% 13.0% 6.4% 11.1% 7.0% 10.8% 48.6% 2.7% Franee 1.1% 7.7% 7.2% 10.5% 7.8% 15.7% 45.7% 6.3% Irtaly 0.7% 39.4% 10.4% 3.2% 2.4% 20.2% 23.1% 0.6% Total 0.4% 17.4% 9.6% 10.9% 6.1% 10.3% 42.5% 2.6% BA/ Σ BA i (%) 60 50 40 30 20 10 0
As expected, LCC of forest, scrub (Sclerophyllous vegetation and Natural grassland) and Agricultural areas account for 93% (in France) to 99% (in Italy) of total area burnt by fires. However, the distribution of the BA in different LCC is not uniform between the four countries. The percentage of BA in agriculture, forest and scrub classes is about 39%, 16% and 43% for Italy, about 10%, 25% and 60% for Spain and Fran-ce and 14%, 32% and 51% for Portugal. In general, the values for the Mixed forests are the lowest obtained for the three forest types and about half of the remain-der in Portugal.
These results already integrate the changes in time of each LCC’s area. In spite of the Cohen’s k confirm the excellent agreement (k= 0.947) between the CLC2000 and CLC2006 for the four southern Euro-pean countries (regional scale) there are signif icant relative changes at local scale, namely in Portugal (Fig. 6). However, the percentage of total burnt area in each LCC do not take into account the total area of the LCC nor eventual differences in the structure of land cover/land use between the Mediterranean countries.
The FPI allows the comparison of the f ire prone-ness for different LCC in the Mediterranean Europe and among the countries of this region (Fig. 7). The
FPI is very small for the Agricultural areas, in both re-gional and country scales, a consequence of the high total area of this LCC. FPI is moderate for forest and high for the scrub LCC. At regional scale, the Mixed forests presents higher FPI than the other forest classes. This is also the case for Spain and France whi-le the Coniferous forests presents the higher FPI in Portugal and Italy. The temporal evolution of the FPI of each LCC in each country (Fig. 8) highlights the anomalous value of FPI for the Non vegetated areas in 2000 and the high FPI of the scrubs classes throughout the years except in the years of high BA in Portugal and Spain. Actually, the LCC with higher FPI for Por-tugal in the years of 2003 and 2005 are the Coniferous and Broad-leaved forests whereas for Spain in 2006 is the Mixed forests.
Discussion
The higher fire incidence in the southern European countries have been evidenced by several studies using other databases (Pereira et al., 2011; Schmuck et al., 2011). This result is most likely due to the temperate type of climate of this region (Peel et al., 2007) that
Figure 6. Relative changes, from 2000 to 2006, in the area of each land cover class (LCC) in the four Mediterranean countries of
Europe most affect by fire. Same colour palette for countries as Figure 3.
40 30 20 10 0 –10 –20 –30 –40 (LCC2006-LLC2000)/LCC2000 (%)
Artificial surfaces Agricultural areas
Portugal Spain France Italy
Broad-lea ved forest Coniferous forest Mixed forest Na tural grasslands Sc lerophyllous vegeta tion Non vegeta ted areas
Glaciers and perpetual sno
w
Inland wa
ter
Estuaries,
coastal wa
favors the existence and growth of the vegetation du-ring the mild and rainy winters and its hydric and ther-mal stress during the hot and dry summers (Pereira et al., 2013). Portugal is the most affected country, with about one third of the total NF and BA, a position that is even enhanced by relative fire statistics. However, in contrast, Portugal presents the smallest average fi-re size which is consistent with the highly asymmetric fire-size distribution in this country, where 10% of the largest fires are responsible for 90% of total burnt area (Pereira et al., 2011). The spatial distribution of the fi-re perimeters in Southern Europe, shows clustering patterns (Figure 3) similar to those identified and cha-racterized in previous studies (Krawchuk et al., 2009; Bowman et al., 2013).
Consequently, the Global Moran’s I test was applied to BA perimeters map in order to analyse the existen-ce of spatial autocorrelation using several options (e.g. inverse distance, inverse squared distance, Euclidean distance and Manhattan distance). Obtained results al-ways indicated that BA are randomly scattered by landscape. These results are due to BA spatial distri-bution characteristics within the four countries in analysis: Portugal, Spain, France and Italy. While for North Portugal average distance between burnt areas
is around 2,500 m, in South Portugal the average dis-tance between burnt areas is around 7,500 m. Very different results were attained for France where ave-rage distance between burnt areas is around 7,500 m in the South and over 150,000 m in the North.
There is an high inter-annual variability of the fire incidence, with a few extremely high annual BA va-lues which are a consequence of the occurrence of me-ga fires associated to extreme meteorological condi-tions (Pereira et al., 2005; Trigo et al., 2006; Pereira et al., 2011; Amraoui et al., 2013; Trigo et al., 2013). It is also worth noting the apparent oscillation bet-ween the periods of higher fire incidence among the countries of western and eastern Mediterranean as well as the higher average fire size in Greece which moti-vates further research that, however is out of the sco-pe of this study.
In this study we considered a specific combination of first, second and third level CLC classes, that we believe best help to achieve the proposed objectives of identifying and characterizing the LCC most affected by forest fires and with highest fire proneness. Three groups of LCC were considered to embrace the three types of forest and all types of scrubs and Agricultu-ral areas. These three types of vegetation classes
we-Figure 7. Values of the fire proneness index (FPI) for each land cover class and in the four Mediterranean countries. Series for
Por-tugal is plotted in wider column and in primary axis and for the other countries in secondary axis.
60 50 40 30 20 10 0 12 10 8 6 4 2 0 FPI i= BA i/ LCCA i (%)
Artificial Agricultural Bread-leaved Coniferus Mixed forest Natural Scleryfillous Non vegetated
surface areas forest forest grasslands vegetation areas
re def ined for being susceptible for f ire occurrence and are also used in f ire datasets at national level (Pereira et al., 2011).
Differences in land use/land cover structure bet-ween southern and northern Europe may also help to understand why Mediterranean countries are most affected by fires (Fig. 4). In the Southern Europe coun-tries, agriculture, scrubs and forests occupy, respecti-vely, 25%, 3% and 1% more area than the remaining Europe. In addition, the four Southern European coun-tries, have more 7% of Broad-leaved forests but less 5% and 2% of Coniferous and Mixed forests, respectively. For sake of simplicity but without compromising the signif icance of the results, the analysis of the amount of BA in each LCC was performed for the European countries with higher fire incidence. Main results points to a large variability between the wes-tern and easwes-tern Mediterranean countries, especially
in the forests and scrubs which is dominated by the BA in Sclerophyllous vegetation in Portugal (42%), Spain (48%) and France (45%), almost equally distributed between Sclerophyllous vegetation (20%) and natural grasslands (23%) in Italy. This west-east Mediterra-nean spatial trend is also characterized by the increa-se of BA in Agricultural areas.
In Portugal, significant differences between the area of the LCC in 2006 and 2000 were detected in the Ar-tificial surfaces due to high rural abandonment and ur-banization in the last years, Inland waters owing to the construction of the Alqueva hydro basin, which is the largest artificial lake in Europe, and a significant de-crease in the area of forest and Natural grasslands mainly due to fires. The other southern European coun-tries only registered signif icant changes in the Gla-ciers and perpetual snow for Italy and France, most li-kely due to climate change.
25 20 15 10 5 0 2.5 2.0 1.5 1.0 0.5 0.0 2.5 2.0 1.5 1.0 0.5 0.0 2.5 2.0 1.5 1.0 0.5 0.0 10 9 8 7 6 5 4 3 2 1 0 2000 2002 2004 2006 2008 2010 2102 Portugal a) c) b) d) Spain France Italy 2000 2002 2004 2006 2008 2010 2102 2000 2002 2004 2006 2008 2010 2102 2000 2002 2004 2006 2008 2010 2102 FPI (%) FPI (%) FPI (%) FPI (%) Artifical surfaces Broad-leaved forest Mixed forest Sclerophyllous vegetation Agricultural areas Coniferous forest Natural grasslNDS Non vegetation areas
Figure 8. Temporal evolution of FPI of each LCC for (a) Portugal, (b) Spain, (c) France, and (d) Italy. Upper limit of the vertical
A fire proneness index was defined as the ratio bet-ween the area burned by fires in each LCC and the area of the LCC. Obtained results suggest the scrublands and grasslands as the most preferred by fire, followed by forests with intermediate preference while the Agri-cultural areas and Artificial surfaces tend to be avoi-ded. These results are in good agreement with the fin-dings of previous studies (most of them for the same study area), that combine several characteristics of the landscape and fire regime including its frequency, in-tensity, size, season, type and extent (Nunes et al., 2005; Bajocco & Ricotta, 2008; Moreira et al., 2011; Archibald et al., 2013; Oliveira et al., 2013; Barros & Pereira, 2014).
Higher f ire proneness in scrublands and regional variations in fire proneness for land cover have been suggested for Portugal by other authors (Carmo et al., 2011) which also suggest the introduction of fuel breaks in agricultural areas in flat slopes. The greater propensity of scrublands to burn and/or an increase in the f ire frequency are positive feedbacks for f ire occurrence able to promote landscapes covered by fi-re-prone scrublands (Mermoz et al., 2005; Moreira et al., 2011).
The interpretation of the anomalous features of the temporal evolution of the FPI (Figç 8) is as follows. The anomalous value of FPI for the Non vegetated areas in 2000 due to: (i) the CLC2000 comprises the Burnt areas LCC which already accounted for BA pe-rimeters in this year; and (ii) the amplification of this effect, through the normalization of the BA by very small area of this class (< 0.9% of total area in Portu-gal, Spain and France). The greatest value of the FPI in forest LCC in years of higher BA, when the mega fires occurred, suggests that small fires have propen-sity for scrubs LCC while large fires have greater pro-pensity for LCC forest. This result had already been suggested in other studies, in particular for Portugal, based on the 1991 fires (Nunes et al., 2005).
Conclusions
Major differences between northern and southern European countries were found in the land cover and fire incidence as well as among the southern countries (Portugal, Spain, France and Italy) in fire proneness. The land cover conditions, in association with other structural (e.g. climate and socioeconomic activities) and circumstantial (e.g. extreme warm and dry weather
events) characteristics may help to understand why fi-re incidence is much higher in the Mediterranean (83% of total NF and 78% of total BA) than in the northern European countries.
In summary, the major f indings of this study res-pecting the land cover and fire incidence distributions are: (a) the LCC spatial pattern is not uniform but pre-sents differences between the northern (Scandinavian Peninsula, Finland and Iceland) and the remaining Europe; (b) the CLC2000 and CLC2006 do not pre-sent significant differences at continental and regio-nal scales, however significant changes were founded for Portugal in almost all LCC; (c) the southern Euro-pean countries are, by far, the most affected by fires and Portugal presents the worst fire statistics except the averaged fire size which is consistent with the high predominance of small fires in this country.
To achieve the proposed objectives, this study used the most comprehensive and updated versions of the European off icial database of CLC and EFFIS to assess the fire proneness in Europe, for their high spa-tial information content. However, the temporal size of the EFFIS database is only a fraction of some of the national databases. Nevertheless, the results obtained using this database for the f ire incidence in entire Europe are consistent with those obtained for specific European countries and regions.
Most important conclusions from the fire proneness analysis, which accounts for changes in the LCC’s area, comprises: (d) the higher percentage of total BA in scrubs (53%), forests (27%) and agriculture areas (18%); (e) the ability of the proposed fire proneness index (FPI) to effectively assess the propensity to fire of each LCC in each and in all the four southern European countries, by taking into account the LCC’s size and the different LCC structure within the Medi-terranean countries; (f) the identification of the scrubs (principally Sclerophyllous vegetation) as the LCC with the highest f ire proneness, followed by forests with moderate propensity to f ire while Agricultural areas have much smaller FPI; (g) the constancy of this pattern in all the four southern countries; (h) its per-sistence in time except during the occurrence of mega fire events, when the LCC of forest present higher FPI than the LCC of scrub; and, (i) the increased propen-sity of forest LCC for large forest fires.
The most important conclusions pertaining to Mi-xed forests includes: (j) its wide distribution through-out continental Europe that do not disguise the exis-tence of zones of higher density; (k) be the type of
fo-rest that occupies less area but experiencing the major increase from 2000 to 2006, (l) following an opposite trend to that found for the other two forest types; and, (m) being the type of forest with the lowest percenta-ge of BA but with the highest proneness to fire. For these reasons, special attention should be devoted to forest management and fire prevention in this type of forest.
Mediterranean region is the most affected by fires in Europe. Natural conditions like the morphology of the landscape, land cover and weather strongly affect fire activity. The fire regimes, among other factors, de-pend on the land cover/land use type. In this context, knowing the evolution of the LCC most affected by fi-re and its spatiotemporal distribution afi-re essential to characterize the referred fire regime and, consequently, may improve the planning and management of agro-forestry system as well as can support prevention me-asures of fire occurrence and firefighting.
Acknowledgements
Fire data were provided by the European Forest Fi-re Information System-EFFIS (http://eff is.jrc.ec. europa.eu) of the European Commission Joint Re-search Centre while the Corine Land Cover was down-load from the European Environment Agency website (http://forest.jrc.ec.europa.eu/effis/). The authors are especially thankful to João Pereira for the spelling and grammar review of the Manuscript. The networking in this study has been supported by COST Action FP1206 EuMIXFOR. The authors are also grateful to two anonymous reviewers for their suggestions and com-ments that helped make the manuscript much clearer and consistent.
References
Amraoui M, Liberato ML, Calado TJ, DaCamara CC, Coelho LP, Trigo RM et al., 2013. Fire activity over Me-diterranean Europe based on information from Meteo-sat-8. Forest Ecology and Management 294: 62-75. Annoni A, Perdigao V, 1997. Technical and methodological
guide for updating CORINE Land Cover Database. Joint Research Centre, European Commission, Luxembourg. 140 pp.
Anselin L, 1995. Local indicators of spatial association – LISA. Geographical analysis 27: 93-115.
Archibald S, Lehmann CE, Gómez-Dans JL, Bradstock RA, 2013. Defining pyromes and global syndromes of fire
re-gimes. Proceedings of the National Academy of Sciences 110: 6442-6447.
Bajocco S, Ricotta C, 2008. Evidence of selective burning in Sardinia (Italy): which land-cover classes do wildfires prefer? Landscape Ecology 23: 241-248.
Barros AM, Pereira JM, 2014. Wildfire selectivity for land cover type: does size matter? PloS one 9: e84760. Bengtsson J, Nilsson SG, Franc A, Menozzi P, 2000.
Biodi-versity, disturbances, ecosystem function and manage-ment of European forests. Forest Ecology and Manage-ment 132: 39-50.
Benson RP, Roads JO, Weise DR, 2008. Climatic and wea-ther factors affecting fire occurrence and behavior. De-velopments in Environmental Science 8: 37-59.
Bowman DM, O’Brien JA, Goldammer JG, 2013. Pyrogeo-graphy and the global quest for sustainable fire manage-ment. Annual Review of Environment and Resources 38: 57-80.
Büttner G, Feranec J, Jaffrain G, Mari L, Maucha G, Soukup T, 2004. The CORINE land cover 2000 project. EARSeL eProceedings 3: 331-346.
Carmo M, Moreira F, Casimiro P, Vaz P, 2011. Land use and topography influences on wildfire occurrence in northern Portugal. Landscape and Urban Planning 100, 169-176. Cohen J, 1960. A coefficient of agreement for nominal
sca-les. E&c. Psychof. Measuremenf 20 20, 37-46.
Colombaroli D, Marchetto A, Tinner W, 2007. Long-term interactions between Mediterranean climate, vegetation and fire regime at Lago di Massaciuccoli (Tuscany, Italy). Journal of Ecology 95: 755-770.
FAO, 2010. Global Forest Resources Assessment 2010 Main Report. FAO, Rome, Italy. 378 pp.
Feranec J, Jaffrain G, Soukup T, Hazeu G, 2010. Determi-ning changes and flows in European landscapes 1990-2000 using CORINE land cover data. Applied Geography 30: 19-35.
Fischer E, Schär C, 2010. Consistent geographical patterns of changes in high-impact European heatwaves. Nature Geoscience 3: 398-403.
Forest Europe U. FAO, 2011. State of Europe’s forests 2011. Status and trends in sustainable forest management in Europe. In: Ministerial Conference on the Protection of Forests in Europe. pp: 978-982.
Führer E, 2000. Forest functions, ecosystem stability and management. Forest Ecology and Management 132: 29-38.
Ichoku C, Giglio L, Wooster MJ, Remer LA, 2008. Global characterization of biomass-burning patterns using sate-llite measurements of fire radiative energy. Remote Sen-sing of Environment 112: 2950-2962.
Krawchuk MA, Moritz MA, Parisien M-A, Van Dorn J, Hayhoe K, 2009. Global pyrogeography: the current and future distribution of wildfire. PloS one 4: e5102. Lavorel S, Flannigan MD, Lambin EF, Scholes MC, 2007.
Vulnerability of land systems to fire: interactions among humans, climate, the atmosphere, and ecosystems. Miti-gation and Adaptation Strategies for Global Change 12: 33-53.
Lindner M, Maroschek M, Netherer S, Kremer A, Barbati A, Garcia-Gonzalo J et al., 2010. Climate change impacts, adaptive capacity, and vulnerability of European forest eco-systems. Forest Ecology and Management 259: 698-709. Mermoz M, Kitzberger T, Veblen TT, 2005. Landscape
in-fluences on occurrence and spread of wildfires in Pata-gonian forests and shrublands. Ecology 86: 2705-2715. Moreira F, Viedma O, Arianoutsou M, Curt T, Koutsias N,
Rigolot E et al., 2011. Landscape-wildfire interactions in southern Europe: implications for landscape management. Journal of Environmental Management 92: 2389-2402. Moreno JM, Viedma O, Zavala G, Luna B, 2011.
Landsca-pe variables influencing forest fires in central Spain. In-ternational Journal of Wildland Fire 20: 678-689. Nunes MC, Vasconcelos MJ, Pereira JM, Dasgupta N,
Alldredge RJ, Rego FC, 2005. Land cover type and fire in Portugal: do fires burn land cover selectively? Land-scape Ecology 20: 661-673.
Oliveira S, Moreira F, Boca R, San-Miguel-Ayanz J, Pereira JM, 2013. Assessment of fire selectivity in relation to land cover and topography: a comparison between southern European countries. International Journal of Wildland Fi-re 23: 620-630.
Peel MC, Finlayson BL, McMahon TA, 2007. Updated world map of the Köppen-Geiger climate classification. Hydro-logy and earth system sciences discussions 4: 439-473. Pereira JMC, Carreiras JMB, Silva JMN, Vasconcelos MJ,
2006. Alguns conceitos básicos sobre os fogos rurais em Portugal. Incêndios Florestais em Portugal: Caracteriza-ção, Impactes e Prevenção. pp: 133-161.
Pereira M, Malamud B, Trigo R, Alves P, 2011. The history and characteristics of the 1980-2005 Portuguese rural fi-re database. Natural Hazards & Earth System Sciences 11: 3343-3358.
Pereira MG, Calado TJ, DaCamara CC, Calheiros T, 2013. Effects of regional climate change on rural fires in Por-tugal. Climate research 57: 187-200.
Pereira MG, Trigo RM, Da Camara CC, Pereira J, Leite SM, 2005. Synoptic patterns associated with large summer fo-rest fires in Portugal. Agricultural and Fofo-rest Meteoro-logy 129: 11-25.
Pezzatti G, Bajocco S, Torriani D, Conedera M, 2009. Se-lective burning of forest vegetation in Canton Ticino (sou-thern Switzerland). Plant biosystems 143: 609-620. Pyne S, 2006. Fogo no jardim: compreensão do contexto dos
incêndios em Portugal. In: Incêndios Florestais em Por-tugal – Caracterização, Impactes e Prevenção. Instituto Superior de Agronomia, Lisboa. pp: 115-131.
Qin D, Manning M, Chen Z, Marquis M, Averyt K, Tignor M et al., 2007. Climate change 2007: the physical
scien-ce basis. Cambridge University Press, Cambridge, UK, New York, NY, USA. 996 pp.
Rasilla DF, García-Codron JC, Carracedo V, Diego C, 2010. Circulation patterns, wildfire risk and wildfire occurren-ce at continental Spain. Physics and Chemistry of the Earth, Parts A/B/C 35: 553-560.
Salvati L, Ferrara A, 2014. Do land cover changes shape sen-sitivity to forest fires in peri-urban areas? Urban Forestry & Urban Greening 13: 571-575.
Scarascia-Mugnozza G, Matteucci G, 2012. Mediterra-nean forest research: challenges and opportunities in a changing environment. Agenzia nazionale per le nueve tecnologie, l’energia e lo sviluppo economico sostenibi-le 1: 58-65.
Schelhaas MJ, Nabuurs GJ, Schuck A, 2003. Natural
distur-bances in the European forests in the 19thand 20th
centu-ries. Global Change Biology 9: 1620-1633.
Schmuck G, San-Miguel-Ayanz J, Camia A, Durrant T, Santos de Oliveira S, Boca R et al., 2011. Forest fires in Europe 2010. [online]. Joint Research Centre Annual Fi-re Reports. Available in http://foFi-rest.jrc.ec.europa.eu/ media/cms_page_media/9/forest-fires-in-europe-2010.pdf. [14 October 2011].
Slee B, 2005. Socio-economic values of natural forests. Fo-rest Snow and Landscape Research 79: 157-167. Solomon S, Qin D, Manning M, Chen Z, Marquis M, Averyt
K et al., 2007. Climate Change 2007: The Physical Scien-ce Basis. Contribution of Working Group I to the Fourth Assessment Report of the Intergovernmental Panel on Cli-mate Change. Cambridge University Press, Cambridge, United Kingdom and New York, NY, USA. 996 pp. Stathopoulou M, Cartalis C, 2007. Daytime urban heat
is-lands from Landsat ETM+ and Corine land cover data: an application to major cities in Greece. Solar Energy 81: 358-368.
Trigo RM, Pereira J, Pereira MG, Mota B, Calado TJ, Dacamara CC et al., 2006. Atmospheric conditions asso-ciated with the exceptional fire season of 2003 in Portu-gal. International Journal of Climatology 26: 1741-1757. Trigo RM, Sousa PM, Pereira MG, Rasilla D, Gouveia CM, 2013. Modelling wildfire activity in Iberia with different atmospheric circulation weather types. International Jour-nal of Climatology.
Ventura J, Vasconcelos M, 2006. O fogo como processo fí-sico-químico e ecológico. In: Incêndios Florestais em Por-tugal – Caracterização, Impactes e Prevenção. Instituto Superior de Agronomia, Lisboa. pp: 93-113.
Viegas D, Viegas M, Ferreira A, 1992. Moisture content of fine forest fuels and fire occurrence in central Portugal. International Journal of Wildland Fire 2: 69-86.