Price Transmission on the Milk Portuguese Market
1Maria de Fátima Lorena de Oliveira1
, Maria Leonor da Silva Carvalho2,
Maria Raquel Lucas3, Pedro Damião Henriques4, Fernanda Mora Peixe5
1 Instituto Politécnico de Coimbra, Escola Superior Agrária de Coimbra, Bencanta, Cernas, 3045-601 Coimbra, foliveira@esac.pt, 3045-601 Coimbra, Portugal, foliveira@esac.pt. 2 ICAAM, Departamento de Economia, Universidade de Évora, Largo dos Colegiais 2,
7004-516 Évora, Portugal, leonor@uevora.pt.
3 CEFAGE, Departamento de Gestão, Universidade de Évora, Largo dos Colegiais 2, 7004-516 Évora, Portugal, mrlucas@uevora.pt.
4 CEFAGE, Departamento de Economia, Universidade de Évora, Largo dos Colegiais 2, 7004-516 Évora, Portugal, pdamiao@uevora.pt.
5 Departamento de Economia, Universidade de Évora, Largo dos Colegiais 2, 7004-516 Évora, Portugal, fmp@uevora.pt.
Abstract
This paper aims to analyze the milk prices transmission along the food chain in Por-tugal, temporally and spatially. The results show that the volatility on retail prices is small but happens after 2008. The farm gate price does not change when the price of package milk changes. In mainland, price transmission does not happen but for Azores the transmission is effective. In the intensive systems, the risk to collapse is bigger than in the extensive systems, where the volatility of prices reflects the process of markets adjustment.
Key Words: dairy, farm-gate milk, prices, cointegration, feed prices; Portugal.
Introduction
The reform of the Common Agricultural Policy has to respond to several challenges in general agricultural terms (climate change and European Union enlargement) and specifically in the dairy sector for developing more innovative and more market-oriented business models, ensuring high quality on milk supplied and sustainability of production, at right prices. A considerable volume of research and studies have recently been carried out on the assessment of price transmission, but most research is concen-trated on various product markets in the United States (Fackler and Goodwin, 2001) and a few studies are focused in European markets (Meyer and Cramon-Taubadel, 2004; Serra et al. 2006; Ben-Kaabia and Gil, 2008). Some authors focus their work in devel-oping countries (Rapsomanikis et al., 2003). In the EU, food supply chain research shows that imperfect and asymmetric price transmission is linked to market imperfec-tions, concentration and agent's pricing policies (COM, 2009). Most empirical studies
1 This work is funded by FEDER Funds through the Operational Programme for Competitiveness
Fac-tors -COMPETE and National Funds through FCT -Foundation for Science and Technology under the Strategic Project PEst-C/AGR/UI0115/2011
find little evidence of systematic imperfect price adjustments along the EU food chain, although this may happen in the short run in some specific sector/country situation. The studies of vertical and spatial price transmission have been used to infer a number of conclusions regarding the behavior of market linkages across different levels of the marketing chain. Some significant criticisms have been directed toward this line of study, because it assumes that the tests on price transmission are conducted without re-gard to the overall institutional and structural characteristics of the market. Goodwin (2006) concluded that cautions must apply to the methods and results. The first paper, specifically focused on dairy product prices, was presented by Kinnucan and Forker (1987). Stewart and Blayney (2011) have recovered the debate on asymmetric price transmission by the using the (threshold) error correction models on milk and cheese. Meanwhile, several studies have been focused on milk, cheese and dairy products, namely Serra and Goodwin (2003); Chavas and Mehta (2004); Jensen and Moller (2007); and Baumgartner et al. (2009). Serra and Goodwin, (2003) found positive asymmetries for the Spanish dairy market, Chavas and Mehta (2004) found that retail prices respond more strongly to wholesale price increases than to wholesale price de-creases; their explanations are consumer search costs, retailers’ menu costs and also imperfect competition at the retail level. Jensen and Moller (2007) detected weak price transmission, especially for milk. In their view, asymmetric price adjustment is caused by public intervention and product differences. More value added products show a higher degree of asymmetry. The European Union analyzes a range of different milk products for a variety of EU Member States. Instead of an error correction approach, a model in first differences was used to detect asymmetric price responses. In particular for Slovenia, United Kingdom, Denmark and Lithuania significant asymmetries are found. The Commission relates the positive asymmetries to the limited share of agricul-tural commodities into final food prices, inefficiencies in the market structure of the chain (either linked to imbalances in bargaining power and/or anti-competitive practic-es), and some adjustments constraints and costs (e.g. costs of changing prices for both producers and retailers, the slow price transmission due to long-term contracts between economic actors) (EC, 2009). Baumgartner et al. (2009) detected positive asymmetries for milk and butter. Stewart and Blayney (2011) studied price transmission over the food crisis from 2007 to 2009 in the United States of America (USA). They analyzed the nature of price transmission for whole milk and cheddar cheese, comparing results of different model specifications. Independent from underlying specification, they found positive asymmetries. Additionally, Stewart and Blayney (2011) stated for the lower processed product (whole milk) that the price pass-through is larger and that the process of error correction was active in the whole spectrum of observed disequilibria. In con-trast, the higher processed product (cheddar cheese) showed a band of no error correc-tion. More recently, Holm et al (2012) analyzed weekly basis variations in vertical price adjustment (cost pass through) between retail and whole sale prices for differentiated milk and butter products (brands) for different (individual) retail outlets in the German market from 2005 to 2008. The results indicated significant asymmetric price adjust-ments. In dairy sector, the EU average prices continue to be largely above intervention levels and according with Quarterly report on dairy market (EC, 15/03/2011) the farm gate milk is higher than others market as United States of America (USA) and New Zealand (332 euros/tons in EU 27 against 311 and 261 euro/tons in New Zealand and
USA, respectively). The EU dairy policy has helped to maintain producer price at a higher and more stable level than in an unregulated market. The Portuguese farm gate prices were above the EU average prices until 2005 but in the last years the Portuguese price of cow milk declined and in consequence became more competitive. This fact is important for the development of international trade among neighbor’s countries. Thus, the empirical evidence for statistically significant positive price asymmetries in the dairy sector is overwhelming. However, despite the authors refer the importance of this asymmetric price, the aim of this work is to describe the food chain for dairy products in Portugal and to analyze the variation of prices along the food chain, temporally and spa-tially, and not to applying the econometric analysis to the study. To integrate the asym-metric prices analysis, would require more studies to be carried out, implying the analy-sis of structures of dairy farms and their structural flexibility, being or not associated with the ownership of the property and of the financing capacity, as well as an analysis of the concentration of dairy industry. This concentration will influence the market power and therefore the reaction capacity of the value chain.
This paper aims to analyze the variation of milk prices along the food chain in Portu-gal, temporally and spatially. The analysis will be carried out with feed prices, farm gate milk prices and with the index prices of package milk out of factory.
Methodology
Price variation analysis enables identifying several trends in price transmission mechanisms along the chain and help to understand the result of the cointegration tests.
Commodity price series have a number of common characteristics with important implications in statistical analysis. For instance, usually individual product price series contain stochastic trends and are non-stationary; moreover, tend to move together, which means that they may be cointegrated, and price series of interrelated markets are likely to contain the same stochastic trends, being the linear combination of the prices stationary. Standard unit root and cointegration tests can be made to determine whether price series are stationary and whether they are cointegrated, respectively.
Accordingly, price transmission can be studied using econometric models. The mag-nitude of price changes enables to identify trends in price transmission mechanisms along the chain.
The theory of cointegration developed by Engle and Granger (1987: 251) is charac-terized by the main idea that “equilibrium relationship is a stationary point characcharac-terized by forces which tend to push the economy back toward equilibrium whenever it moves away”. The stationary linear combination is called the cointegrating equation and may be interpreted as a long-run equilibrium relationship among the variables. Under these conditions the series are cointegrated, what is the statistical equivalent of the existence of a long-run economic relationship between the I(1) variables. If one of these variables is I(1) and the other I(0), then the linear combination of them given by the disequilibri-um error could not be stationary (Thomas, 1997).
To test cointegration we can apply two methods: the first one is the Engle-Granger´s two steps based on OLS. With this method, we estimate the long-run relationships and save regression residuals, being the second step testing whether the residuals are sta-tionary or not. A second and more powerful test is the method introduced by Johansen
(1995). This test is based on Maximum Likelihood Estimation (MLE) and in two statis-tics: maximum eigenvalues and a trace-statistics. As in Engle and Granger´s method, it is a good practice to pretest all variables to assess their order of integration (Enders, 2010). Both Engle-Granger and Johansen procedures are consistent for investigating bilateral cointegrating relations, which are our purpose. However, because it is condicional to short-run dynamics, Johansen’s procedure may have efficiency gains, and also facilitates the inference on the cointegrating vectors using the standard distribu-tions, which leads to our choice of this methodology.
The Johansen test is only valid when we are working with series that are known to be non-stationary and the results are sensitive to the length of the lag. The software we will apply (STATA 10) implements Johansen’s “trace” statistic and “maximum eigenvalue” statistic for determining the number of cointegration equations “r” in a VECM (Vector Error-Correction Model). The number of lags is chosen previously using the following criteria: Akaike information criterion (AIC), Schwarz Bayesian information criterion (SBIC), Hannan and Quinn information criterion (HQIC), finite prediction error (FPE) and sequential likelihood-ratio (LR).
To determine the number of cointegration relations “r”, we proceed sequentially from r=0 to r=k-1, and the null hypothesis is rejected if the trace statistic is greater than the critical value. We start by testing H0: r = 0, and if the null hypothesis is re-jected, the process is repeated for H0: r = 1. When the null hypothesis is not rere-jected, we stop testing there, and we find the number of cointegrating relations (there are one or more cointegration vectors).
To test the unit-root hypothesis we employ the augmented Dickey-Fuller (ADF), the DF-GLS and the Phillips-Perron unit-root tests. The lags chosen have an important role on the test performance (Enders, 2010: 216). To select the correct number of lags we use the lags that minimize the value of the AIC and that minimize the SBIC. For the test we use the prices series at nominal values on logarithmic form, althought the prices se-ries do not have to be expressed in logarithmic form. but in this structure the parameters can be interpreted as elasticity’s (Thomas, 1997: 385). In first place, we perform an analysis of the price movement in each point of the milk chain.
To test cointegration we must specify how many lags to include. The Johansen ap-proach can be quite sensitive to the lag length. The most regular procedure is to estimate a Vector of Auto Regression (VAR) using the “undifferenced” data (Enders, 2010; Lutkepohl and Kratzug, 2009). We use the software STATA through the pre-estimation syntax “varsoc” in order to select the lag order for VAR model that minimizes the ma-jority of AIC, SBIC, HQIC,FPE and LR criteria.
Data Analysis
The objective of this study is focused on investigate the mechanism of price transmis-sion throughout the marketing chain in the milk sector. The price transmistransmis-sion will be studied between farm gate milk prices and feed prices as well as between farm gate milk prices and milk package prices. It is also possible to observe the transmission price from the producer to the consumer. The data for the feed prices are from INE and the data for the milk prices are from SIMA (Gabinete de Planeamento e Políticas do Ministério da Agricultura, Desenvolvimento Rural e Pescas). Prices and index prices are monthly
25 27 29 31 33 35 37 39 41 43 1 -1 -01 1 -5 -01 1 -9 -01 1 -1 -02 1 -5 -02 1 -9 -02 1 -1 -03 1 -5 -03 1 -9 -03 1 -1 -04 1 -5 -04 1 -9 -04 1 -1 -05 1 -5 -05 1 -9 -05 1 -1 -06 1 -5 -06 1 -9 -06 1 -1 -07 1 -5 -07 1 -9 -07 1 -1 -08 1 -5 -08 1 -9 -08 1 -1 -09 1 -5 -09 1 -9 -09 1 -1 -10 1 -5 -10 1 -9 -10 1 -1 -11 1 -5 -11 E u ros /100 k g
Price feed for Dairy cow (Nominal Price) Price feed for Dairy cow (Real Price) Linear (Price feed for Dairy cow (Real Price))
Source: Data from SIMA
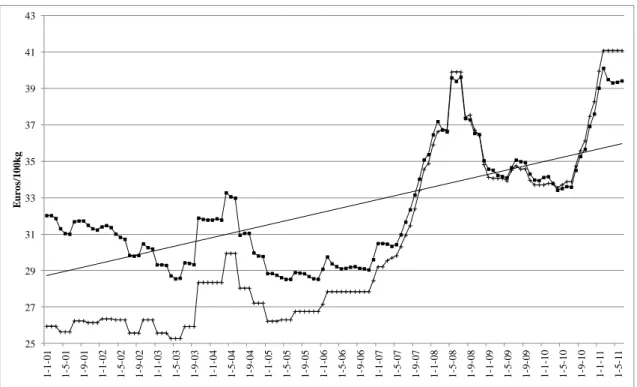
Figure 1. Feed price of dairy cows at nominal and real values
100 105 110 115 120 125 130 135 0,20 0,25 0,30 0,35 0,40 0,45 1 -1 -01 1 -5 -01 1 -9 -01 1 -1 -02 1 -5 -02 1 -9 -02 1 -1 -03 1 -5 -03 1 -9 -03 1 -1 -04 1 -5 -04 1 -9 -04 1 -1 -05 1 -5 -05 1 -9 -05 1 -1 -06 1 -5 -06 1 -9 -06 1 -1 -07 1 -5 -07 1 -9 -07 1 -1 -08 1 -5 -08 1 -9 -08 1 -1 -09 1 -5 -09 1 -9 -09 1 -1 -10 1 -5 -10 1 -9 -10 1 -1 -11 1 -5 -11 In d e x p ri c e o f p a c k . m il k o u t fa c to ry P R IC E S ( E U R O /K G )
Individual Prod. Milk Producer Azores Feed Prices Index Whole Milk Pack. (UHT)
Source: Data from SIMA
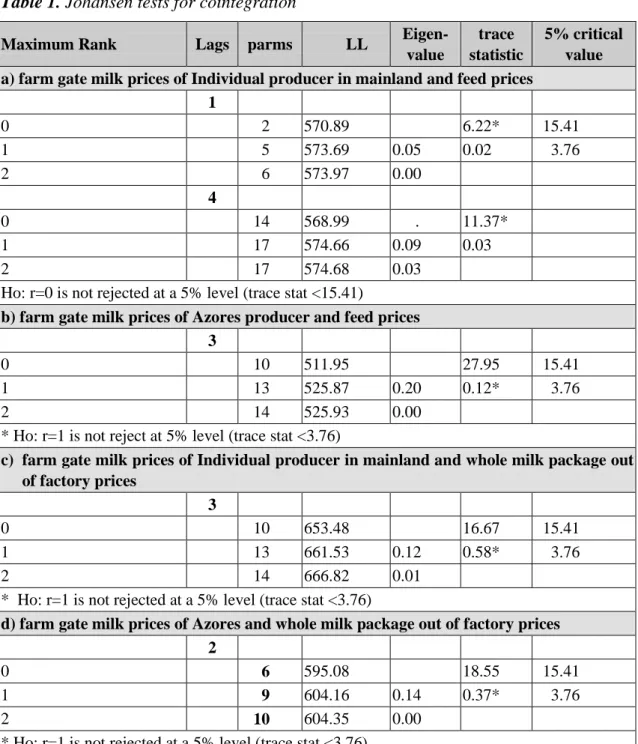
from January 2001 to July 2011. For feed prices we observe an increase after 2007 with a peak in the middle of 2008, as shown in Figure 1. The evolution of the milk farm pric-es shows a peak in the same period for the feed pricpric-es (figure 2). From then on, there is a decline of the milk farm prices. The producer milk prices decline until the period of 2008, coinciding with the peak observed in the prices of feeding stuffs for dairy cattle. While feed prices exhibit a decrease followed by an increase, the same does not happen with milk prices in the production where the declining trend remains.
The trend for the feed prices is positive but the trend for the milk prices is negative. In a first remark, we can think that there is not a relation between the feed and milk prices, and only after the cointegration process we can conclude about the relation be-tween prices. Once the weight of milking parlors is very small in milk production, the analysis will be performed between milk prices on individual producers and Azores producers and feed prices for dairy cows.
Results
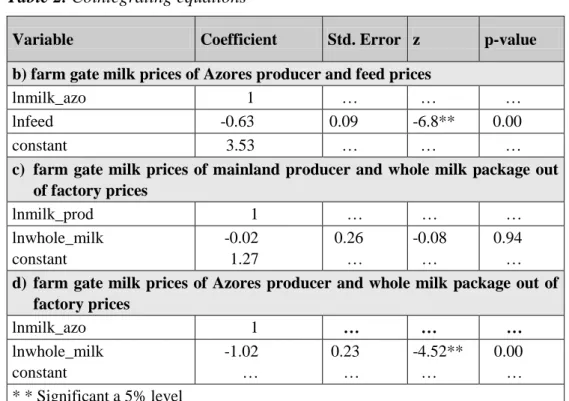
The first step is to test the presence of unit roots in the series that we will use: feed prices; farm gate milk and indices of prices of milk whole package output of factory (UHT). The results show that, using all prices series in logarithmic form, we cannot reject the null hypothesis that all prices series exhibits a unit roots that is integrated of order one I (1). The next step is to determine the lag order for a VAR model. For farm gate milk prices and feed prices we use one lag in the VAR because that choice mini-mizes HQIC and SBIC. The tests for cointegration are based on Johansen’s model and the results show that the Ho for r=0 is not rejected at a 5% level (see Table 1a). In other words, this trace test result does not reject the null hypothesis and therefore there is no cointegration. We also use a lag order of 4, which minimizes two other criteria (FPE and AIC), but still with no cointegration was found. The feed and farm gate milk prices, both seem to meander without any tendency to come together, there is not an equilibri-um relationship between the two variables.
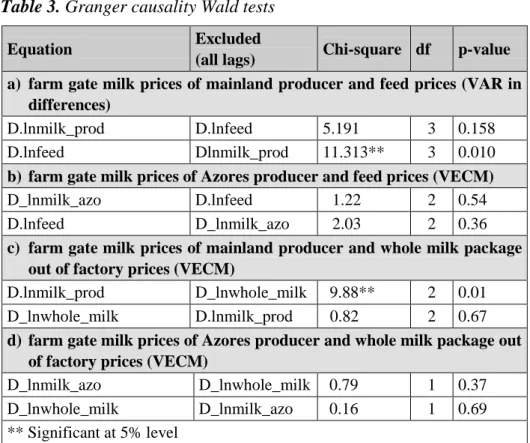
Since no VECM applies here, we proceed to estimate a VAR in differences of order 3 (assuming order 4 for the levels) and used it to test for Granger causality. The results are shown in Table 2. From Table 2a we can conclude that the growth rate of milk pric-es Granger causpric-es the growth rate of feed pricpric-es, and the reverse is not true. This is not the direction we would expect in causality. However, we note that Granger causality is only about the past of one variable helping forecasting the present value of another vari-able, and is not economic causality.
We apply the same methodology for farm gate milk prices in Azores.
The results from Table 1b) showed that for the farm gate milk prices in Azores and feed prices, we cannot reject the null hypothesis that there is a cointegration equation in the bivariate model,. For milk producers in Azores, there is long-run equilibrium be-tween feed and milk prices. This result is a very interesting one, mainly because in Azores the housing systems are almost non-existent, and the exploitation performs ex-tensive systems. The normalized cointegrating vector is displayed in Table 3b), from which we find an estimated long run elasticity of feed prices of 0.63%.
Table 1. Johansen tests for cointegration
Maximum Rank Lags parms LL Eigen-value
trace statistic
5% critical value a) farm gate milk prices of Individual producer in mainland and feed prices
1 0 2 570.89 6.22* 15.41 1 5 573.69 0.05 0.02 3.76 2 6 573.97 0.00 4 0 14 568.99 . 11.37* 1 17 574.66 0.09 0.03 2 17 574.68 0.03
Ho: r=0 is not rejected at a 5% level (trace stat <15.41)
b) farm gate milk prices of Azores producer and feed prices 3
0 10 511.95 27.95 15.41
1 13 525.87 0.20 0.12* 3.76
2 14 525.93 0.00
* Ho: r=1 is not reject at 5% level (trace stat <3.76)
c) farm gate milk prices of Individual producer in mainland and whole milk package out of factory prices
3
0 10 653.48 16.67 15.41
1 13 661.53 0.12 0.58* 3.76
2 14 666.82 0.01
* Ho: r=1 is not rejected at a 5% level (trace stat <3.76)
d) farm gate milk prices of Azores and whole milk package out of factory prices 2
0 6 595.08 18.55 15.41
1 9 604.16 0.14 0.37* 3.76
2 10 604.35 0.00
* Ho: r=1 is not rejected at a 5% level (trace stat <3.76)
equation of Azores milk price (with coefficient -0.31), but not in the feed prices equa-tion. From Table 2b) we do not find evidence of Granger causality in either direcequa-tion.
The figure 2 illustrates the evolution of the index price of whole milk in package out of factory, showing a break on 2007, that is consistent with the increased on feed and farm gate milk prices, however the prices did not decrease as happened with the farm gate milk prices. Figure 2 shows that for a long period the indices of price remain sta-ble, but suddenly the price out factory increased illustrating the differences in market situation along the dairy supply chain. However the farm gate price dropped and the milk price out of factory did not respond at same level.
Table 2. Cointegrating equations
Variable Coefficient Std. Error z p-value b) farm gate milk prices of Azores producer and feed prices
lnmilk_azo 1 … … …
lnfeed -0.63 0.09 -6.8** 0.00
constant 3.53 … … …
c) farm gate milk prices of mainland producer and whole milk package out of factory prices lnmilk_prod 1 … … … lnwhole_milk constant -0.02 1.27 0.26 … -0.08 … 0.94 …
d) farm gate milk prices of Azores producer and whole milk package out of factory prices lnmilk_azo 1 … … … lnwhole_milk constant -1.02 … 0.23 … -4.52** … 0.00 … * * Significant a 5% level
The index price for whole milk package (UHT) has a unit root, and we proceed to test whether it is cointegrated with farm gate milk prices in the mainland. Three out of our five criteria choose a lag order of 3 for the VAR model. The results (Table 1c) sup-port one cointegration relationship, displayed at Table 3c). The estimated long run elas-ticity of whole milk price is, however, very low (0.02%), and not statistically significant by the asymptotic normal significance test (z). Thus the evidence of long run relation-ship is not strong for these variables. We also use the VECM to test for Granger causali-ty, finding (Table 2c) that the growth rate of whole milk price Granger causes the growth rate of farm gate milk prices, and reverse is not true, which again is somehow counterintuitive.
Finally we test for cointegration between the producer milk prices of Azores and the whole milk package out of factory prices The results find one cointegration equation (Table 1, d).
Thus, the results show that there is no relation between the farm gate milk prices and the prices of package whole milk output of factory on mainland, but, for milk produced in Azores, the farm gate prices and the price of whole milk are cointegrated “their time paths are influenced by the extent of any deviation from long-run term equilibrium” (Enders, 2010, pp. 365). The cointegrating vector is shown in Table 3d). This reveals a near unit long run elasticity of whole milk prices regarding farm gate prices in Azores. The corresponding VECM was estimated, and Granger causality tests performed (Table 2d), but no evidence of that was found in either direction.
It is hard to identify the cause of the change in price transmission of milk prices along the milk chain, however Figure 2 shows the change in price transmission pattern occurring from 2007 to 2008. It may relate to the intensity of agricultural commodity price increase that has forced food producer to translate his increase in costs to price
Table 3. Granger causality Wald tests
Equation Excluded
(all lags) Chi-square df p-value a) farm gate milk prices of mainland producer and feed prices (VAR in
differences)
D.lnmilk_prod D.lnfeed 5.191 3 0.158
D.lnfeed Dlnmilk_prod 11.313** 3 0.010
b) farm gate milk prices of Azores producer and feed prices (VECM)
D_lnmilk_azo D.lnfeed 1.22 2 0.54
D.lnfeed D_lnmilk_azo 2.03 2 0.36
c) farm gate milk prices of mainland producer and whole milk package out of factory prices (VECM)
D.lnmilk_prod D_lnwhole_milk 9.88** 2 0.01
D_lnwhole_milk D.lnmilk_prod 0.82 2 0.67
d) farm gate milk prices of Azores producer and whole milk package out of factory prices (VECM)
D_lnmilk_azo D_lnwhole_milk 0.79 1 0.37
D_lnwhole_milk D_lnmilk_azo 0.16 1 0.69
** Significant at 5% level
increases. Statistical indicator for trade shows that high farm gate prices are followed by higher milk importation values.
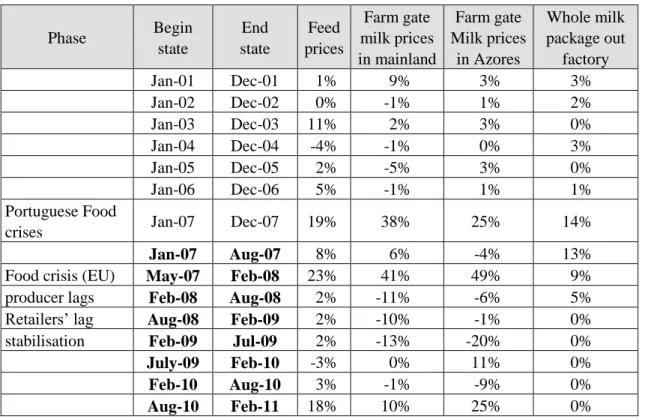
Recent price evolution in food supply chain in EU, COM (2009) identifies four main phases since May 2007. We apply the same type of analysis in Table 4, but in Portugal the increases of feed prices began earlier than in EU, that is in January 2007. Feed pric-es sharply increase by 19% in 12 months, consequently farm gate milk pricpric-es in main-land and in Azores increase by respectively 38% and 25%.The whole milk package out of factory index price increases 14%.
In the next period (January 2007–August 2007), feed prices increase continue as well as the farm gate milk prices in mainland and the prices of whole milk package. In food prices crisis on EU (May 2007–February 2008), the feed prices sharply increased 23% (in EU the increasing of agricultural commodity was of 16% “COM, 2009”). The farm gate milk prices grew at a high rate (41% and 49%) and index of price packed milk creased even at lower rate (9%). In the period February to August 2008, feed prices in-creased slowly but the farm gate prices started declining while the whole milk package prices are still raising. On retailers’ lags, the feed prices begin to decline as well the farm gate price. The prices of milk on consumer appear to stabilize in February 2009-July 2009. In this period, prices of feed and of whole milk package stabilized but the farm gate price continues declining. In February, feed prices sharply increased as well the farm gate prices but the whole milk package price remained unchanged.
Price variation analysis enables identifying several trends in price transmission mechanisms along the chain and help to understand the result of the cointegration tests. The analysis of price variations since 2007, in table 4, enables to identify several trends in price transmission mechanisms along the chain. In January, when the portuguese
Table 4. Magnitude of price variation (nominal prices) Phase Begin state End state Feed prices Farm gate milk prices in mainland Farm gate Milk prices in Azores Whole milk package out factory Jan-01 Dec-01 1% 9% 3% 3% Jan-02 Dec-02 0% -1% 1% 2% Jan-03 Dec-03 11% 2% 3% 0% Jan-04 Dec-04 -4% -1% 0% 3% Jan-05 Dec-05 2% -5% 3% 0% Jan-06 Dec-06 5% -1% 1% 1% Portuguese Food
crises Jan-07 Dec-07 19% 38% 25% 14%
Jan-07 Aug-07 8% 6% -4% 13%
Food crisis (EU) May-07 Feb-08 23% 41% 49% 9%
producer lags Feb-08 Aug-08 2% -11% -6% 5%
Retailers’ lag Aug-08 Feb-09 2% -10% -1% 0%
stabilisation Feb-09 Jul-09 2% -13% -20% 0%
July-09 Feb-10 -3% 0% 11% 0%
Feb-10 Aug-10 3% -1% -9% 0%
Aug-10 Feb-11 18% 10% 25% 0%
food crises begins, the variations in consumer prices appear to be of a lesser magnitude than variations of feed prices and variations of milk farm prices. The index prices of whole milk package out of factory present signs of stickiness having only very margin-ally decreased whereas all prices upwards in the chain have significant decline.
Conclusion
Farmers’ perceptions of the milk market situation appear to differ and the feeling is a gap between the price paid for milk and the costs of producing The results showed that the increased on feed costs is not followed, in the long run, by an increase on farm gate price, in mainland, but in Azores, where the prevalent systems are extensive systems, the long term relation between feed costs and milk prices exists. In intensive systems, the producer of cow milk is very dependent on feed costs but stability on farm gate milk price put in risk the income of dairy producer and the policy systems does not provide protection against the increased of feed price. Some dairy stakeholders claim that the farm gate price did not change because milk on retail did not change. The results show that the volatility on retail prices is small, but after 2008 the prices outside industry show a real increase. Beside that evolution, the farm gate price does not change when the price of package milk out factory did change. The evidence of long run price trans-mission from retail to farm price in mainland is weak. But, as for Azores is concerned, the transmission of retail prices and farm prices is effective and proportional, as the unit long run elasticity indicates. Going back further, there were a few periods where the retail milk price did not change as much as farm milk costs, but there were also periods when the retail milk price changed more than did farm milk costs to fluid milk
proces-sors. There may be a number of reasons for this, ranging from changes in costs in the processing, distributing and retailing channels to changing marketing strategies by re-tailers. However, over time the published data clearly show that changes in the retail price of milk do not tend to track with changes in the cost of farm milk. In the intensive systems, the risk to collapse of the system is bigger than in the extensive systems where the volatility of prices reflects the process of market adjustments to changes in supply and demand conditions. As a consequence, Portuguese raw milk can be replaced by cheaper alternatives. Portugal is one of the Member States more affected by the “Soft landing” policy (increasing raw milk production quotas by 1% a year until 2015). It is expected to be subject to more imports from more competitive countries as this increase their production capacity. The dairy sector was not defined as strategic in the Rural De-velopment Program (PRODER) that runs from 2007 to 2013 and therefore support for investment in the sector was not considered a priority. Without the guarantee of funds for structural reform, farmers can only aim at improving their management skills to lower costs and gaining competitiveness. More small farmers are expected to leave the dairy production system. The slow or even the lack of transmission of price increases for dairy commodities from farm gate prices to milk highlights the importance of im-plementing policies to strengthen the functioning of the dairy supply chain.
References
Baumgartner J, Crespo-Cuaresma J and Fernandez-Amador O(2009) Milking the Prices: The Role of Asymmetries in the Price Transmission Mechanism for Milk Products in Austria. WIFO Working Papers: 1–18.
Ben-Kaabia M and Gil J (2008) Asymmetric Price Transmission in the Spanish Lamb Sector. European Review of Agricultural Economics, 34 (1): 53-80.
Chavas J. P and Mehta A (2004) Price Dynamics in a vertical Sector: The Case of Butter. Amer-ican Journal of Agricultural Economics 86 (4): 1078–1093.
COM (2009) Analysis of price transmission along the food supply chain in the EU. Commission of the European Communities 28.10.2009.
Enders W (2010) Applied Econometric Time Series, Wiley: University of Alabama, 3nd Edition. Engle R and Granger C(1987) Co-integration and Error Correction: Representation, Estimation,
and Testing. Econometrica, Vol. 55 (2): 251-276.
European Commission (EC) (2009) Analysis of price transmission along the food supply chain in the EU. Available at: http://ec.europa.eu/economy_finance/articles/structural_reforms/ ar-ticle16028_en.htm
European Commission (EC) (2010) Prospects for Agricultural Markets and Income in the EU 2010-2020. Directorate-General for Agriculture and Rural Development, Brussels, Dec. 2010.
European Commission (EC) (2011) Quarterly report on dairy market. Agricultural Council, Brussels, 15 March 2011
Fackler P.L and Goodwin B (2001) Spatial Price Analysis. In: B. Gardner and G. Rausser (eds), Handbook of Agricultural Economics, Vol. 1, Elsevier, 971-1024.
Goodwin B (2006) Spatial and Vertical Price Transmission Meat Markets. Paper presented at the Market Integration and Vertical and Spatial Price Transmission in Agricultural Markets Workshop, University of Kentucky, April.
Holm T, Loy J-P and Steinhagen C (2012), Vertical price transmission in differentiated product markets. a disaggregated study for milk and butter. Paper presented at the Agricultural & Applied Economics Association’s 2012 AAEA, Seattle, Washington, August: 12-14.
Jensen J and Moller A (2007) Vertical Price Transmission in the Danish food marketing chain. Institute of Food and Resource Economics, Working Paper. Copenhagen.
Johansen S (1995) Likehihood-Based Inference in Cointegrated Vector Autoregressive Models, Oxford University Press
Kinnucan H. W and Forker O. D (1987) Asymmetry in Farm-Retail Price Transmission for Ma-jor Dairy Products. American Journal of Agricultural Economics Vol. 69 (2): 285–292. Lutkepohl H and Kratzug M (2009) Themes in modern econometrics: applied times series
econometrics: Cambridge University press.
Meyer J and,Cramon-Taubadel S (2004) Asymmetric Price Transmission: A Survey. Journal of Agricultural Economics, Vol: 55 (3): 581-611.
Rapsomanikis, G, Hallam D and Conforti P (2003) Market Integration and Price Transmission in Selected Food and Cash Crop Markets of Developing Countries: Review and Applica-tions. In: FAO (ed), Commodity Market Review 2003-2004, Commodities and Trade Divi-sion of Food and Agriculture. ONU, Italy: 52-75
Serra T, and Goodwin B (2003) Price transmission and asymmetric adjustment in the Spanish dairy sector. Applied Economics Vol. 35 (18): 1889–1899.
Serra T, Gil J and Goodwin B (2006) Local polynomial fitting and spatial price relationship: price transmission in EU pork markets. European Review of Agricultural Economics, Vol. 33 (3): 415-436.
Stewart H and Blayney D. P (2011) Retail Dairy Prices Fluctuate with the Farm Value of Milk. Agricultural and Resource Economics Review, Vol. 40 (1): 201-217.
Thomas R. L. (1997), Modern Econometrics: An Introduction, Addison-Wesley Longman Ltd, Essex.