The effect of different types of online
reviews on Instagram regarding
users’ choice of a restaurant
Nicola Mirjam Stoitzner
Dissertation written under the supervision of Daniela Langaro
Dissertation submitted in partial fulfilment of requirements for the MSc in
Management with Specialization in Strategic Marketing,
Abstract
Title The effect of different types of online reviews on Instagram regarding users’ choice of a restaurant
Author Nicola Mirjam Stoitzner
The digital transformation in the hospitality and tourism industry has led to a multitude of upheavals and the development of new communication channels. Social media platforms have been widely used for the purpose of sharing information between consumers about products and services. More users share their experiences with restaurants with an online audience that goes far beyond their personal contacts. Online reviews provide valuable information for potential customers to facilitate their purchase decision. Additionally, restaurant managers benefit from feedback systems, as they are able to assess strengths and weaknesses of their services.
Previous studies have shown that electronic Word-of-Mouth has had a significant effect on consumers’ decision-making process in the hospitality industry. The restaurant sector in particular is one of the most strongly influenced by social media platforms such as Instagram. This research study focuses on the effect of different types of online reviews on Instagram regarding users’ choice of a restaurant. An empirical approach was chosen to evaluate the effects of reviews on Instagram on consumer behavior in the restaurant sector. A survey designed to gain insights into user`s responses to relevant Instagram content collected 316 valid responses. The results show that content showcasing food quality, service quality and restaurant atmosphere has a significant and positive impact on trust, customer perceived value and thereby, purchase intention. This study provides valuable information to restaurants, identifies areas of research that can help them understand the power of Instagram and take advantage of online reviews on Instagram as a new marketing tool.
Keywords eWOM, online reviews, social media, Instagram, restaurant attributes, trust in content, customer perceived value, purchase intention, hospitality, tourism
Sumário
Título O efeito de diferentes tipos de revisões on-line na Instagram sobre a escolha dos usuários de um restaurante
Autor Nicola Mirjam Stoitzner
A transformação digital na indústria hoteleira e turística tem levado a uma multiplicidade de convulsões e ao desenvolvimento de novos canais de comunicação. Mais usuários compartilham suas experiências com restaurantes com um público online que vai muito além de seus contatos pessoais. As análises online fornecem informações valiosas para os potenciais clientes para facilitar a sua decisão de compra. Além disso, os gerentes de restaurantes se beneficiam de sistemas de feedback, pois são capazes de avaliar os pontos fortes e fracos de seus serviços.
Estudos anteriores mostraram que a palavra electrónica boca a boca teve um efeito significativo no processo de tomada de decisão dos consumidores na indústria hoteleira. Este estudo de pesquisa foca o efeito de diferentes tipos de revisões on-line na Instagram sobre a escolha dos usuários de restaurantes. Uma abordagem empírica foi escolhida para avaliar os efeitos das críticas sobre o Instagram na escolha de um restaurante. Uma pesquisa concebida para obter insights sobre as respostas dos usuários aos conteúdos relevantes do Instagram coletou 316 respostas válidas. Os resultados mostram que o conteúdo que mostra a qualidade dos alimentos, a qualidade do serviço e a atmosfera do restaurante tem um impacto significativo e positivo na confiança, no valor percebido pelo cliente e, portanto, na intenção de compra. Este estudo fornece informações valiosas aos restaurantes, identifica áreas de pesquisa que podem ajudá-los a entender o poder da Instagram e aproveitar as análises on-line da Instagram como uma nova ferramenta de marketing.
Palavras-Chave eWOM, online reviews, social media, Instagram, restaurant attributes, trust in content, customer perceived value, purchase intention, hospitality, tourism
Acknowledgements
First, I would like to thank my parents not only for the amazing opportunity to study at one of the most prestigious universities in Europe, but also for the constant and extraordinary support throughout these past months. Their support is always unconditionally precious for my achievements and success.
In addition, I would like to express my gratitude and appreciation to my supervisor, Professor Daniela Langaro, for her advice and all the support given throughout the entire process. Her availability and orientation in the development of this dissertation were the key to the delivery and improvement of this research.
To all my friends, who always encouraged me to continue and to do my best, even in the most stressful moments. Thank you for all the patience and support.
Finally, I would like to show my appreciation to all participants of my survey. Their collaboration and personal time were crucial for the results and conclusions of this dissertation.
Table of Contents
Abstract ... i
Sumário ... ii
Acknowledgements ... iii
Table of Contents ... iv
Table of Figures ... vii
Table of Tables ... viii
Table of Appendices... ix List of Abbreviations ... x 1. Introduction ... 1 1.1. Problem Statement ... 2 1.2. Research Objectives... 2 1.3. Research Questions ... 2 1.4. Scope ... 3
1.5. Significance of the Study ... 3
1.6. Dissertation Outline ... 3
2. Literature Review ... 4
2.1. The Hospitality Industry ... 4
2.2. Social Media ... 4
2.3. The importance of Social Media in the Hospitality Industry ... 5
2.4. Electronic Word-of-Mouth ... 5
2.4.1. Instagram ... 6
2.4.2. Online Reviews ... 7
2.4.3. User-Generated Content ... 8
2.5. Restaurant Attributes ... 9
2.6. Effects of Restaurant Attributes and Customer Perceived Value ... 10
2.9. Conclusion and Conceptual Framework ... 14
3. Methodology ... 15
3.1. Research Approach ... 15
3.2. Research Design ... 15
3.3. Population and Sample Size ... 16
3.4. Measurement... 16
3.5. Stimuli ... 18
3.6. Questionnaire Design... 19
3.7. Data Analysis ... 20
4. Analysis and Results ... 21
4.1. Sample Description ... 21 4.2. Reliability Test ... 24 4.3. Validity ... 24 4.4. Normality Test ... 26 4.5. Pearson’s Correlation... 26 4.6. Hypotheses Testing ... 27
4.6.1. Hypotheses: H1a, H1b and H1c ... 27
4.6.2. Hypotheses: H2a, 2b and 2c ... 28
4.6.3. Hypothesis 3 ... 29
4.6.4. Hypothesis 4 ... 29
4.7. Comparison between the Types of Content ... 30
4.7.1. Customer Perceived Value ... 30
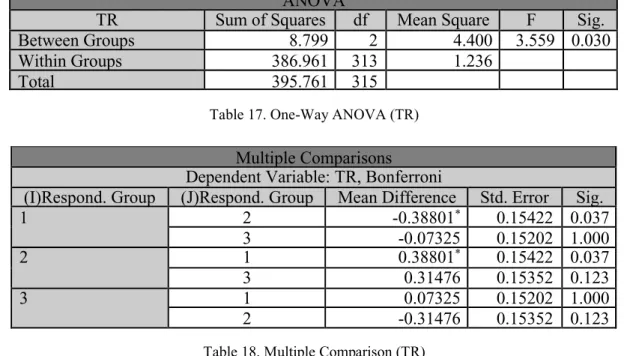
4.7.2. Trust in the Content ... 31
4.7.3. Purchase Intention ... 32
5. Conclusion ... 34
5.1. Main Findings and Conclusions ... 34
5.2. Academic Contributions ... 34
5.3. Managerial Contributions ... 35
Table of Figures
Figure 1. Stimuli: Food Quality ... 18
Figure 2. Gender ... 22
Figure 3. Age ... 22
Figure 4. Occupation ... 23
Table of Tables
Table 1. Trusting beliefs and attitudes as key elements of eWOM trust (Weitzl, 2016) ... 12
Table 2. Constructs ... 17
Table 3. Number of Respondents ... 21
Table 4. Cronbach's Alpha ... 24
Table 5. Principal Component Analysis ... 25
Table 6. Normality Test ... 26
Table 7. Correlations ... 27
Table 8. Regression: H1 ... 28
Table 9. Regression: H2 ... 28
Table 10. Regression: H3 ... 29
Table 11. Regression: H4 ... 29
Table 12. Hypotheses Testing ... 30
Table 13. Test of Homogeneity of Variances (VAL)... 31
Table 14. One-Way ANOVA (VAL) ... 31
Table 15. Multiple Comparison (VAL)... 31
Table 16. Test of Homogeneity of Variances (TR) ... 31
Table 17. One-Way ANOVA (TR) ... 32
Table 18. Multiple Comparison (TR) ... 32
Table 19. Test of Homogeneity of Variances (PI) ... 32
Table 20. One-Way ANOVA (PI)... 32
Table of Appendices
Appendix 1. Survey (English version) ... X Appendix 2. Survey (German version) ... XVII Appendix 3. Demographics ... XXIV Appendix 4. Description of the Sample ... XXV Appendix 5. Cronbach's Alpha ... XXVII Appendix 6. Principal Component Analysis (PCA)... XXVIII Appendix 7. Normality Test ... XXIX Appendix 8. Pearson's Correlation ... XXX Appendix 9. Linear Regression (FQ) ... XXX Appendix 10. Linear Regression (SQ) ... XXXI Appendix 11. Linear Regression (AT) ... XXXII Appendix 12. Multiple Linear Regression: TR on PI ... XXXIV Appendix 13. Multiple Linear Regression: VAL on PI ... XXXIV Appendix 14. One-Way ANOVA: VAL ...XXXV Appendix 15. One-Way ANOVA: TR ... XXXVI Appendix 16. One-Way ANOVA: PI ... XXXVI
List of Abbreviations
AT Atmosphere
eWOM Electronic Word-of-Mouth
FQ Food quality
K-S Kolmogorov-Smirnov
KMO Kaiser-Meyer-Olkin
PCA Principal component analysis PI Purchase intention
RQ Research question
SQ Service quality
TR Trust in the content UGC User-generated content VAL Customer perceived value WOM Word-of-Mouth
1. Introduction
In today’s competitive restaurant market, it is assumed that the key to gain an advantage towards other competitors lies in delivering high-quality service that will lead to customer satisfaction (Han and Ryu, 2007). Especially, service quality has become the core marketing priority since it is a prerequisite of consumer loyalty, such as repeat sales and positive WOM (Han and Ryu, 2009; Liu and Jang, 2009b). In the hospitality and tourism industry, online consumer reviews have been studied for various research problems (e.g. Kim et al., 2016; Xiang et al., 2017; Xiang and Gretzel, 2010). Consumers are more likely to visit a restaurant with positive reviews; however, if critics are negative in their reviews, people might stay away (Resnick et al., 2000). Restaurant guests that are willing to share positive Word-of-Mouth (WOM) represent a crucial source of generating long-term profitability (Marinkovic et al., 2014).
Social media platforms are an essential tool to understand consumers’ needs, to gain more knowledge about their attitude and to maintain effective relationships. Online platforms, such as Instagram, are an important source of information since consumers regularly evaluate products, services and experiences (Barreda et al., 2015; Colliander and Marder, 2018; Sheldon and Bryant, 2016). Despite the significant impact of eWOM in the hospitality industry, especially in the restaurant sector, few researches have been done to investigate Instagram as a platform for online reviews. In general, restaurant attributes, such as food quality, atmosphere, and service quality, can be perceived by users when they are browsing through social media. Research has shown that restaurant attributes can affect purchase intention (Yan et al., 2015) as well as trust in the content (Erkmen and Hancer, 2019) and customer perceived value (Ryu et al., 2012). Academics and managers know relatively little about how restaurant attributes elicit customer perceived value, trust in the content and purchase intention regarding the choice of a restaurant affected by online reviews on Instagram. To the best of our knowledge none of previous studies have examined the linkage between restaurant attributes and its effect on Instagram regarding the perceived value, trust and consumers’ decision-making process. Consequently, this study aims to bridge these gaps by developing an integrated model that explicitly accounts for the effects of three components of restaurant attributes, customer perceived value, trust in the content and purchase intention.
1.1. Problem Statement
After reviewing user’s content on Instagram, consumers’ purchase intention in the context of choosing a restaurant can be affected by relevant restaurant attributes (Parasuraman et al., 1988; Ryu and (Shawn) Jang, 2008; Stevens et al., 1995), customer perceived value (Ryu and (Shawn) Jang, 2008; Sweeney and Soutar, 2001; Chiang and Jang, 2007) and trust in the content (Laurent et al., 1995; Weitzl, 2016; Chiang and Jang, 2007). Hence, this study aims to find out how restaurant attributes, communicated in the posts on Instagram, affect customer perceived value, trust in the content and thereby, purchase intention.
1.2. Research Objectives
This study investigates the effect of online reviews on Instagram regarding the choice of a restaurant and to better understand the role that an online review on Instagram has for a restaurant consumer and manager. Moreover, it focuses on the influence of the posted content on a set of dependent variables (customer perceived value, trust in the content and purchase intention towards the restaurant).
1.3. Research Questions
Given the growing popularity of Instagram and the lack of research of its impact on the restaurant industry, further research is necessary. In light of the increasing usage of online reviews in the hospitality industry, this study will focus on evaluating restaurant attributes (food quality, service quality and atmosphere) posted on Instagram, regarding customer perceived value, trust in the content and the impact on purchase intention. Therefore, the following research questions (RQ) were developed in order to investigate the topic:
RQ1. To what extent do different restaurant attributes (food quality, service quality and atmosphere), communicated in Instagram posts, impact customer perceived value towards the restaurant?
RQ2. To what extent do different restaurant attributes (food quality, service quality and atmosphere), communicated in Instagram posts, impact trust in the content towards the restaurant?
RQ3. What is the impact of customer perceived value on purchase intention regarding online reviews on Instagram?
RQ4. What is the impact of trust in the content (communicated in Instagram posts) on purchase intention?
1.4. Scope
In order to narrow the scope of this dissertation, the main focus was on online reviews of a restaurant on Instagram. Due to time constraints, the researcher chose to focus the analysis on the impact of restaurant attributes (food quality, service quality and atmosphere) communicated in posts on Instagram, might have on customer perceived value and trust in the content. Moreover, the impact of customer perceived value and trust in the content on purchase intention. The research will be restricted to the source of the social media platform, Instagram and its user-generated content (photos and comments).
1.5. Significance of the Study
This study is important both, theoretically and practically. It attempts to introduce a conceptual model that focuses on the relationship between restaurant attributes, customer perceived value and trust in the content, thereby on purchase intention. Practically, this study can provide various insights into the important role of restaurant attributes, customer perceived value and trust in the content to managers of a restaurant.
1.6. Dissertation Outline
This dissertation consists of five chapters. In the beginning a brief introduction of the topic, problem statement, research objectives and questions, the scope and the significance of the study are presented. The second chapter represents the literature review, providing an overview of the relevant theories and previous works on this topic. The third chapter establishes the methodology used within this research study. The fourth chapter provides the results and analysis of the data. Finally, chapter five represents the main conclusions, academic contributions, managerial contributions, limitations and topics for further research.
2. Literature Review
This chapter represents a literature review, based on previous studies and empirical evidences provided on journals, academic papers and concepts which can be seen on the conceptual framework of this study. First, the researcher starts with an overview about the hospitality industry, social media and its importance. Second, eWOM, Instagram, online reviews, user-generated content (UGC) and restaurant attributes will be further discussed. These topics are followed by a brief reference to the effect of restaurant attributes and customer perceived value, trust in the content and purchase intention. Additionally, it presents the conceptual framework and the developed hypotheses.
2.1. The Hospitality Industry
The hospitality industry has been exponentially expanding in the past decades. Hospitality refers to the service industry including hotels, restaurants and other tourism-related services. Therefore, this industry is important not only for societies but also for economics, customers and employees. According to Ottenbacher et al. (2009), restaurants are one of the six largest industries in the field of hospitality-tourism. Previous research on the hospitality industry has generally focused on the perspective of restaurants as service providers (Marinkovic et al., 2014).
2.2. Social Media
Over the last decade, social media websites are considered as the most powerful development for an interactive way of communication (Xiang et al., 2015). Kaplan and Haenlein (2010) define social media as “a group of internet-based applications that builds on the ideological and technological foundations of Web 2.0, and it allows the creation and exchange of UGC”. Web 2.0 enables consumers to extend their experiences and insights of the economy and social areas (Constantinides and Fountain, 2008). Blogs, social media networks, forums, and online communities are considered as different categories of Web 2.0 (Constantinides and Fountain, 2008). Social media websites are platforms, where users can participate, create and distribute content such as blogs, reviews, social networking service, online communities, virtual game worlds etc. (Kaplan and Haenlein, 2010). Social media has a variety of different functions that make it possible for users to develop and distribute content that is mostly generated by themselves or others (Kaplan and Haenlein, 2010). Social media as a marketing tool is becoming an elemental part of a business’ promotional mix (Chu and Kim, 2011). They create
to better understand personalized services (Buhalis, 2000). Generally, social media is a great opportunity for companies to enhance their marketing, improve their brand image and promote their products or services in a cost-effective way (See-To and Ho, 2014). Moreover, it enables them to engage with their customers and to get better insights.
2.3. The importance of Social Media in the Hospitality Industry
Social media and search engines have significantly impact the hospitality and tourism sector (Leung et al., 2013). Moreover, it was shown that in order to increase the awareness of restaurant services it is crucial to view the entire process from consumers’ perspective (Andersson and Mossberg, 2004; Warde and Martens, 2000). Academic studies also discovered the capacity of social media in helping tourism and hospitality companies to engage with potential customers (Leung et al., 2013). Nowadays it is possible to exchange information more easily and it enables interactions between online users, especially when it comes to online restaurant consumers.
Generally, marketers need to deal with the challenge that consumers can talk about a product or service in an environment without any rules and restrictions. Companies lose control about the content that users create and distribute about their brand on social media platforms (Kaplan and Haenlein, 2010). Users gather to get more information about new products and services in the market through sharing at photos, watching videos, writing comments and uploading reviews (Barreda et al., 2015). The implementation of social media is a marketing communication for restaurants and supports the creation of a deeper connection between a brand and a consumer (Chu and Kim, 2011). Although social media, has had an enormous impact in the restaurant industry, there is a lack of empirical data to define and explain the task of Instagram in the context of online recommendations regarding restaurants. Given the importance of Instagram and its potential impact on the online restaurant community, it is considered to be essential to understand the content posted on this platform in regard of the choice of a restaurant.
2.4. Electronic Word-of-Mouth
WOM is a marketing communication, which is appearing among consumers (Buttle, 1998). Moreover, it is the process of sharing information and opinions regarding a specific product or service between customers (Jalilvand, 2012). The concept of traditional WOM has evolved to eWOM. eWOM can be a positive or negative comment, opinion or review about a product or
company, distributed by customers (Hennig-Thurau et al., 2004). Today, WOM is both online and offline (face-to-face) communication.
Since the development of Web 2.0, a range of new opportunities have changed consumers’ attitude and therefore, consequently, companies’ and brands’ marketing strategies. Consumers started quickly using web 2.0 tools (e.g. consumer review sites, social networking sites) to communicate and interact with other users (Lee et al., 2008). eWOM is targeting a much wider audience and has a global impact and influence on consumers (Gretzel, 2017; Ye et al., 2011). With the growing availability and popularity of eWOM, online product reviews are now an emerging market phenomenon that is playing an increasingly important role in consumers’ attitude (Chu and Kim, 2011). eWOM influences consumers’ attitude, purchase intention and behavior in the online and offline market (Reichelt et al., 2014).
As a result, it is important for restaurants to pay attention to online feedback. Restaurants try to keep any negative information to a minimum and maximize positive feedback (Reichelt et al., 2014). Well-organized social media sites can create virtual relationships with existing customers or convince a new guest to visit a restaurant (Pantelidis, 2010). Social media provides restaurants with the opportunity to create and evolve their brand image by engaging in eWOM without investing a lot of money in traditional marketing communication (See-To and Ho, 2014). Additionally, a restaurant can oversee its online reputation by actively participating in social media (Needles and Thompson, 2013). Marketeers and also restaurant managers need to understand the concept of eWOM and consumers’ engagement, since this leads to a better managing of its potential force in PI (Goldsmith and Horowitz, 2006). Instagram and online reviews need to be discussed in this research to highlight the most relevant types of eWOM for this study.
2.4.1. Instagram
Instagram is a social media platform where users can share their photos and videos (Barreda et al., 2015). The ability to share photos with others is one of the main reasons why people started to use social media platforms, such as Instagram (Colliander and Marder, 2018). Instagram gives people the opportunity to present their pictures with an online audience that goes far beyond their personal contacts (Colliander and Marder, 2018). Since its launch in 2010, it has quickly become a new marketing medium and is considered as one of the most popular photo and video capturing and sharing application in the Web 2.0 (Hu et al., 2014). It offers its users various ways to share their photos and videos using their mobile devices (Hu et al., 2014). Users
on Instagram are called “followers” (Hu et al., 2014). Users can see photos and videos by viewing a core page, called “feed”. As a recent trend, more and more restaurants publish photo or video content about their food, service staff, atmosphere etc. Instagram provides a complete communication facility, from restaurant branding to UGC (Fatanti and Suyadnya, 2015). This platform initially serves as a media for online photography evolve effectively in providing information services fast, precise and efficient (Doolin et al., 2002; Sweeney, 2000).
Since consumers use Instagram significantly more than any other website, it is important for companies to know why their customers might use this platform and what they can expect from this application (Sheldon and Bryant, 2016). In the scope of this dissertation, the social media platform Instagram can give us a new idea about the role of online reviews in the restaurant sector. Instagram creates good and bad impressions based on the personal experience towards a restaurant (Hanan and Putit, 2014). The content creates its own impression to the viewer and shares the experience on a particular restaurant visit (Hanan and Putit, 2014). Instagram is an important tool for users to express their feeling towards restaurant experiences. The uniqueness and the art of photo content can create emotions towards restaurants. The environment and atmosphere of a restaurant may be better captured in a picture than in a written review on other online review websites.
2.4.2. Online Reviews
Unrestricted consumer review access has shifted market power from companies to consumers (Parikh et al., 2014). For the tourism and hospitality industry, reviews and recommendations are crucial for their success and failure. According to the National Restaurant Association, 92% of frequent social media users eat at a restaurant at least once a month and 32% of consumers use their mobile device during a visit, meaning that one third of all visitors are sharing their meal to their audience via social media (Storms, 2014).
Online reviews have changed consumers’ decision making in the hospitality and tourism sector. According to Everett (2019), 33% read peer online reviews before selecting a restaurant to visit. When consumers have only limited source of information about a restaurant, they are more likely to inform themselves upfront (Parikh et al., 2014). For restaurant consumers, user-generated websites can be a good source of information which helps them reduce consumers’ perceived purchase risk (Parikh et al., 2014). In the tourism and hospitality industry, the consumers’ decision-making process is highly influenced by eWOM (Gretzel, 2017; Ye et al., 2011). For example, online reviews written by tourism consumers are seen as more reliable
then information distributed directly by travel service providers (Ye et al., 2011). In particular, online reviews provide helpful information for future consumers when choosing a restaurant (Titz et al., 2004). Restaurant reviews introduce an assortment of information that simplify consumers’ decision-making process. When observing these reviews, consumers can get detailed information, for example, about the restaurant atmosphere, the quality of service and food. Simultaneously, this allows managers to learn what people say about their restaurant and provides them with many opportunities to improve their performance (Needles and Thompson, 2013). Generally, there are two types of online reviews: consumer-generated reviews that are based on personal experiences, and reviews that are written by professional editors (Chu and Kim, 2011). In light of the research objective, this study focuses on UGC.
2.4.3. User-Generated Content
UGC is growing in its popularity. UGC describes different forms of media content that are publicly available and distributed by users (Kaplan and Haenlein, 2010). According to Xiang and Gretzel (2010), UGC can be supported through the use of social media and can be defined as “a mixture of facts and opinions, impressions and sentiments, founded and unfounded tidbits, experiences, and even rumors”. Feedback from users serves as an information channel for consumers (Parikh et al., 2014). Due to the perceived independence of the message source, content generated on social media is considered to be an influential source of information (Ladhari and Michaud, 2015).
From a restaurateurs’ perspective, these platforms can provide insights into preferences, needs and reactions of customers (Miguéns et al., 2008). The aim of online restaurant reviews is to inform potential customers about the strengths and weaknesses of a restaurant (Parikh et al., 2014). Users seek to distribute reviews that are helpful to peer-users who are not familiar with the reviewed restaurant (Parikh et al., 2014).
The combination of social media with the technology of mobile devices makes capturing an experience enjoyable (Jiménez and Mendoza, 2013). In the hospitality context, photo content provided on Instagram is a symbol of reality and user-experience. Experience goods such as restaurant visits, can only be fully assessed after the purchase (Nelson, 1970). Nelson’s (1974) research leads to the assumption that is of great importance for consumers to gather information before purchasing the product or service. In general, consumers are more insecure when it comes to experience goods simply because people are more likely to have an individual’s opinion about the quality of a product or service that might differ from traditional advertising
(Jiménez and Mendoza, 2013). In order to analyze the product performance of experience goods, consumers look for a few online reviews that agree on the same things rather than a particular information (Jiménez and Mendoza, 2013).
This study focuses on UGC (photos and comments) on Instagram in order to investigate the relation between restaurant attributes, such as food quality, service quality and atmosphere, trust in the content, customer perceived value and purchase intention in regard of restaurant visits. Based on the literature presented above, it can be assumed that in general consumers tend to trust recommendations of peer-users. Especially within Instagram, where users are able to offer a brief overview in the form of photos and comments, it might be a suitable platform for experience goods advertising such as booking a restaurant. Posting a picture with a short comment might be enough to trigger purchase intentions.
2.5. Restaurant Attributes
To examine the impact of online reviews on Instagram regarding restaurants, it is necessary to identify the relevant attributes. Previous research has highlighted the most important attributes in the hospitality industry, especially in the restaurant sector (Azevedo et al., 2017; Kim et al., 2009; Marinkovic et al., 2014; Ryu et al., 2012). Food quality, service quality and atmosphere can affect consumers’ purchasing behavior and repurchasing behavior (Booms and Bitner, 1982; Brady and Cronin, 2001; Jang and Namkung, 2009; Ryu et al., 2012; Zeithaml et al., 1996). Food quality is one of the components that contributes to overall satisfaction with a dining experience (Sulek and Hensley, 2004). Sulek and Hensley (2004) stated that food quality has a significant effect on revisit intention. A customer might evaluate multiple attributes when determining food quality, but he or she is mainly judging three general food characteristics: safety, appeal and dietary issues (Sulek and Hensley, 2004). Although food safety might not be immediately apparent, customers notice undercooked food or food with an off-taste (Chung and Hoffman, 1998). Food appeal includes taste, presentation, textures, colors, temperature, size of the portions, and entrée complexity (Sulek and Hensley, 2004).
However, restaurant customers also evaluate the quality of the received service (Fitzsimmons and Maurer, 1991). Ladhari et al. (2008) state that service quality is an important trigger for customers’ satisfaction. Previous research has determined that the performance of service staff (Kim and Cha, 2002; Zeithaml et al., 1996) and physical environment (Ryu and (Shawn) Jang, 2008) has a significant impact on the overall satisfaction.
greater complexity and includes factors such as lighting, color, cleanliness and music (Sulek and Hensley, 2004). A manager can express the restaurant’s characteristics by these elements and creates an expectation of the dining experience even before a costumer is served (Bitner, 1990).
In the context of this study, the researcher aims to investigate if UGC (posts and comments) on Instagram about food quality, service quality or restaurant atmosphere might trigger a restaurant visit for users. Therefore, it is interesting to analyze the impact of restaurant attributes on customer perceived value.
2.6. Effects of Restaurant Attributes and Customer Perceived Value
Zeithaml (1988) defines customer perceived value as “the result of the personal comparison between perceived overall benefits and the perceived sacrifices or costs paid by the customer”. According to Ryu et al. (2012), restaurant attributes have a positive and significant effect on perceived value. Ryu et al. (2012) found that customers who have a positive restaurant image are more likely to believe that the restaurant offers good customer perceived value and high customer satisfaction.
Existing literature shows that product and service quality can predict customer perceived value (Bolton et al., 2004; Chen and Hu, 2010; Ryu et al., 2012). Previous studies have highlighted food quality (Delwiche, 2004; Jang and Namkung, 2009), service quality (Parasuraman et al., 1988) and restaurant atmosphere (Law et al., 2008) for the concept of customer perceived value. Service quality features (e.g. tangibles, empathy, reliability and responsiveness) have a positive relationship with customer perceived value (Eggert and Ulaga, 2002; Parasuraman et al., 1988). Ryu and (Shawn) Jang (2008) show that food quality significantly affects perceived value. By combining the definition of the customer perceived value (Zeithaml, 1988) and the research mentioned above, we can conclude that the perceived benefits or value by a customer must be related to food quality, service quality, and/or atmosphere. This finding is also consistent with other research conducted by Ryu et al. (2008, 2012). However, considering the fact that customer perceived product quality influences perceived value of costumers in the context of restaurants, it is logical to propose the link between food and service quality as well as restaurant atmosphere. According to Han and Ryu (2009), there is a positive relationship between restaurant physical environment and customer perceived value. Liu and Jang (2009) demonstrate the relationship between atmospherics, emotional responses and customer perceived value. As a result, Liu and Jang (2009) show that a restaurant’s atmosphere has a
significant effect on customer perceived value. Therefore, the perceived value of Instagram users can be based on their perception from UGC of food quality, service quality and atmosphere. This leads us to develop the following hypotheses of this study:
H1a. The food quality level, communicated in the posts, has a significant and positive impact on customer perceived value towards the restaurant.
H1b. The service quality level, communicated in the posts, has a significant and positive impact on customer perceived value towards the restaurant.
H1c. The atmosphere level, communicated in the posts, has a significant and positive impact on customer perceived value towards the restaurant.
In order to answer the research questions, Instagram was chosen as an example for social media platforms, where content about restaurants often appears. Understanding the broadness of this topic and how it affects the trust in the content is crucial for this study. Therefore, trust in the content will be discussed.
2.7. Effects of Restaurant Attributes and Trust in the Content
In the theoretical model presented in this dissertation, the researcher considers trust in the content on social media platforms, such as Instagram, and eWOM as an important variable, which may affect individual’s behavior in purchase intentions. Hence, this concept is crucial for answering the research questions. This chapter is going to explain the concept behind trust in the content.
84% of consumers trust online reviews as much as personal recommendations (Robben, 2018). Trust is a psychological instrument, which helps people to reduce any doubts when they are interacting with others (Weitzl, 2016). People are confronted with the theory of trust every day (Weitzl, 2016). According to Weitzl (2016), trust is fundamental for people to be able to deal with society and any kind of relationships. Since trust also plays an important role in the context of economy and marketing, marketers are highly interested about its part in business-related subjects (Weitzl, 2016). Trust is of great importance when it comes to sharing knowledge (Weitzl, 2016). Chai and Kim (2010) state that within eWOM trust is the basis for people to be part of a social connection including sharing and trading knowledge. Moreover, trust also has a beneficial effect on consumer behavior and their choice to share knowledge online (Chai and Kim, 2010). Trust in eWOM, including Instagram and online reviews, is expected to increase the value of the content (Weitzl, 2016).
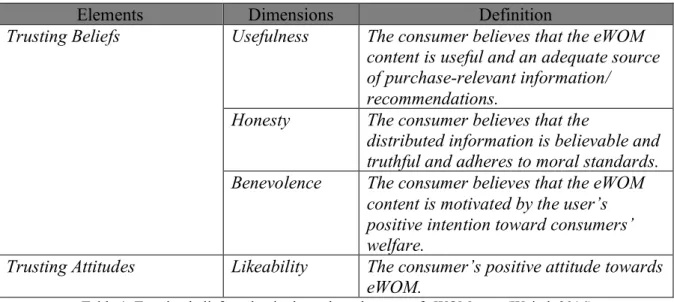
Weitzl (2016) categorizes the key elements and dimensions of trust in eWOM as following: trusting beliefs (usefulness, honesty and benevolence), trusting attitudes (likeability) and trusting intentions (willingness to rely on). For the purpose of the study, trust is used as the sense of trusting beliefs and trusting attitudes. The degree in which somebody thinks that the other individual is trustworthy and feels good about their beliefs is known as trusting beliefs (Weitzl, 2016). Kim and Tadisina (2007) define trusting attitudes as an individual’s assessment of characteristics that want to be perceived as trusted. The table below demonstrates these two important key elements of eWOM. The dimensions were adjusted accordingly to the research objectives. Understanding the different dimensions of trust helps to further understand the conceptual framework and the importance for UGC of food quality, service quality and atmosphere.
Elements Dimensions Definition
Trusting Beliefs Usefulness The consumer believes that the eWOM
content is useful and an adequate source of purchase-relevant information/ recommendations.
Honesty The consumer believes that the
distributed information is believable and truthful and adheres to moral standards.
Benevolence The consumer believes that the eWOM
content is motivated by the user’s positive intention toward consumers’ welfare.
Trusting Attitudes Likeability The consumer’s positive attitude towards
eWOM.
Table 1. Trusting beliefs and attitudes as key elements of eWOM trust (Weitzl, 2016)
In this study, trust in the content can be considered as a personal trust towards other users on Instagram. For example, when a user is exposed to content of food quality, service quality or restaurant atmosphere, it is important that an individual perceive these photos and comments as useful and an adequate source of purchase-relevant information (Weitzl, 2016). Moreover, users need to have the feeling that the posts are honest, believable and truthful (Weitzl, 2016). On the other hand, it is crucial that users believe that the content is motivated by the other user’s positive intention towards his or her welfare (Weitzl, 2016). Hence, the concept of trust in the content can be defined by the usefulness, honesty, benevolence and likeability and will be further analyzed in the study.
H2a. The food quality level, communicated in the posts, has a significant and positive impact on trust in the content towards the restaurant.
H2b. The service quality level, communicated in the posts, has a significant and positive impact on trust in the content towards the restaurant.
H2c. The atmosphere level, communicated in the posts, has a significant and positive impact on trust in the content towards the restaurant.
The research discussed in this chapter serves as a background for consumers’ attitudes towards eWOM. Since perceived value and trust in eWOM is important for consumers’ potential behavior, such as purchase intention, it makes sense to include these concepts in this dissertation. Related to Instagram, this would mean that if the posts about restaurant attributes are truthful enough (Weitzl, 2016), people might visit or book a restaurant. Further, since the source of trust also plays an important role in eWOM (Di Virgilio, 2018), it can be assumed that the UGC needs to be perceived as valuable and adequate in order to trigger purchase intention.
2.8. Customer Perceived Value, Trust in the Content and Purchase Intention
It is clear that within the restaurant industry, managers want to increase their profit, financial performance, and marketing is one of the important tools to do so. Recent studies showed that online marketing helps different industries to improve their performance (Ladhari et al., 2008) In general, intentions to perform all kind of behaviors can be predicted from attitudes toward the behavior and subjective norms (Ajzen, 1991). The theory of planned behavior shows that a person’s intention to engage in a certain behavior is formed by his or her attitudes toward the behavior, subjective norms and perceived behavioral control (Ajzen, 1991). Consumers’ attitude has an influence on their behavior and furthermore, it affects their purchase intention (Lu et al., 2014). This underlying theory is a good construct to further investigate in this field. With the objective of mitigating perceived risk, consumers often analyze information posted by peer consumers about products and services they want to buy (Khammash and Griffiths, 2011; Pitta and Fowler, 2005). Also, the influence of consumer attitudes towards a blog on purchase intention is significantly positive (Bouhlel et al., 2010). Before buying a product or service, consumers evaluate different attributes and precisely investigate their importance. After this process, they make the purchasing decision.
Purchase intention is the likelihood that consumers will consider buying a product or service in the future (Wu et al., 2011). Consumers’ purchase intention derives from their approach of product value (Lee and Lee, 2009). Purchase decisions are often influenced by the content which people read online about a product or service (Hsu and Tsou, 2011). According to Alhidari et al. (2015), due to high consumer involvement, social networking sites improve purchase intentions towards products and services. Bouhlel et al. (2010) states that there is a positive relationship between consumer attitudes towards a blog and consumers’ purchase intention. Based on the theory of planned behavior (Ajzen, 1991) and also, the technology acceptance model (Davis, 1993), this study assumes that the subjective norms and perceived usefulness can affect purchase intention. Therefore, it can be proposed that this might be accurate for Instagram posts as well. As we discussed above, these factors can be seen in the concept of trust (Weitzl, 2016; Kim and Tadisina, 2007). Beside of that, Instagram users may perceive the content as an adequate and useful source of recommendations (Weitzl, 2016) when searching for restaurants. This study suggests that consumers’ purchase intention is connected to the trust and perceived value of UGC about food quality, service quality and atmosphere. Hence, the following hypotheses were developed:
H3. Customer perceived value regarding the restaurant has a significant and positive effect
on purchase intention towards the restaurant.
H4. Trust in the content has a significant and positive effect on purchase intention towards
the restaurant.
2.9. Conclusion and Conceptual Framework
Based on the findings in the literature, this study examines purchase intention in the context of Instagram from the perspective of restaurant attributes, trust and customer perceived value. It states that food quality, service quality and atmosphere, presented in the posts on Instagram, are determined by customer perceived value and trust in the content. In addition, trust in the content and customer perceived value have been identified as important factors affecting purchase intention in the context of social media platforms (Gruen et al., 2006; Lu et al., 2016; Park and Kim, 2008).
3. Methodology
The purpose of this chapter is to outline the methodology adopted in this dissertation and to describe how data was collected, measured and analyzed.
3.1. Research Approach
The research objective of this study was to investigate the influence of food quality, service quality and atmosphere, communicated in the posts, and the role of trust in the content and perceived value on purchase intention. The conceptual framework shows that purchase intention is hypothesized to be influenced by trust in the content and customer perceived value. The nature of these relationships in turn are affected by food quality, service quality and atmosphere, communicated in the posts, which are treated in the data analysis as independent variables with multiple-scale measures.
To address the proposed research questions and objectives, primary and secondary data, including journal articles, academic papers and data generated by an online survey, were collected. Secondary data was used in the development of the Literature Review chapter. Three different types of research methods, such as the exploratory, descriptive and confirmatory, can be mentioned (Saunders et al., 2009). This dissertation applies all three types. The initial part of this research study uses exploratory research by analyzing the literature. To prove the viability of the study, different theories were analyzed in order to create an idea of the main theme, thus descriptive research was applied (Brady and Cronin, 2001; Chiang and Jang, 2007; Jang and Namkung, 2009; Kivela, 1997; Laurent et al., 1995; Namkung and Jang, 2007; Law et al., 2008; Parasuraman et al., 1988; Putrevu and Lord, 2013; Ryu and Jang, 2007; Ryu and (Shawn) Jang, 2008; Ryu et al., 2012; Sweeney and Soutar, 2001; Taylor and Baker, 1994; Weitzl, 2016). Here, the purpose is to explain more profoundly the main subject and to develop an idea of the missing parts. The confirmatory research connects these methods and its main objective is to test the mentioned hypotheses by conducting an online survey. The main purpose of quantitative research is to test the hypotheses that will allow to set conclusions and explain the main findings of this dissertation.
3.2. Research Design
An experimental design was implemented with respondents being presented to three different groups of posts, namely the quality of food, the quality of service and restaurant atmosphere. A survey was created in order to reach consumers directly and to test the hypotheses mentioned
in the section “Literature Review”. An online questionnaire was created using Qualtrics and distributed amongst different channels including social networks, such as Facebook, Instagram and WhatsApp, as well as through personal e-mails. With these options, it was possible to target the highest number of responses in an efficient and cost-saving way. The survey was accessible from 17th until 26th of November 2019.
3.3. Population and Sample Size
The target population consisted primarily of consumers, who have an experience with online reviews and users of Instagram. To ensure the understanding of all questions, the survey was published in English and German. A sample of at least 300 respondents with thus 100 respondents for each group was aimed in order to allow multivariate techniques for the data analysis. The sample was not restricted any further.
The used platforms guaranteed that the sample was random, since people from different gender and age were analyzed. The sampling technique applicable to this study is representative sampling. The probability of each case being selected is equal and therefore, inferences from the total sample can be obtained in order to answer research questions (Saunders et al., 2009). However, the participation was stimulated by the chance of winning a 30 Euros Amazon gift voucher.
3.4. Measurement
Table 1 presents all of measurement items that were assessed using a 7–point Likert-type scale, ranging from completely disagree (1) to completely agree (7). Five items were used in order to measure food quality ( Jang and Namkung, 2009; Namkung and Jang, 2007; Ryu et al., 2012;). Service quality was measured using five items ( Brady and Cronin, 2001; Jang and Namkung, 2009; Parasuraman et al., 1988; Ryu et al., 2012). In order to measure restaurant atmosphere, four items were used ( Jang and Namkung, 2009; Kivela, 1997; Law et al., 2008; Ryu and Jang, 2007; Ryu and (Shawn) Jang, 2008). Furthermore, participants were asked to express their trust towards the content on Instagram, after having seen the photos and comments by the fictional user, with the help of five items from different studies by Chiang and Jang (2007), Kim and Tadisina (2007), Laurent et al. (1995) and Weitzl (2016) that can be seen in Table 2. However, customer perceived value was measured using five items (Chiang and Jang, 2007; Sweeney and Soutar, 2001; Ryu and (Shawn) Jang, 2008). Purchase intention was evaluated using four items from the study by Chiang and Jang (2007), Putrevu and Lord (2013) as well as Taylor and
Author Dimension Items Jang and Namkung, 2009;
Namkung and Jang, 2007; Ryu et al., 2012
H1,2a: FQ FQ1-The food is delicious. FQ2-I think the food is healthy.
FQ3-The restaurant offers lots of menu items. FQ4-I think the restaurant offers fresh food. FQ5-The food presentation is visually appealing. Brady and Cronin, 2001;
Jang and Namkung, 2009; Parasuraman et al., 1988; Ryu et al., 2012
H1,2b: SQ SQ1-I think that I will receive the food as I order it.
SQ2-Employees try to minimize my waiting time.
SQ3-The service staff pays attention.
SQ4-The service staff is welcoming and friendly. SQ5-I would feel comfortable in this restaurant. Jang and Namkung, 2009;
Kivela, 1997; Law et al., 2008; Ryu and Jang, 2007; Ryu and (Shawn) Jang, 2008; Ryu et al., 2012
H1,2c: AT AT1-The style of the restaurant fits me. AT2-The interior is appealing to me.
AT3-I think that the lighting of the restaurant creates a cosy atmosphere.
AT4-The furnishing is attracting me to visit the restaurant.
Chiang and Jang, 2007; Sweeney and Soutar, 2001; Ryu and (Shawn) Jang, 2008
H3: VAL VAL1-I think that the money I am going to spend in the restaurant will match my expectations about the food quality.
VAL2-I think that the money I am going to spend in the restaurant will match my expectations about the service quality. VAL3-I think that the money I am going to spend in the restaurant will match my expectations about the atmosphere.
VAL4-I think the restaurant offers good value for the money.
VAL5-The overall expected value of visiting the restaurant is high.
Chiang and Jang, 2007; Kim and Tadisina, 2007; Laurent et al., 1995; Weitzl, 2016
H4: TR TR1-What the user says about the restaurant is true.
TR2-I have a good impression about the experience of the previous customer.
TR3-I believe that the user mostly says the truth about the restaurant.
TR4-I refer to Instagram, when family and friends ask me about restaurants.
TR5–This user’s content is reliable. Chiang and Jang, 2007;
Putrevu and Lord, 2013; Taylor and Baker, 1994
PI PI1-I am likely to visit the restaurant. PI2-I will recommend this restaurant to my friends and family.
PI3-I would consider visiting the restaurant. PI4-I have no intention to visit this restaurant.
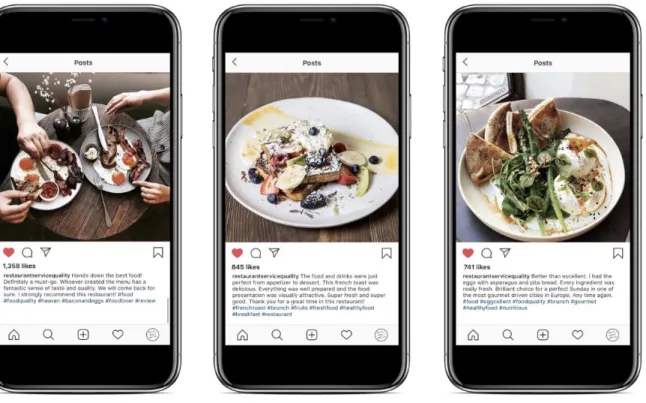
3.5. Stimuli
A stimulus pretest was conducted on Qualtrics to test the research participants on the relevant variables. The pretest was presented to 16 people. The aim was to get an impression of how the participants react to the stimuli, how much time it takes to complete the questionnaire and whether the number of items is tolerable.
For each set, we created three stimuli: food quality, service quality and atmosphere. Within these groups, a set of positive reviews was used. Three photos with additional comments were developed in order to create a review on Instagram. For example, a participant was exposed to the stimuli of food quality (Figure 1) and was asked to evaluate his opinion about the quality of food in a Likert-scale from 1 to 7 (1= completely disagree, 7= completely agree). This method was also applied to measure their opinion about service quality and atmosphere. In the next step, the participants were asked to evaluate the items of customer perceived value, trust in the content and purchase intention. Below, there are some examples of the stimulus “food quality” developed to illustrate the situations to investigate. Each of these scenarios were applied to the categories of food quality, service quality and restaurant atmosphere.
3.6. Questionnaire Design
The majority of questions in the online survey, were designed to provide greater insights into Instagram as a tool for restaurant reviews and recommendations. In line with the proposed conceptual framework, the questionnaire was divided into three main sections.
The first part included general questions pertaining to consumers’ usage of online reviews and Instagram. The participants were asked how often they use online review platforms (e.g. Tripadvisor, Zomato, Facebook etc.). The platform this academic paper focused on was Instagram. Therefore, it is important to understand if people generally use this social media platform.
The second part aimed to seek consumers’ opinion to measure the constructs, presented in Table 2, toward the perceived food quality, service quality and atmosphere. The survey unfolds in three blocks (food quality, service quality and atmosphere). The respondents were asked to imagine that they have seen the fictional profile “restaurantservicequality” on Instagram on their mobile devices. For each independent variable (food quality, service quality and atmosphere) three different posts were shown. The scenario invited the participants to see pictures and read comments about the restaurant, concerning in particular the evaluation of food quality, service quality and atmosphere. Each participant was randomly and equally allocated to one of these groups. In order to guarantee randomness and homogeneity, they only answered to questions of that specific block. Some respondents were assigned to questions about food quality or service quality. Others answered questions about the atmosphere of a restaurant seen on the user’s profile on Instagram. The questions after this section were the same for all respondents of all three groups.
With this set of questions being shown and after being exposed to the posts on Instagram, the participants were asked to indicate how completely they agree or disagree with statements about trust in the content and customer perceived value. Additionally, the respondents were asked to express their purchase intention towards the restaurant on a 7-point scale, being (1) “completely disagree; (4) “neither agree or disagree” and (7) “completely agree”. This allows the researcher to analyze the different effects that posts on Instagram can have on consumers generated by other users regarding restaurant recommendations. Finally, the third part consists of responding consumers’ demographics, including age, gender, current occupation, monthly income and nationality.
3.7. Data Analysis
The IBM SPSS® software platform was used in order to analyze the collected data via Qualtrics. It allowed to quantify consumers’ trust in the content, perceived value and purchase intention, taking into consideration the three independent variables presented in the hypotheses H1 to H4.
In the beginning, descriptive analysis was performed regarding the demographics (gender, age, current occupation, monthly income and nationality). In order to check the reliability of the constructs, Cronbach’s alpha was used, followed by a validity test. Hence, a Principal component analysis (PCA) was used to identify the linear components of a set of variables by extracting six factors (Field, 2009). In this study, PCA was conducted on 28 items with rotation varimax. To check if the population was following a normal distribution, the Kolmogorov-Smirnov (K-S) test was conducted (Field, 2009). The Pearson correlation was used to investigate the relationships between all variables to understand whether there is a correlation between food quality, service quality, atmosphere, customer perceived value, trust in the content and purchase intention. Regarding the hypotheses testing, linear multiple regressions were performed. Additionally, a One-Way ANOVA was used in order to measure which type of the content is more efficient in driving customer perceived value, trust in the content and purchase intention.
4. Analysis and Results
This chapter has the purpose of understanding the data collected and the analysis that was performed according to the methodology.
4.1. Sample Description
A total of 508 responses were recorded. From these responses, 71 out of 508 were eliminated through the screening questions, leaving a total of 437. In the screening question stage (Q1, Q2), the exclusion of respondents was based on the criteria that they never use online reviews when deciding for a restaurant (e.g. TripAdvisor, Zomato, Facebook, Google Reviews etc.) or do not use Instagram. On a scale from “(1) Never” to “(7) Always”, the results of the online reviews used when planning to visit a restaurant were the following: 28.5% of the respondents answered that they use sometimes online reviews when visiting a restaurant; 21.3% of the respondents answered almost always; 16.7% of the respondents answered that they use online reviews often; 12.9% of the respondents answered that they always use online reviews; 8.9% of the respondents answered that they rarely use online reviews; 4.2% of the respondents use online reviews occasionally and 7.6% of the respondents answered that they never use online reviews when visiting a restaurant. If people answered “(1) Never” for online reviews, they would be directed to the end of the survey. According to the survey, 87% of the participants used Instagram. 13% of the participants stated that they did not use Instagram and therefore, they also were directed to the end of the survey. Their insights would not be relevant for the present study. Finally, 316 responses were considered valid for the analysis, representing a valid response rate of 62.2%.
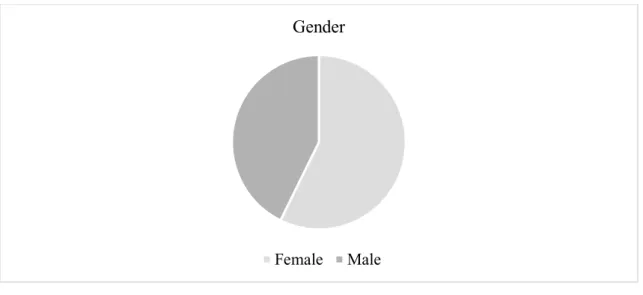
Among the 316 completed online surveys, 57.3% were female participants and 42.7% of the respondents were male participants, meaning that 181 women and 135 men successfully completed the questionnaire.
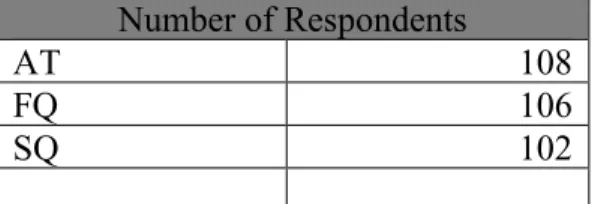
Number of Respondents
AT 108
FQ 106
SQ 102
Figure 2. Gender
The majority of the respondents were aged between 25 and 34 years old, with a total percentage of 66.8; 20.3% were aged between 18 and 24 years old; 8.5% were aged between 35 and 44 years old; 2.2% were aged between 45 and 54 years old; 1.3% were aged between 55 and 64 years old; 0.6% were aged 65 years or older and finally, 0.3% were aged under 18 years old.
Figure 3. Age
Considering the current occupation, most respondents were employed (44.9%); 36.1% were students (Bachelor, Master, Other); 15.5% were self-employed. From the remaining participants, 1.6% were High School students and the remaining are either retired or unemployed (1.9%).
Gender
Female Male
Age
Figure 4. Occupation
Regarding the monthly income (after tax), 22.2% of the respondents stated that they have a monthly net income between €2000 and €2999; 16.5% have a monthly net income between €1500 and €1999; 12.7% have a monthly net income €1000 and €1499; 11.4% have a monthly net income €500 and €999; 9.5% have a monthly net income between €0 and €499; 8.2% have a monthly net income between €3000 and €3999; 6.3% have more than €4000 and finally, 13.3% of the participants preferred not to share their income level information.
Figure 5. Monthly Income Level
More than half of the valid responses (55.7%) stated that they were from Austria; 24.1% were in Germany and the remaining 20.2% were from Portugal, Italy, United Kingdom of Great Britain and Northern Ireland, Belgium etc.
Occupation
Unemployed Employed
Self-employed Student (High School)
Student (Bachelor, Master, Other) Retired
0 5 10 15 20 25 €0-499 €500-999 €1000-1499 €1500-1999 €2000-2999 €3000-3999 More than €4000 Prefer not to answer
4.2. Reliability Test
In order to analyze the internal consistency of the measurements, meaning how closely related the constructs are as a group, the Cronbach’s alpha was assessed.
Cronbach’s alpha coefficient values below 0.6 are considered unacceptable; values between 0.65 and 0.70 are minimally acceptable; values between 0.7 and 0.8 are good and finally, values between 0.8 and 0.9 are considered as very good (DeVellis, 1991).
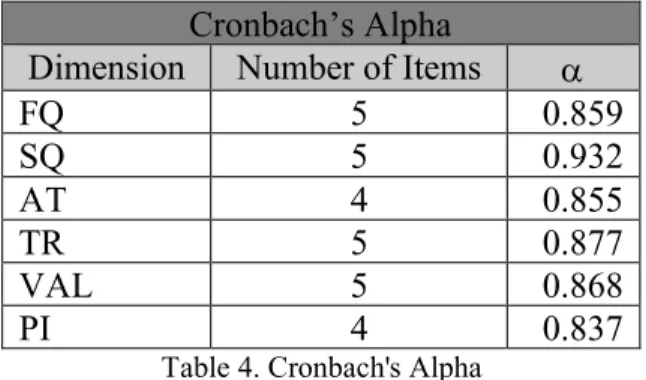
As shown in Table 3, all dimensions obtained a Cronbach’s alpha greater than 0.8, which reveals a very good level of internal consistency of the constructs. For the first construct “FQ”, the Cronbach´s alpha was 0.859; for the second one was 0.932; for the third one was 0.855; for the fourth one was 0.877; for the fifth one was 0.868; and for the sixth one, it was 0.837. Table 3 demonstrates the Cronbach’s alpha values.
Cronbach’s Alpha
Dimension Number of Items
FQ 5 0.859 SQ 5 0.932 AT 4 0.855 TR 5 0.877 VAL 5 0.868 PI 4 0.837
Table 4. Cronbach's Alpha
4.3. Validity
With the purpose of assessing dimensionality of the scales and verifying if all factors are aggregated around the component they are supposed to measure, a PCA was performed. The PCA aims to reduce a larger set of variables into a smaller set of “artificial” variables. For this purpose, PCA was performed in order to define the factors by constructs. Considering the sample size, it can be concluded that the sample is adequate for a factor analysis, since 316 valid respondents compose it. As there are six constructs, namely FQ, SQ, AT, TR, VAL and PI, six factors will be presented.
In the questionnaire, the construct “PI” was composed by four items, being that three items were on a positive sense and one was negative. The negative item was converted to positive and then the analysis continued.
The Kaiser-Meyer-Olkin measure of sampling adequacy (KMO) values can differ from 0 to 1. If the value is close to 1 it means that the patterns of correlations are compact. Hence, the factor
analysis will present reliable factors. The results of KMO show a high value of 0.885; revealing a great adequacy of the sample presented.
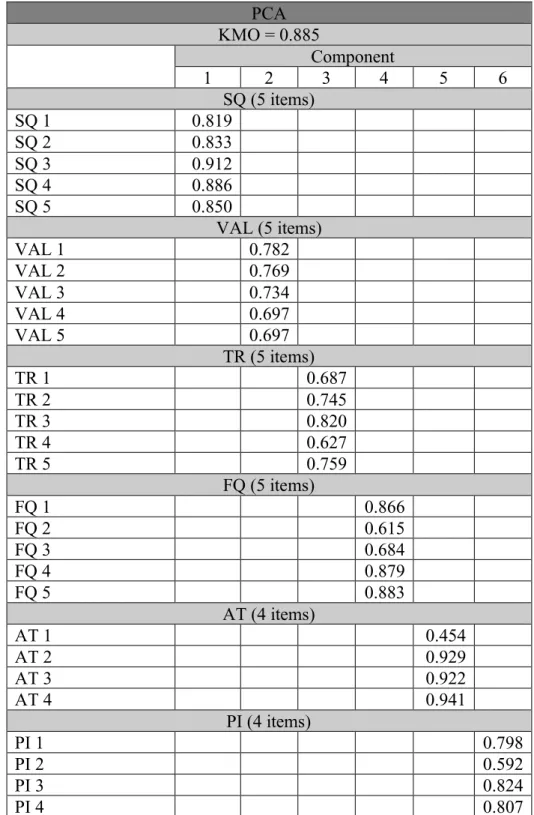
A Varimax Rotation method was run in order to interpret the factors by putting each dimension on one of the factors. The following table represents information about the PCA including the loadings by factors and the percentage of the variance explained by factors.
PCA KMO = 0.885 Component 1 2 3 4 5 6 SQ (5 items) SQ 1 0.819 SQ 2 0.833 SQ 3 0.912 SQ 4 0.886 SQ 5 0.850 VAL (5 items) VAL 1 0.782 VAL 2 0.769 VAL 3 0.734 VAL 4 0.697 VAL 5 0.697 TR (5 items) TR 1 0.687 TR 2 0.745 TR 3 0.820 TR 4 0.627 TR 5 0.759 FQ (5 items) FQ 1 0.866 FQ 2 0.615 FQ 3 0.684 FQ 4 0.879 FQ 5 0.883 AT (4 items) AT 1 0.454 AT 2 0.929 AT 3 0.922 AT 4 0.941 PI (4 items) PI 1 0.798 PI 2 0.592 PI 3 0.824 PI 4 0.807
4.4. Normality Test
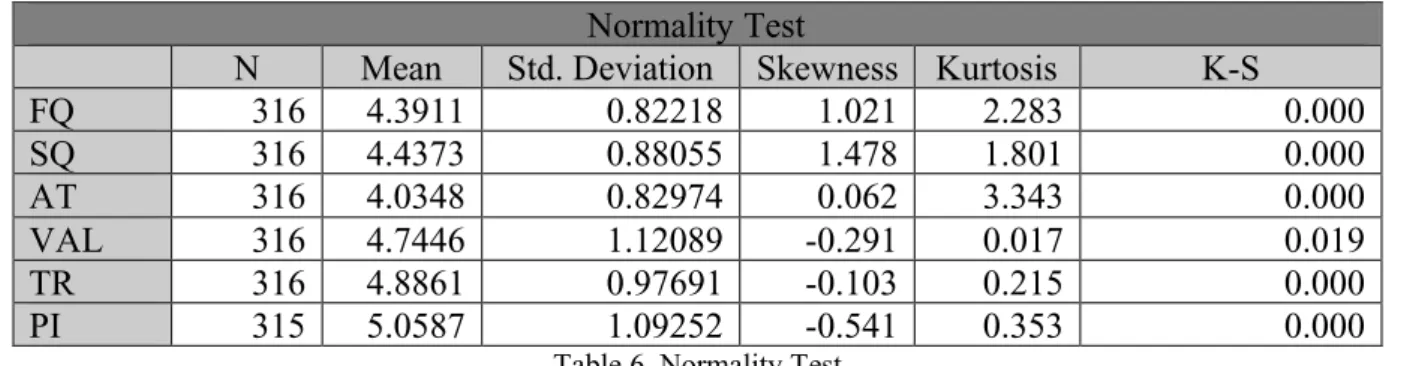
An assessment of the normality of the data is necessary to confirm that the population follows a normal distribution, since this is an underlying assumption in parametric testing. According to the Central Limit Theorem, all variables can be considered distributed normally since the sample size is greater than 30 (Fischer, 2011). In order to build the required constructs, namely FQ, SQ, AT, TR, VAL and PI, a simple average was performed (e.g. PI = (PI1+PI2+PI3+PI4)/4). The following table shows the results from the K-S test and Skewness and Kurtosis test. The K-S-test is more appropriate for larger sample sizes and will be applied in this study. If the significance value of the K-S-test is greater than 0.05, the data is normal. Here, the distribution is significantly different from a normal distribution (sig. <0.05). With a skewness of 0.062 (AT), -0.291 (VAL), -0.103 (TR) and -0.54, the sample data for atmosphere, customer perceived value, trust and purchase intention are approximately symmetric (Bulmer, 1979). For Kurtosis, a general guideline is that if the number is higher than +1, the distribution is too peaked; if the value is less than -1, it indicates a flat distribution (Hair et al., 2017).
Normality Test
N Mean Std. Deviation Skewness Kurtosis K-S
FQ 316 4.3911 0.82218 1.021 2.283 0.000 SQ 316 4.4373 0.88055 1.478 1.801 0.000 AT 316 4.0348 0.82974 0.062 3.343 0.000 VAL 316 4.7446 1.12089 -0.291 0.017 0.019 TR 316 4.8861 0.97691 -0.103 0.215 0.000 PI 315 5.0587 1.09252 -0.541 0.353 0.000
Table 6. Normality Test
4.5. Pearson’s Correlation
Pearson’s correlation is a measure of the strength and direction of association that exists between two variables measured. In order to determine the relationships between all variables, a Pearson’s correlation was performed. Table 7 represents the Pearson’s correlation coefficient values of all variables. Overall, it can be concluded that all correlations are positive and statistically significant (p= 0.005). Considering food quality, there is a strong correlation with purchase intention (0.115). As for service quality, it shows strong correlations with trust in the content and as for atmosphere, it strongly correlates with purchase intention (0.349) and trust in the content (0.345). The strongest correlation happens between trust in the content and customer perceived value (0.617).
Correlations FQ SQ AT TR VAL PI FQ 1 SQ -0.248 1 AT -0.018 -0.034 1 TR 0.114 0.317 0.345 1 VAL 0.045 0.360 0.268 0.617 1 PI 0.115 0.133 0.349 0.462 0.456 1 Table 7. Correlations 4.6. Hypotheses Testing
In this section, we will discuss regression analysis, which is used to assess the relationship between the dependent variables (VAL/TR) and the predictors (FQ, SQ, AT).
4.6.1. Hypotheses: H1a, H1b and H1c
To assess the association between food quality/service quality/atmosphere and customer perceived value, in which customer perceived value is the dependent variable, and food quality/service quality/atmosphere are the independent variables, a simple linear regression was performed. We considered data from three different groups: FQ (N=106), SQ (N=102) and AT (N=108).
First, we are 95% confident that food quality has a significant and positive impact on customer perceived value since the p-value equals zero. The impact is positive, because the coefficient is 0.375. In other words, for every unit increase in food quality, customer perceived value goes up by 0.375 units. Considering the value of R square, 14.7% of the variation of customer perceived value can be explained by food quality. H1a is accepted by this study.
Second, we are 95% confident that service quality has a significant and positive impact on customer perceived value since the p-value equals zero. The impact is positive, because the coefficient is 0.548. In other words, for every unit increase in service quality, customer perceived value goes up by 0.548 units. Considering the value of R square, 41.5% of the variation of customer perceived value can be explained by service quality. H1b is accepted by this study.
Third, we are 95% confident that atmosphere has a significant and positive impact on customer perceived value since the p-value equals zero. The impact is positive, because the coefficient is 0.444. In other words, for every unit increase in atmosphere, customer perceived value goes up by 0.444 units. Considering the value of R square, 30.8% of the variation of customer perceived