1
Capital structure and internationalization: the case of Portuguese industrial SMEs
Luís Pacheco
Universidade Portucalense
Departament of Economics, Management and Computer Sciences, room 201
Rua Dr. António Bernardino de Almeida, 541-619, 4200-072 Porto – Portugal
[email protected]
ABSTRACT
The central objective of this paper is to empirically examine the relationship between the capital structure of Portuguese small and medium enterprises (SMEs) and their export performance. We focus our study in the Portuguese industrial firms due to their importance for the Portuguese economy and role played in the country’s economic recovery amid the recessionary environment of the last decade. Though many empirical papers studied the determinant factors of capital structure, the interaction between export performance and capital structure has been much less studied. We intend to fill that gap, particularly for the case of Portugal and focusing on SMEs, where agency and asymmetric information problems could impact more on export performance, and not on large and listed corporations. Using panel data methodology, considering a sample of 3.164 firms and the period from 2011 to 2014, the paper extends the literature since analyzes the impact of the presence in foreign markets on short and long-term indebtedness. Distinguishing between different sectors of activity, the results suggest that profitability, asset tangibility, size, liquidity and presence in foreign markets are key factors affecting the capital structure of industrial SMEs. Albeit not validating the “upstream-downstream” hypothesis, we highlight the possible role played by agency costs and information asymmetries over debt during the internationalization process.
Key-words: Capital structure, Small-to-medium sized enterprises, Internationalization, Upstream-downstream hypothesis, Agency costs of debt, Portugal
1. Introduction
Small and medium enterprises (SMEs) are commonly referred to as the backbone of any economy and one of the main problems reported by Portuguese SMEs is how to finance their activity, being largely dependent on banks (Antão and Bonfim, 2012). SMEs play a critical role in the global economy, as suppliers of employment and key agents for local and regional communities’ well-being and the role of these firms ultimately depends on the flexibility they have to undertake entrepreneurial strategies and promote innovation.
The objective of this paper is to study the capital structure determinants of the Portuguese industrial SMEs and the way those determinants could influence their indebtedness levels. We extend the literature by
2
analyzing the determinants of short and long-term indebtedness from a sample of firms, covering the period from 2011 to 2014. Also, our paper extends the literature since we distinguish between sectors of activity and examine the interactions between internationalization and debt structure. To our knowledge, this last question has never been studied for Portuguese firms, so our paper fills that gap.
We conclude that the relation between internationalization and debt is not dependent on the destination of exports, meaning that it seems indifferent in terms of leverage whether firms are exporting to riskier or safer markets. Nevertheless, we conclude that export-oriented firms have less leverage, a negative relation possibly explained by agency theory and information asymmetries.
The next section presents an introduction to the main issues dealt in this paper and a literature review, ending with a discussion about the importance of industrial SMEs and its exports for the overall economy. Section three presents the hypothesis to be tested, the data and methodology to be used. The following section presents the empirical results, with the final section presenting a discussion of the results and some concluding remarks.
2. Literature review
Following the seminal paper from Durand (1952) about costs of capital for business, capital structure theory had its debut with a paper from Modigliani and Miller (1958) which developed a theoretical model concluding that a firm’s capital structure is irrelevant to its value, asserting that a firm consists of a set of assets representing a certain capacity to generate returns, at a certain risk that determines the cost of capital. Since Modigliani and Miller’s seminal work, capital structure decisions has been a broadly studied topic, however, given the diversity of results found in the literature, there is no consensus regarding an “optimal capital structure”, being the Myers (1984, 1993) puzzle still actual (see Ardalan, 2016, for a recent review).
The Trade-off theory (Modigliani and Miller, 1963), the Pecking Order theory (Myers and Majluf, 1984; Myers, 1977 and 1984) and the Agency costs theory (Jensen and Meckling, 1976), are the mainstream theories concerning capital structure decisions by firms. Though many studies have advanced our understanding of the determinants of a firm’s capital structure, we think that there is a lack, at least in Portugal, of firm-level analysis linking export performance and practices in terms of capital structure. This paper contributes to that research using a panel data of 3.164 Portuguese industrial SMEs for the period 2011-2014, in order to study the impact of internationalization on the capital structure of Portuguese industrial SMEs.
With respect to Portuguese firms, there is an increasing number of papers using firm-level financial data to study the capital structure determinants (some examples are Antão and Bonfim, 2012; Bartholdy and Mateus, 2011; Bartholdy, Mateus and Olson, 2015; Couto and Ferreira, 2010; Gama, 2000; Jorge and Armada, 2001; Matias, Baptista and Salsa, 2015; Nunes and Serrasqueiro, 2007; Pacheco and Tavares, 2015; Pastor and Gama, 2013; Serrasqueiro and Caetano, 2015; Serrasqueiro and Nunes, 2008, 2011 and 2012; Serrasqueiro, Nunes
3
and Armada, 2014; Vieira and Novo, 2010). Nevertheless, to the best of our knowledge the Portuguese manufacturing firms have never been studied in terms of the association between capital structure and internationalization.
2.1. Capital structure and internationalization
Due to globalization and export growth, a robust export performance is increasingly a critical factor for a firm general performance and survival. For firms, entering the export market constitutes a high-risk decision that encompasses sunk costs, revenue volatility due to exchange rate movements, limited knowledge of external market conditions, local competition and cultural assimilation. There is broad evidence that international corporate activity is one of the determinants of capital structure (Burgman, 1996; Chen, Cheng, He and Kim, 1997; Chkir and Cosset, 2001; Fatemi, 1988; Kwok and Reeb, 2000; Lee and Kwok, 1988; Low and Chen, 2004). According to the financial theory, multinational firms should have higher leverage compared to domestic firms due to their relatively larger size, stable cash flow generation and greater access to alternative and cheaper sources of financing, either domestic or abroad. Nevertheless, as explained below, most empirical results point in the opposite way.
Whether international diversification benefits a corporation and its shareholders has been the subject of considerable research. Lewellen (1971) argues that combining business with imperfectly correlated cash flows streams provides a coinsurance effect that creates more capacity for debt. While diversification may destroy value and profitability, its effect may be partially offset by an increased debt capacity and resulting tax shields. Cross border diversification appears to improve shareholder wealth (Eun, Kolodny and Scheraga, 1996), and the coinsurance effect may be a partial explanation for an increase in leverage. According to Agmon and Lessard (1977) and Fatemi (1984), international diversification reduces the expected cost of bankruptcy and allows for increased debt capacity. So, risk is reduced by portfolio effects, since foreign cash flows are not perfectly correlated (Shapiro, 1978). However, Singh, Davidson and Suchard (2003) provide evidence that while product diversified firms have higher degree of leverage relative to product focused firms, multinational corporations support a lower level of debt financing relative to domestic firms. So, firms that follow a strategy of dual diversification – product and market – tend to use more debt, a result that could be explained by the choice to use the increased debt capacity created through diversification. Nevertheless, in general, those authors conclude that multinational corporations will have lower leverage, financing their business more with equity rather than debt as the agency costs associated with the debt holder vs. stock holder conflict is likely to be a positive function of a firm’s growth opportunities.
In the context of the agency theory, non-family managers have the incentive to assume riskier projects, including increasing the firm’s presence in foreign markets (Anderson and Reeb, 2003). Since family controlled firms present higher risk aversion and concerns with survival and transmission to the next generation, the effect of the firm’s ownership structure on internationalization strategies is a relevant topic
4
(Zahra, 2003; Oesterle, Richta and Fish, 2013), though with mixed empirical evidences (Kontinen and Ojala, 2010; Sciascia et al., 2012).
According to the free cash flow hypothesis (Jensen, 1986), there’s an inverse relation between growth opportunities and debt ratios that predicts lower leverage for multinational corporations. In line with these arguments, Fatemi (1988), Burgman (1996) and Desai, Foley and Hines (2008) found that multinational corporations have lower debt ratios. Fatemi (1988) found that multinational corporations have target leverage ratios significantly below those of their domestic counterparts due to risk considerations (e.g., exchange rate risk and political risk), a conclusion shared by Burgman (1996), who concludes that higher monitoring costs imply multinational firms lower debts levels. Desai et al. (2008) found that multinational firms with above-average exposures to politically risky countries have less domestic leverage than do other firms. A similar conclusion, that firms’ international activity leads to greater risk and agency costs, was reached by Lee and Kwok (1988), Chen et al. (1997) and Kwok and Reeb (2000).
Lee and Kwok (1988) report that after controlling for size and industry related factors, multinational corporations have higher agency costs than domestic firms and that may explain why multinational corporations are less leveraged than domestic firms. Following Myers (1977), since multinational firms present higher growth opportunities, they should have higher agency costs of debt and, consequently, less leverage. Also in terms of agency costs of debt, Chen et al. (1997) argue that multinational corporations have higher bankruptcy and agency costs of debt. Also, Doukas and Pantzalis (2003) provide evidence that suggests that multinational corporations face higher agency costs of debt than domestic firms, hence leading multinational corporations to seek less long-term debt financing than domestic firms.
In this paper we are particularly interested in the alternative theory presented by Kwok and Reeb (2000), where the relationship between international diversification and capital structure is dependent on the relative risk of the multinational firm home country and the target country. This “upstream-downstream” hypothesis presented by Kwok and Reeb (2000) predicts a higher debt usage for multinational firms based on less stable economies due to risk reduction. The argument goes like this: when a firm based in a more (less) stable economy exports to a less (more) stable economy, the firm’s systematic risk should increase (decrease) because the beta of its exports market should be higher (lower) than the average beta of the firm. That increase (decrease) in risk should entail a decrease (increase) in leverage, thus, respectively, going downstream or going upstream. The authors used data from 32 countries and confirmed previous research that international diversification is positively related to leverage for emergent-market based firms.
Most of the literature on this subject has been done in the US context. Apart from the US, the main previous studies analyzing the impact of international activity on leverage were based on French (Singh and Nejadmalayery, 2004), Canadian (Mittoo and Zhang, 2008) and Brazilian (Novaes and Werlang, 1998; Saito and Hiramoto, 2010) multinational corporations.
5
Testing the “upstream-downstream” hypothesis, Singh and Nejadmalayeri (2004) found for a sample of French corporations that a higher degree of international diversification positively associates with higher total and long-term debt ratios, albeit less significant for the latter. Also, their results present a non-linear inverted U-shape relationship between the degree of international diversification and short-term debt financing. Mittoo and Zhang (2008), while examining Canadian firms, found that multinational firms have higher long-term debt ratios when compared to domestic firms. In a study comparing the capital structure of foreign subsidiaries with Brazilian national companies from 1985 to 1994, Novaes and Werlang (1998) found that foreign subsidiaries used more debt. Finally, in other empirical study for Brazilian firms, Saito and Hiramoto (2010) found that international activity is positively related to leverage, thus supporting the “upstream-downstream” hypothesis.
A general consensus of previous research therefore is that international diversification affects the capital structure of firms, although without agreeing on the direction of the relationship. However, the bulk of empirical research finds evidence consistent with the proposition that international diversification is negatively related to leverage, at least for US firms. The focus of the previous literature on US and large multinational corporations increases the importance of a similar study for Portuguese SMEs since there is this gap in the literature.
2.2. The Portuguese context
The situation of Portuguese SMEs is particularly interesting since Portuguese firms present higher levels of debt financing compared to other European firms (IMF, 2015), which implies that Portuguese corporations risk profiles may be different than the typically observed in other studies about the internationalization-leverage link.
According to the Commission Recommendation 2003/361/EC of 6th May the definition of micro, small and medium-sized enterprises is as follows:
1. The category of micro, small and medium-sized enterprises (SMEs) is made up of firms which employ fewer than 250 persons and which have an annual turnover not exceeding EUR 50 million, and/or an annual balance sheet total not exceeding EUR 43 million.
2. Within the SME category, a small enterprise is defined as a firm which employs fewer than 50 persons and whose annual turnover and/or annual balance sheet total does not exceed EUR 10 million.
3. Within the SME category, a microenterprise is defined as a firm which employs fewer than 10 persons and whose annual turnover and/or annual balance sheet total does not exceed EUR 2 million.
In spite of the harsh economic situation, with the intensification of the euro zone sovereign debt crisis, in 2013 SMEs maintained their position as the backbone of the European economy. Representing over 99% of all firms, which corresponds to about 21.6 million firms, SMEs employ approximately 88.8 million people and are
6
responsible for almost 60% of the privately generated Gross Value Added (GVA) in Europe. Also, 2 in every 3 European employees work in a SME (European Commission, 2014).
In Portugal, according to the National Statistics Office (INE, 2014), SMEs are the main drivers of employment creation and are recognized as a pillar of the national economy. In 2012, and according to INE, 99.9% of the firms were SMEs, 95.9% of which were micro-firms. Although large firms are responsible for over 40% of the turnover and GVA, SMEs account for about 78% of employment.
According to Banco de Portugal (2015), in June 2015, the Portuguese SMEs presented a global debt of €149 billion, roughly amounting to 85% of GDP (93% in December 2013). Portuguese firms meet their financial needs with nearly 50% equity. Banks provide 20% of the financing for medium-sized firms, trade credits from suppliers constitute about 12%, while other institutions and miscellaneous providers of credit account for around 15% of total financing. The remaining come from provisions and accrued expenses.
Exports have been the primary engine of the recent, albeit incipient, Portuguese economic growth. Over the period 2011-2014, Portuguese GDP contracted 6.5%, whereas exports grew at an annual rate of over 5%, preventing an even worse economic performance. According to Banco de Portugal (2015), 21% of SMEs can be considered exporting-firms, belonging 28% of them to the manufacturing sector. This sector represents almost 15% of GVA and 17% of total employment. In this paper we are going to differentiate between Portuguese SMEs exporting to European Union (EU) countries or to the rest of the world. Since the importing country can represent different kinds of risk for Portuguese firms, we expect to identify some different impacts of those two markets on capital structure.
Concerning the variable “international diversification”, studies reported in the literature use different measures to determine the degree of multinational operations. Unfortunately, a consensus is still lacking on the best or true measure of international diversification. Some possible measures are the foreign sales percentage, the foreign tax ratio, the number of countries in which the firm operates, entropy measures of the firm’s geographical diversification and composite indexes. In this paper, and due to data availability, the presence in markets outside EU is measured as the ratio of exports to countries outside EU over total sales and the presence in the EU market is measured as the ratio between exports to EU countries and total sales. Additionally, we are also going to use as a measure of internationalization the ratio of foreign sales to total sales and its square in order to test for the presence of non-linearities.
2.3. Summary: the research questions
Following the literature review made above, and focusing on the Portuguese industrial SMEs, we can now state the four main questions addressed in this paper:
7
ii) Are there significant differences between exporting firms and domestic firms with regard to the composition – short-term versus long-term debt – and the degree of financial leverage?
iii) Is the relationship between international diversification and the extent of debt financing dependent upon the destination region of exports?
iv) Are there significant differences between sectors of activity?
3. Hypothesis, data and methodology
3.1. Hypothesis
In this paper we do not intend to test the validity of the different theories about capital structure determinants. Our hypothesis will be formulated according to the principles underlying those theories in order to achieve a homogeneous exposure of the hypothesis to be tested, albeit different empirical works present some conflicting results.
Even though our paper is focused on the relation between internationalization and capital structure, we will use as control a set of six variables traditionally used in studies about capital structure determinants: profitability, assets tangibility, size, liquidity, other tax benefits and risk. In that way, we control for the major determinants of capital structure suggested in the literature.
So, in order to answer our research questions, we will define the following hypotheses: H1.1: Presence in export markets is negatively related to debt, ceteris paribus.
According to Shapiro (2013), international diversification leads to a lower volatility of earnings since the multinational firm has cash flows in imperfectly correlated markets. That leads to a reduction in bankruptcy risk and enables the firm to utilize more leverage in its capital structure. Thus, the more a firm exports, the more insurance from demand shocks it gets, and less liquidity constrained it should be. According to this, and in the light of the Trade-off theory, we should expect a positive relationship between international diversification and financial leverage. Also, according to the Pecking Order theory, if exporting firms experience rapid growth, thus having more financing needs, there should also be a positive relationship between participation in export markets and debt. In terms of empirical evidence, Shapiro (2013) corroborates this hypothesis, but Kwok and Reeb (2000) and Chkir and Cosset (2001) present different results.
In the line of Singh and Nejadmalayeri (2004), we are going to test if there is a relation between internationalization and leverage, testing also for the presence of a non-linear relation. So, we argue that firms that are more dependent and focused on the export market face higher risk and agency costs, so that will tend to present lower levels of leverage. Possibly, after a certain stage of internationalization, the relation could turn up positive, yielding a U-shaped relation (Saito and Hiramoto, 2010).
8
H1.3: Presence in the EU market is positively related to debt, ceteris paribus.
In this paper we are also going to test the “upstream-downstream” hypothesis (Kwok and Reeb, 2000), where firms that export to riskier markets (e.g., “downstream”, here meaning markets outside the European Union) have lower debt capacity. Firms that are more dependent and focused on outside EU markets face higher agency costs, so that will tend to present lower levels of leverage.
On the contrary, when firms export to safer markets (e.g., “upstream”, here meaning the EU market) its leverage increases due to the risk diversification. The greater geographic and institutional proximity with the EU markets implies lower agency costs for the firms focused on those markets, and so greater leverage. H2: Profitability is negatively related to debt, ceteris paribus.
According to the Trade-off theory more profitable firms should use more debt in order to benefit from the interest tax deduction (Modigliani and Miller, 1963), thus suggesting a positive relationship between profitability and indebtedness because firms with a greater capability to create and maintain results have a greater negotiation power and thus should be more attractive when resorting to external financing (Harris and Raviv, 1991). On the contrary, Pecking Order theory assumes that when firms need to finance, their investments have a hierarchic preference when choosing financing sources. Accumulated results are used first, then third party resources, then indebtedness and, lastly, the issuance of new stocks. More profitable firms will have better conditions to self-finance and a lower need to raise debt (Myers, 1984 and Myers and Majluf, 1984), so that the Pecking Order theory predicts a negative relationship between indebtedness and profitability. Multinational firms resort mostly to Pecking Order theory since agency conflicts between managers and shareholders are less relevant (Chen et al., 1997; Degryse, Goeij and Kappert, 2012; Low and Chen, 2004). In our study, the hypothesis is based on Pecking Order theory and we expect to obtain a negative relationship between firms’ profitability and indebtedness, like those found in the empirical studies of Antão and Bonfim (2012), Bastos and Nakamura (2009), Degryse et al. (2012), Mateev, Poutziouris and Ivanov (2013), Serrasqueiro and Nunes (2011) and Vieira and Novo (2010).
H3: Assets tangibility is positively related to debt, ceteris paribus.
According to the Trade-off theory there is a positive relationship between asset tangibility and indebtedness, where the greater the tangible asset value the greater the indebtedness level, because those act as collateral in case the firm enters a bankruptcy process (Harris and Raviv, 1991; Rajan and Zingales, 1995; Titman and Wessels, 1988). The existence of collateral reduces agency costs and the problems of information asymmetry (Jensen and Meckling, 1976; Jensen, 1986). Pecking Order theory also predicts a positive association, because firms which have collateral make their creditors feel more comfortable financing their investments and their financial costs are also lower (Myers and Majluf, 1984).
9
The main theories argue that there is a positive association between size and debt. According to the Trade-off theory, larger firms tend to be more diversified and have lower probability of bankruptcy (Ang, 1992; Cole, 2013; Titman and Wessels, 1988). Also, due to lower information asymmetry larger firms have easier access to capital markets and pay lower interest rates, thus having a greater incentive to increase their debt capital (Fama and French, 2007). Increased size also implies a greater possibility of obtaining profits, and therefore greater capacity to obtain debt for taking advantage of the debt tax shields. In contrast, Rajan and Zingales (1995), found a negative relation between size and short-term debt, since smaller firms have limited access to long-term debt.
H5: Total liquidity is negatively related to short-term debt, ceteris paribus.
A firm with high cash inflows has a low preference to use external sources of financing having thus a low leverage ratio. Accordingly, the Pecking Order theory predicts a negative relationship between liquidity and indebtedness. Payments are often financed by trade credit, which leads to increased current liabilities. Therefore, the most indebted firms have lower levels of cash (Pastor and Gama, 2013. On the contrary, Mateev et al. (2013) argue that liquidity is positively related to short-term debt.
H6: Other tax benefits besides debt are negatively related to debt, ceteris paribus.
The Trade-off theory predicts a negative relationship between Other Tax Benefits (OTB) and indebtedness. Nevertheless, Chkir and Cosset (2001), Singh et al. (2003) and Serrasqueiro and Nunes (2011) found no significant relationship between OTB and indebtedness.
H7: Risk is negatively related to debt, ceteris paribus.
SMEs are subject to considerable levels of risk due to their dimension, dependence on export markets and need to constantly innovate and survive in a highly competitive market. Also, firms are exposed to business risk due to their economic environment and management skills. According to the Trade-off theory, debt is negatively related to risk and agency costs and bankruptcy costs suggest that risk also influences the capital structure of firms (Serrasqueiro and Caetano, 2015). The Pecking Order theory also predicts a negative relationship between risk and indebtedness, since the greater the risk the greater the likelihood of the firm becoming insolvent. Therefore, risk reduces the firms’ capability to finance and increases their costs (Myers, 1984; Low and Chen, 2004).
Different indicators have been used to measure the risk variable. Several empirical studies present divergent results for the relationship between risk and indebtedness because it is difficult to define the parameters to measure that attribute since the costs of financial failure are difficult to estimate. In general, the risk of a firm is in the level of uncertainty regarding its future. This study will measure the risk variable using financial ratios, allowing us to assess how the firm finances itself and manages its ability to fulfill its non-current commitments, and to determine the dependence of the firm towards third parties, namely using the following two ratios: Solvency Ratio (SOR) and Structure Ratio (STR). The solvency ratio aims to assess the firm's ability
10
to fulfill its commitments, reflecting the risk that their lenders support, by comparing the levels of equity invested by the partners with the levels of debt capital applied by lenders. Obeying a principle of prudence, SOR should always have a value greater than or equal to one and shouldn’t have values lower than 0.5. The higher the SOR the lower is the risk and the firm will be more able to borrow. Thus, SOR should be positively related to indebtedness. Furthermore, STR, measured as the ratio between non-current liabilities and equity, should be negatively associated with indebtedness because higher values for STR are associated with higher risk for the firm so that it will be less able to get financing.
3.2. Data
In this paper we use a sample of SMEs from the industrial sectors and analyze the existence of differences between short-term and long-term indebtedness besides total indebtedness. Thus, the dependent variables are total debt (Total liabilities / Total assets) and its subdivision in short-term and long-term debt (respectively, Current Liabilities / Total Assets and Non-current Liabilities / Total Assets) and the independent variables represent the firm’s determinant factors of its capital structure and are used in order to test the previously stated hypothesis (Table 1).
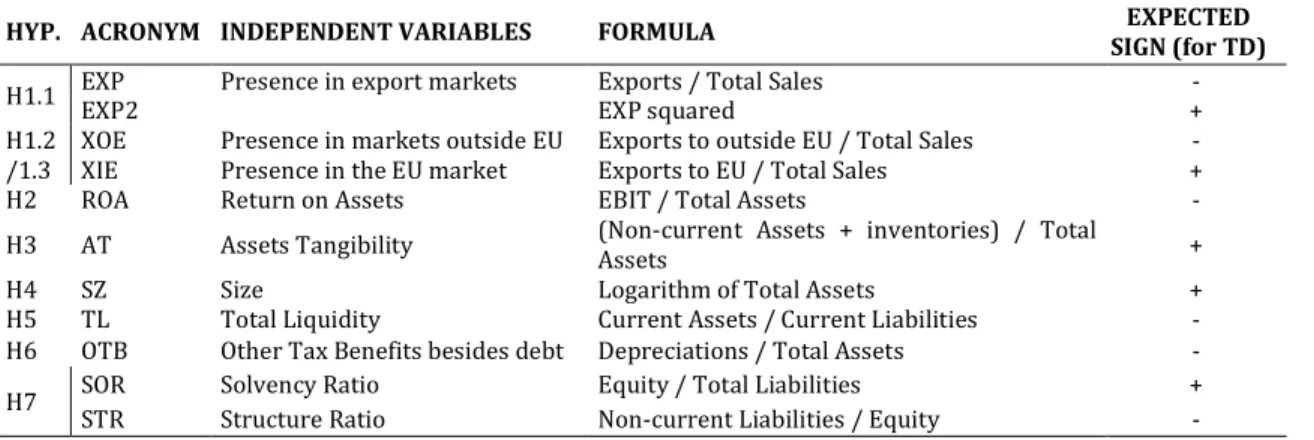
Table 1 – Independent variables and expected signs
HYP. ACRONYM INDEPENDENT VARIABLES FORMULA EXPECTED
SIGN (for TD)
H1.1 EXP Presence in export markets Exports / Total Sales -
EXP2 EXP squared +
H1.2 XOE Presence in markets outside EU Exports to outside EU / Total Sales -
/1.3 XIE Presence in the EU market Exports to EU / Total Sales +
H2 ROA Return on Assets EBIT / Total Assets -
H3 AT Assets Tangibility (Non-current Assets + inventories) / Total
Assets +
H4 SZ Size Logarithm of Total Assets +
H5 TL Total Liquidity Current Assets / Current Liabilities -
H6 OTB Other Tax Benefits besides debt Depreciations / Total Assets -
H7 SOR Solvency Ratio Equity / Total Liabilities +
STR Structure Ratio Non-current Liabilities / Equity -
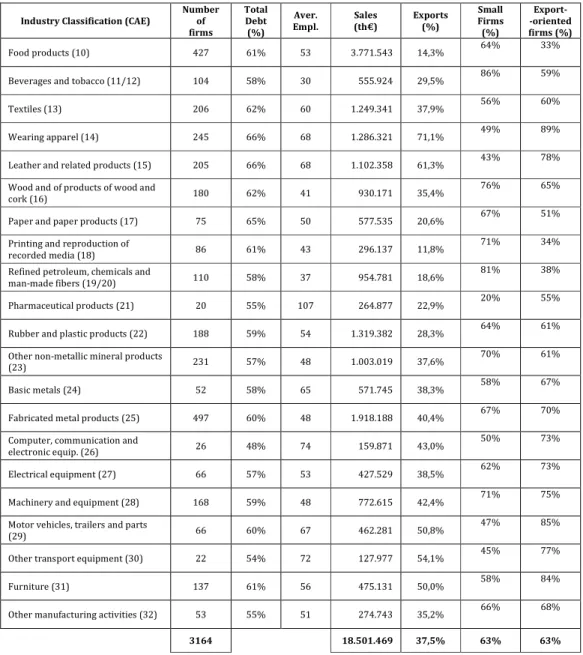
After the identification of the hypothesis to be tested as well as the dependent and independent variables, it is necessary to describe the data collection process for the sample characterization over which our empirical study will be made. Our objective is to analyze a sample of SMEs from the industrial sectors (CAEs 10 to 32), obtained from SABI, a financial database powered by Bureau van Dijk. Applying the criteria for SMEs definition and excluding firms with less than 10 employees because micro firms tend to present gaps in terms of data and potential anomalous values, considering only firms with a 4 year period of complete data from 2011 to 2014 and excluding firms with debt ratios above 100% or negative or liabilities greater than assets, we obtained a balanced panel data of 3.164 SMEs. Table 2, presents a detailed description of our sample. The sample accounts for 168.017 employees, a turnover near 18.500 M€ and total assets of 20.000 M€ in 2014. The sample has two thirds of small firms (2.002) and one third of medium firms (1.162) and all relevant sectors are represented.
11
Table 2 – Distribution of the sample by industry classifications
Industry Classification (CAE)
Number of firms Total Debt (%) Aver. Empl. Sales (th€) Exports (%) Small Firms (%) Export- -oriented firms (%) Food products (10) 427 61% 53 3.771.543 14,3% 64% 33%
Beverages and tobacco (11/12) 104 58% 30 555.924 29,5% 86% 59%
Textiles (13) 206 62% 60 1.249.341 37,9% 56% 60%
Wearing apparel (14) 245 66% 68 1.286.321 71,1% 49% 89%
Leather and related products (15) 205 66% 68 1.102.358 61,3% 43% 78%
Wood and of products of wood and
cork (16) 180 62% 41 930.171 35,4%
76% 65%
Paper and paper products (17) 75 65% 50 577.535 20,6% 67% 51%
Printing and reproduction of
recorded media (18) 86 61% 43 296.137 11,8%
71% 34%
Refined petroleum, chemicals and
man-made fibers (19/20) 110 58% 37 954.781 18,6%
81% 38%
Pharmaceutical products (21) 20 55% 107 264.877 22,9% 20% 55%
Rubber and plastic products (22) 188 59% 54 1.319.382 28,3% 64% 61%
Other non-metallic mineral products
(23) 231 57% 48 1.003.019 37,6%
70% 61%
Basic metals (24) 52 58% 65 571.745 38,3% 58% 67%
Fabricated metal products (25) 497 60% 48 1.918.188 40,4% 67% 70%
Computer, communication and
electronic equip. (26) 26 48% 74 159.871 43,0%
50% 73%
Electrical equipment (27) 66 57% 53 427.529 38,5% 62% 73%
Machinery and equipment (28) 168 59% 48 772.615 42,4% 71% 75%
Motor vehicles, trailers and parts
(29) 66 60% 67 462.281 50,8%
47% 85%
Other transport equipment (30) 22 54% 72 127.977 54,1% 45% 77%
Furniture (31) 137 61% 56 475.131 50,0% 58% 84%
Other manufacturing activities (32) 53 55% 51 274.743 35,2% 66% 68%
3164 18.501.469 37,5% 63% 63%
Note: Small firms are firms with less than 50 employers and export-oriented firms are firms which export more than 10% of its total sales. Sectors 11/12 and 19/20 are aggregated since the sample only comprises a very small number of firms in sectors 11 and 19.
In terms of ownership structure, firms in the sample are generally family businesses, where there is not a separation between ownership and control, with a small proportion of independent directors at the board. Nevertheless, the association between ownership structure and internationalization is not considered here. Differentiating between export-oriented firms and the others, Table 2 considers that firms that make more than 10% of their sales abroad are export-oriented. Considering that threshold our sample has 1.171 domestic-oriented firms and 1.993 export-oriented firms (63%).
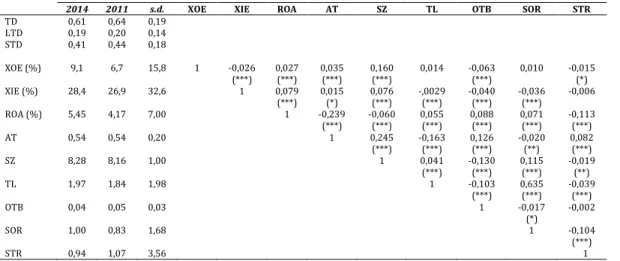
Before estimating the different models we present some descriptive statistics of the variables. As can be seen in Table 3, in recent years, the indebtedness levels decreased slightly but firms present a deterioration in ROA, though presenting some improvements in liquidity and solvency rations. Firms in the sample export 37.5% of
12
their sales and, in the considered period, firms increased slightly their exports for EU countries and for markets outside the EU.
Table 3 – Descriptive statistics (average and standard deviation) and correlation matrix between independent variables
2014 2011 s.d. XOE XIE ROA AT SZ TL OTB SOR STR
TD 0,61 0,64 0,19 LTD 0,19 0,20 0,14 STD 0,41 0,44 0,18 XOE (%) 9,1 6,7 15,8 1 -0,026 0,027 0,035 0,160 0,014 -0,063 0,010 -0,015 (***) (***) (***) (***) (***) (*) XIE (%) 28,4 26,9 32,6 1 0,079 0,015 0,076 -,0029 -0,040 -0,036 -0,006 (***) (*) (***) (***) (***) (***) ROA (%) 5,45 4,17 7,00 1 -0,239 -0,060 0,055 0,088 0,071 -0,113 (***) (***) (***) (***) (***) (***) AT 0,54 0,54 0,20 1 0,245 -0,163 0,126 -0,020 0,082 (***) (***) (***) (**) (***) SZ 8,28 8,16 1,00 1 0,041 -0,130 0,115 -0,019 (***) (***) (***) (**) TL 1,97 1,84 1,98 1 -0,103 0,635 -0,039 (***) (***) (***) OTB 0,04 0,05 0,03 1 -0,017 -0,002 (*) SOR 1,00 0,83 1,68 1 -0,104 (***) STR 0,94 1,07 3,56 1
Note: s.d. is the standard deviation. * p < 0,10; ** p < 0,05; *** p < 0,01;
Table 3 also presents the correlation matrix of the variables used in this paper. According to Gujarati and Porter (2008), when the correlation coefficients are above 50%, the problem of collinearity becomes significant. Observing the correlation coefficients between the independent variables only in one circumstance the correlation coefficient is above 50%, therefore the problem of collinearity between explanatory variables will not be particularly relevant.
3.3. Methodology
In order to attain our research objective we apply a panel data methodology, which presents several advantages, namely better effects’ detection and measurement, minimization in sample bias and control of individual heterogeneity (Gujarati and Porter, 2008). Panel data can be estimated trough three different regression models: Pooled Ordinary Least Squares (POLS), Fixed Effects Model (FEM) and Random Effects Model (REM). Applying the Wald, Breusch-Pagan and Hausman tests we will choose the most appropriate regression technique. First, comparing between POLS and FEM, the Wald test states the null hypothesis of the constant terms being all equal. Under the null hypothesis, the efficient estimator is the POLS model, indicating the non existence of a specific effect for each one of the firms. After, the Breusch-Pagan test compares between POLS and REM, where the rejection of the null hypothesis indicates that REM is more appropriate. Finally, the Hausman test compares REM with FEM, where under the null hypothesis the efficient estimator is the REM. If we reject the null hypothesis, the FEM is more appropriate, since the REM would yield biased results.
In order to test the different hypothesis, we perform the following regressions, one for each debt variable (TD, LTD and STD):
13
Yi,t = β1 + β2 XOEi,t + β3 XIEi,t + β4 ROAi,t + β5 ATi,t + β6 SZi,t + β7 TLi,t + β8 OTBi,t + β9 SORi,t + β10 STRi,t + εi,t Where: Yi,t – Dependent variable (TD, LTD and STD) for the i-th firm in year t;
β – Coefficient to estimate;
Xi,t – Independent variable for the i-th firm in year t; εi,t – Error describing the non-explained effects on Yi,t.
In the beginning all nine independent variables (Xi) were included but after chosen the most appropriate model the regression was repeated with only the determinants of debt that showed up first as statistically significant.
4. Empirical results
4.1. Results for the complete sample
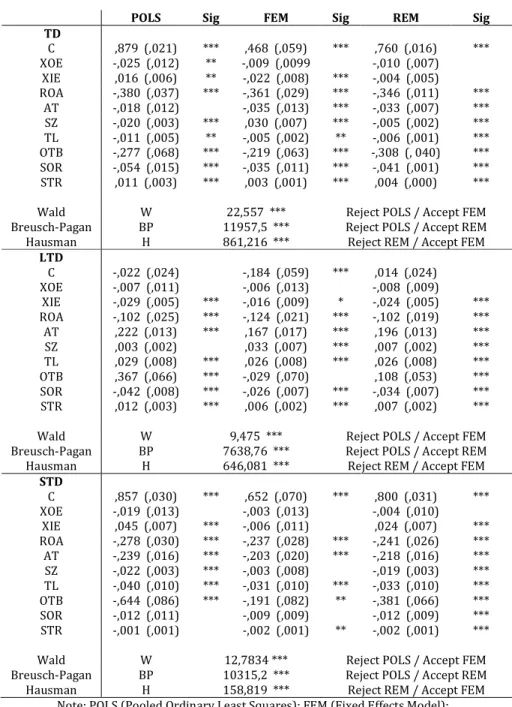
Table 3 presents the results obtained for Pooled OLS (POLS), Fixed Effects Model (FEM) and Random Effects Model (REM) and the different tests to choose the appropriate model. According to the Wald and Breusch-Pagan tests we always reject the Pooled OLS model and according to the Hausman test we reject the random effects model, indicating that the fixed effects model is more efficient.
Since the tests reveal that the results under FEM have better explanatory power compared to results under POLS or REM, we estimate again the fixed effects model but removing the variables that showed up as not significant in the previous estimation (OTB for long-term debt and SZ and SOR for short-term debt). The only exceptions are the variables XOE and XIE, since one of the main objectives of this paper is to test the “upstream-downstream” hypothesis. In Table 4 we add also the results for the variables EXP, calculated as the sum of XOE and XIE, meaning the ratio of foreign sales to total sales, and EXP2, that is equal to EXP square (following Saito and Hiramoto, 2010). This reinterpretation of the “upstream-downstream” hypothesis argues that firms that are more dependent and focused on the export market face higher agency costs and information asymmetries, so that will tend to present lower levels of leverage. The second variable tests for the presence of a non-linear relationship between internationalization and leverage. Table 4 presents the results obtained for TD, LTD and STD, where the significant coefficients that present the expected signs are presented in bold.
14
Table 3 – Regression Models: Total Indebtedness (TD), Long-term Indebtedness (LTD) and Short-term indebtedness (STD)
POLS Sig FEM Sig REM Sig
TD C ,879 (,021) *** ,468 (,059) *** ,760 (,016) *** XOE -,025 (,012) ** -,009 (,0099 -,010 (,007) XIE ,016 (,006) ** -,022 (,008) *** -,004 (,005) ROA -,380 (,037) *** -,361 (,029) *** -,346 (,011) *** AT -,018 (,012) -,035 (,013) *** -,033 (,007) *** SZ -,020 (,003) *** ,030 (,007) *** -,005 (,002) *** TL -,011 (,005) ** -,005 (,002) ** -,006 (,001) *** OTB -,277 (,068) *** -,219 (,063) *** -,308 (, 040) *** SOR -,054 (,015) *** -,035 (,011) *** -,041 (,001) *** STR ,011 (,003) *** ,003 (,001) *** ,004 (,000) ***
Wald W 22,557 *** Reject POLS / Accept FEM
Breusch-Pagan BP 11957,5 *** Reject POLS / Accept REM
Hausman H 861,216 *** Reject REM / Accept FEM
LTD C -,022 (,024) -,184 (,059) *** ,014 (,024) XOE -,007 (,011) -,006 (,013) -,008 (,009) XIE -,029 (,005) *** -,016 (,009) * -,024 (,005) *** ROA -,102 (,025) *** -,124 (,021) *** -,102 (,019) *** AT ,222 (,013) *** ,167 (,017) *** ,196 (,013) *** SZ ,003 (,002) ,033 (,007) *** ,007 (,002) *** TL ,029 (,008) *** ,026 (,008) *** ,026 (,008) *** OTB ,367 (,066) *** -,029 (,070) ,108 (,053) *** SOR -,042 (,008) *** -,026 (,007) *** -,034 (,007) *** STR ,012 (,003) *** ,006 (,002) *** ,007 (,002) ***
Wald W 9,475 *** Reject POLS / Accept FEM
Breusch-Pagan BP 7638,76 *** Reject POLS / Accept REM
Hausman H 646,081 *** Reject REM / Accept FEM
STD C ,857 (,030) *** ,652 (,070) *** ,800 (,031) *** XOE -,019 (,013) -,003 (,013) -,004 (,010) XIE ,045 (,007) *** -,006 (,011) ,024 (,007) *** ROA -,278 (,030) *** -,237 (,028) *** -,241 (,026) *** AT -,239 (,016) *** -,203 (,020) *** -,218 (,016) *** SZ -,022 (,003) *** -,003 (,008) -,019 (,003) *** TL -,040 (,010) *** -,031 (,010) *** -,033 (,010) *** OTB -,644 (,086) *** -,191 (,082) ** -,381 (,066) *** SOR -,012 (,011) -,009 (,009) -,012 (,009) *** STR -,001 (,001) -,002 (,001) ** -,002 (,001) ***
Wald W 12,7834 *** Reject POLS / Accept FEM
Breusch-Pagan BP 10315,2 *** Reject POLS / Accept REM
Hausman H 158,819 *** Reject REM / Accept FEM
Note: POLS (Pooled Ordinary Least Squares); FEM (Fixed Effects Model); REM (Random Effects Model). Standard-deviations presented in brackets. * p<0,10; ** p<0,05; *** p<0,01
Hypothesis 1 - Presence in export markets
Testing the “upstream-downstream” hypothesis (left panel of Table 4) we can observe, in general, that a greater prevalence of exports to riskier markets (outside the EU) is not associated with leverage, so that the “downstream” idea is not validated. Also, the “upstream” side is not validated. Specifically, concerning total debt the presence in the European Union market is associated with less leverage. Unlike Kwok and Reeb
15
(2000), who found a significant relationship between international diversification and leverage, we fail to obtain any significant relation, a result also obtained by Low and Chen (2004). Also, replacing the variables XOE and XIE by dummy variables characterizing the export-oriented firms yielded similar results, that is, the absence of a clear relation between export destination markets (ex-EU or EU) and debt. One possible reason for the insignificance of linear coefficients may be that the actual relationship between financial leverage and international diversification may be non-linear. Other reason may be that some of the control variables are proxying for international diversification. To ensure that this insignificance is not due to imposing a linear function on a non-linear relationship, in the right panel of Table 4 we replaced the variables XOE and XIE by their sum, yielding the ratio of foreign sales to total sales and also include the square of that variable in order to detect non-linearities. Now we can observe for total and long term debt a significant negative relation, meaning that export-oriented firms have less leverage, possibly due to the greater financing difficulties resulting from the increased level of risk or due to the higher risk-aversion and survival/loss of control concerns of family businesses, seeking to reduce financial risk (Zahra, 2005; Vieira, 2014). This result contradicts Singh and Nejadmalayeri (2004), but supports previous research by Fatemi (1988), Singh et al. (2003) and Doukas and Pantzalis (2003). Also, the variable EXP2 has a positive sign, though being only significant for long-term debt. This yields an interesting U-shaped relation between internationalization and long-term debt. According to Singh et al. (2003), exporting firms have less leverage, nevertheless, as they increase their degrees of international diversification, they send a signal to the market about the sustainability of their operations, allowing them to increase their debt levels.
Hypothesis 2 - Profitability
In our study ROA presents always the expected negative sign relative to TD, LTD and STD, validating the Pecking Order theory. Singh et al. (2003), Mittoo and Zhang (2008), Chkir and Cosset (2001) and specifically in the Portuguese context, Vieira and Novo (2010), Serrasqueiro and Nunes (2011), Antão and Bonfim (2012) and Serrasqueiro and Caetano (2015) are some of the authors that also found a negative relationship, suggesting that SMEs follow a hierarchy in choosing sources of financing, giving preference to retained earnings, and only in case of their insufficiency, firms resort to debt.
16 Table 4 – Regression (Fixed Effects Model):
Total Indebtedness (TD), Long-term Indebtedness (LTD) and Short-term indebtedness (STD)
COEFFICIENT Sig. COEFFICIENT Sig.
TD TD C ,468 (,059) *** C ,469 (,059) *** XOE -,009 (,009) EXP -,037 (,018) ** XIE -,022 (,008) *** EXP2 ,022 (,019) ROA -,361 (,029) *** ROA -,361 (,029) *** AT -,035 (,013) *** AT -,035 (,013) *** SZ ,030 (,007) *** SZ ,030 (,007) *** TL -,005 (,002) ** TL -,005 (,002) ** OTB -,219 (,063) *** OTB -,220 (,063) *** SOR -,035 (,011) *** SOR -,035
(,011) *** STR ,003 (,001) *** STR ,003 (,001) *** R2 ,94 ,94 R2 within ,30 ,30 F 43,79 *** 43,79 *** DW 1,28 1,28 LTD LTD C -,189 (,056) *** C -,189 (,056) *** XOE -,006 (,013) EXP -,043 (,020) ** XIE -,016 (,009) * EXP2 ,035 (,020) * ROA -,124 (,021) *** ROA -,124 (,021) *** AT ,167 (,017) *** AT ,167 (,017) *** SZ ,034 (,006) *** SZ ,034 (,006) *** TL ,026 (,008) *** TL ,026 (,008) *** SOR -,026 (,007) *** SOR -,026 (,007) *** STR ,006 (,002) *** STR ,006 (,002) *** R2 ,85 ,85 R2 within ,21 ,21 F 16,48 *** 16,49 *** DW 1,48 1,48 STD STD C ,624 (,024) *** C ,624 (,024) *** XOE -,006 (,014) EXP ,004 (,022) XIE -,008 (,011) EXP2 -,012 (,023) ROA -,247 (,029) *** ROA -,247 (,)029 *** AT -,207 (,020) *** AT -,207 (,020) *** TL -,033 (,009) *** TL -,033 (,009) *** OTB -,182 (,080) ** OTB -,181 (,080) ** STR -,002 (,001) ** STR -,002 (,001) ** R2 ,88 ,88 R2 within ,22 ,22 F 21,48 *** 21,48 *** DW 1,44 1,44
Note: Standard-deviations presented in brackets. * p<0,10; ** p<0,05; *** p<0,01; DW = Durbin-Watson
Hypothesis 3 - Assets Tangibility
Since assets are accepted as collateral, a positive relationship between assets tangibility and indebtedness is expected. The observed relation with TD is statistically significant though with a negative sign. Nevertheless, tangible assets, as mentioned earlier, can affect long and short-term financing differently. For LTD and STD we obtained significant results, respectively, positive and negative signs, as expected by the Pecking Order theory. Singh and Nejadmalayeri (2004), Mittoo and Zhang (2008), Couto and Ferreira (2010) and Antão and Bonfim
17
(2012) also found that asset value positively influences the level of indebtedness, concluding that the higher the asset value, the higher would be the level of credit granted. Serrasqueiro and Nunes (2011) and Vieira and Novo (2010), concluded that there is a negative relationship between tangible assets and short-term debt. Probably, SMEs turn above all to short-term debt and so guarantees associated with tangible assets are not required by creditors.
Hypothesis 4 - Size
Larger firms are more able to obtain long-term debt, due to their lower risk, lower probability of bankruptcy and lower financing costs. On the other hand, for short-term debt a negative relationship could be present, indicating that smaller firms rely more on short-term debt since their internal funds are insufficient to finance growth. There are several studies finding a positive relationship between size and total debt, not only for larger firms but also for SMEs. In this study, the SZ variable showed a significant positive relationship with total and long-term debt, a result that confirms a large number of previous papers (e.g., Gama, 2000; Low and Chen, 2004; Fama and French, 2007; Mittoo and Zhang, 2008; Couto and Ferreira, 2010; Saito and Hiramoto, 2010; Vieira and Novo, 2010; Serrasqueiro and Nunes, 2011; Matias et al., 2015; Serrasqueiro and Caetano, 2015). In terms of short-term debt the size variable though with a negative sign was not significant, a result also found by Jorge and Armada (2001) and Vieira and Novo (2010).
Hypothesis 5 - Total Liquidity
Our results show a negative sign with LTD, confirming the Pecking Order theory, so that firms with low levels of liquidity face higher risks of bankruptcy and tend to have a preference for debt. This negative sign was also found by Low and Chen (2004), Antão and Bonfim (2012) and Pastor and Gama (2013).
Hypothesis 6 - OTB
The Trade-off theory predicts a negative relationship between Other Tax Benefits (OTB) and indebtedness, a relation justified by the fact that firms with more depreciations and provisions should reduce the level of debt in their financial structure. As for OTB, the variable was considered only in the TD and STD estimations, being significant and displaying the expected negative sign. Thus, we confirm the Trade-off theory, a result which differs from authors such as Chkir and Cosset (2001), Singh et al. (2003), Mittoo and Zhang (2008), Serrasqueiro and Nunes (2011), Matias et al. (2015) and Serrasqueiro and Caetano (2015) who did not found a significant relationship between OTB and indebtedness.
Hypothesis 7 - Risk
To measure risk two independent variables (SOR and STR) were used. Thus, for risk to be negatively associated with TD, LTD and STD, it is expected that SOR and STR have, respectively, positive and negative signs. However, according to the results for total and long-term debt, it can be concluded that risk is positively related with debt. These results, although contradicting the two theories, are in line with the results previously obtained by Vieira and Novo (2010) and Serrasqueiro and Caetano (2015). So, firms with higher risk, which
18
have more debt, may see their agency costs reduced and probably surpass the expected increase in bankruptcy costs. Also confirming the results of Vieira and Novo (2010), we found a negative relationship between risk and short-term debt.
4.2. Results for the different sectors of activity
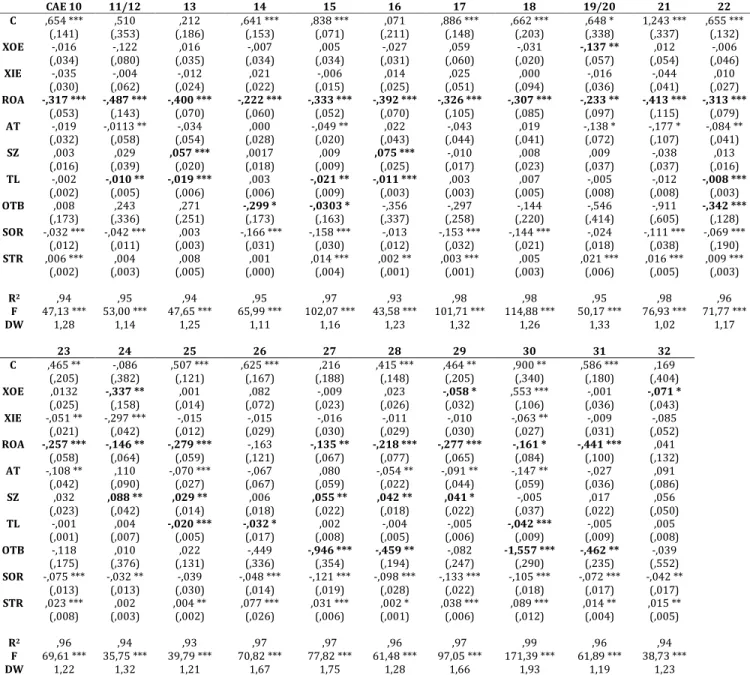
Some prior studies show industry to be a significant determinant of capital structure. So, we now repeat the analysis distinguishing between sectors of activity, with Table 5 presenting the results estimated trough a Fixed Effects Model (FEM). Due to space availability we only present results for total debt, being the results for long-term and short term debt available upon request. The significant coefficients that present the expected sign are presented in bold.
Analyzing Table 5, and considering all the significant results that display the expected sign, we confirm that profitability is the main determinant of leverage in almost all manufacturing sectors, with a secondary role played by liquidity, size and other tax benefits besides debt. The presence in export markets outside the EU is a significant variable with the expected sign only in four sectors, whereas the presence in the EU market is significantly associated with leverage in only three sectors, though with a negative sign. So, we can conclude that the destination of exports does not influence total debt and that regarding this issue there are not significant differences between sectors of activity. Also, replacing the variables XOE and XIE by EXP and EXP2 the results are quite similar, with only four sectors (10; 11/12; 24 and 27), presenting a significant negative sign for EXP, with two of them also presenting a significant positive sign for EXP2. Though those results are not presented here, distinguishing between short-term and long-term indebtedness the results point to the significance of liquidity, asset tangibility and profitability in explaining short-term debt, whereas concerning long-term debt the most relevant variables are asset tangibility and size. Here also the internationalization variables are of minor importance, with XOE presenting only in four occasions a significant negative sign (in contrast, it presents a significant positive sign in other four occasions) and regarding the variable XIE, only in two occasions it presents a significant sign, albeit negative. Nevertheless, using EXP and EXP2 to test for non-linearities, we found seven sectors with a significant U-shape relation between internationalization and long-term debt (sectors 10, 11/12, 17, 18, 21, 23 and 32). Notice that in comparison to the entire sample these sectors globally present a lower than average number of export-oriented firms.
19
Table 5 – Regression (Fixed Effects Model) for the different manufacturing sectors: Total debt
CAE 10 11/12 13 14 15 16 17 18 19/20 21 22 C ,654 *** ,510 ,212 ,641 *** ,838 *** ,071 ,886 *** ,662 *** ,648 * 1,243 *** ,655 *** (,141) (,353) (,186) (,153) (,071) (,211) (,148) (,203) (,338) (,337) (,132) XOE -,016 -,122 ,016 -,007 ,005 -,027 ,059 -,031 -,137 ** ,012 -,006 (,034) (,080) (,035) (,034) (,034) (,031) (,060) (,020) (,057) (,054) (,046) XIE -,035 -,004 -,012 ,021 -,006 ,014 ,025 ,000 -,016 -,044 ,010 (,030) (,062) (,024) (,022) (,015) (,025) (,051) (,094) (,036) (,041) (,027) ROA -,317 *** -,487 *** -,400 *** -,222 *** -,333 *** -,392 *** -,326 *** -,307 *** -,233 ** -,413 *** -,313 *** (,053) (,143) (,070) (,060) (,052) (,070) (,105) (,085) (,097) (,115) (,079) AT -,019 -,0113 ** -,034 ,000 -,049 ** ,022 -,043 ,019 -,138 * -,177 * -,084 ** (,032) (,058) (,054) (,028) (,020) (,043) (,044) (,041) (,072) (,107) (,041) SZ ,003 ,029 ,057 *** ,0017 ,009 ,075 *** -,010 ,008 ,009 -,038 ,013 (,016) (,039) (,020) (,018) (,009) (,025) (,017) (,023) (,037) (,037) (,016) TL -,002 -,010 ** -,019 *** ,003 -,021 ** -,011 *** ,003 ,007 -,005 -,012 -,008 *** (,002) (,005) (,006) (,006) (,009) (,003) (,003) (,005) (,008) (,008) (,003) OTB ,008 ,243 ,271 -,299 * -,0303 * -,356 -,297 -,144 -,546 -,911 -,342 *** (,173) (,336) (,251) (,173) (,163) (,337) (,258) (,220) (,414) (,605) (,128) SOR -,032 *** -,042 *** ,003 -,166 *** -,158 *** -,013 -,153 *** -,144 *** -,024 -,111 *** -,069 *** (,012) (,011) (,003) (,031) (,030) (,012) (,032) (,021) (,018) (,038) (,190) STR ,006 *** ,004 ,008 ,001 ,014 *** ,002 ** ,003 *** ,005 ,021 *** ,016 *** ,009 *** (,002) (,003) (,005) (,000) (,004) (,001) (,001) (,003) (,006) (,005) (,003) R2 ,94 ,95 ,94 ,95 ,97 ,93 ,98 ,98 ,95 ,98 ,96 F 47,13 *** 53,00 *** 47,65 *** 65,99 *** 102,07 *** 43,58 *** 101,71 *** 114,88 *** 50,17 *** 76,93 *** 71,77 *** DW 1,28 1,14 1,25 1,11 1,16 1,23 1,32 1,26 1,33 1,02 1,17 23 24 25 26 27 28 29 30 31 32 C ,465 ** -,086 ,507 *** ,625 *** ,216 ,415 *** ,464 ** ,900 ** ,586 *** ,169 (,205) (,382) (,121) (,167) (,188) (,148) (,205) (,340) (,180) (,404) XOE ,0132 -,337 ** ,001 ,082 -,009 ,023 -,058 * ,553 *** -,001 -,071 * (,025) (,158) (,014) (,072) (,023) (,026) (,032) (,106) (,036) (,043) XIE -,051 ** -,297 *** -,015 -,015 -,016 -,011 -,010 -,063 ** -,009 -,085 (,021) (,042) (,012) (,029) (,030) (,029) (,030) (,027) (,031) (,052) ROA -,257 *** -,146 ** -,279 *** -,163 -,135 ** -,218 *** -,277 *** -,161 * -,441 *** ,041 (,058) (,064) (,059) (,121) (,067) (,077) (,065) (,084) (,100) (,132) AT -,108 ** ,110 -,070 *** -,067 ,080 -,054 ** -,091 ** -,147 ** -,027 ,091 (,042) (,090) (,027) (,067) (,059) (,022) (,044) (,059) (,036) (,086) SZ ,032 ,088 ** ,029 ** ,006 ,055 ** ,042 ** ,041 * -,005 ,017 ,056 (,023) (,042) (,014) (,018) (,022) (,018) (,022) (,037) (,022) (,050) TL -,001 ,004 -,020 *** -,032 * ,002 -,004 -,005 -,042 *** -,005 ,005 (,001) (,007) (,005) (,017) (,008) (,005) (,006) (,009) (,009) (,008) OTB -,118 ,010 ,022 -,449 -,946 *** -,459 ** -,082 -1,557 *** -,462 ** -,039 (,175) (,376) (,131) (,336) (,354) (,194) (,247) (,290) (,235) (,552) SOR -,075 *** -,032 ** -,039 -,048 *** -,121 *** -,098 *** -,133 *** -,105 *** -,072 *** -,042 ** (,013) (,013) (,030) (,014) (,019) (,028) (,022) (,018) (,017) (,017) STR ,023 *** ,002 ,004 ** ,077 *** ,031 *** ,002 * ,038 *** ,089 *** ,014 ** ,015 ** (,008) (,003) (,002) (,026) (,006) (,001) (,006) (,012) (,004) (,005) R2 ,96 ,94 ,93 ,97 ,97 ,96 ,97 ,99 ,96 ,94 F 69,61 *** 35,75 *** 39,79 *** 70,82 *** 77,82 *** 61,48 *** 97,05 *** 171,39 *** 61,89 *** 38,73 *** DW 1,22 1,32 1,21 1,67 1,75 1,28 1,66 1,93 1,19 1,23
Note: Standard-deviations presented in brackets. * p<0,10; ** p<0,05; *** p<0,01; DW = Durbin-Watson
In sum, concerning the traditional determinants of capital structure, there seems to be no significant differences between sectors of activity, a result also found by Low and Chen (2004). In contrast, concerning the internationalization variables, some differences appear between sectors, justifying further research. We return to this issue in the last section.
Finally, and before the concluding section, Table 6 presents a comparison between the expected and observed relationships, were we can validate the different hypotheses that were tested in this empirical study.
20 Table 6 – Expected and Observed Relations
EXPLANATORY VARIABLES
EXPECTED RELATION OBSERVED RELATION HYPOTHESIS
VALIDATED? TD LTD STD TD LTD STD H1 XOE - - - NS NS NS … XIE + + + - NS NS EXP - - - + YES EXP2 + + + NS + - H2 ROA - - - YES H3 AT + + - - + - YES H4 SZ + + - + + NS YES H5 TL - - - - + - YES H6 OTB - - - - NS - YES H7 SOR + + + - - NS … STR - - - + + -
Note: “+” – Positive Relation; “-” – Negative Relation; NS – Non Significant.
5. Discussion and conclusions
Some prior research on the exporting firms capital structure shows puzzling evidence that export-oriented firms have lower levels of leverage than their domestic peers. Two major hypotheses have been offered: agency costs of debt and upstream-downstream. Those hypotheses have been tested in different country samples and time periods, being this paper the first to test them with Portuguese firms.
This paper explores the determinant factors behind the capital structure of the Portuguese industrial SMEs. We constructed a balanced sample of 3164 industrial SMEs obtained from the SABI database for a period of 4 years, between 2011 and 2014, and used panel data methodology. The traditional profitability, tangibility, dimension, liquidity, other tax benefits besides debt and risk were used as determinant factors of the capital structure, but a special attention was given to the presence in foreign markets and its relationship with total, long-term and short-term indebtedness. Also, differences between sectors of activity were studied.
The results indicate that profitability, asset tangibility, size, total liquidity and other tax benefits besides debt are important determinants of leverage. Profitability showed a negative relationship with debt in accordance with the Pecking Order theory, suggesting that the most profitable firms should use more debt in order to take advantage of the interest tax deductibility. In general, the other control variables showed the expected signs, validating the Pecking Order theory. Notice that, in terms of the risk variables, we conclude that firms’ total and long-term indebtedness is associated with factors representative of business solvency and structure (SOR and STR). However, the signs are contrary to the expected and predicted from both the main theories, suggesting that riskier companies continue to be financed by lenders in order to avoid bankruptcy and of course the losses implied by bankruptcy costs. Such anomalous behavior could be justified by the general undercapitalization registered by Portuguese SMEs. This puzzle highlights the importance of further research. One of the main objectives of this paper was to test the “upstream-downstream” hypothesis, nevertheless we reject it, concluding that the relation between internationalization and debt is not dependent on the destination of exports, meaning that it seems indifferent in terms of leverage whether firms are exporting to
21
riskier markets (ex-EU) or safer markets (EU). Nevertheless, albeit not validating that hypothesis, we conclude that export-oriented firms have less leverage, a negative relation possibly explained by agency theory, since firms international activity leads to greater risk and agency costs, reducing the access to credit. Also, in terms of long-term debt, the relation between internationalization and debt is U-shaped, that is, after a certain degree of presence in foreign markets firms seem to be able to surpass initial difficulties tending to increase their levels of debt. In terms of short-term debt the inverse seems to occur, with some signs of an inverse-U shape. So, the internationalization process seems to begin with an increase in short-term debt, being difficult to finance long-term due to agency costs and information asymmetries, and after the firm entered in a more mature stage it begins to increase the maturity of its financing. We also found that this kind of relationship is more relevant in certain sectors of activity. In terms of policy implications, our results support the argument for improving access to credit (possibly government backed) to exporting firms in their initial stages of internationalization, allowing them to grow and diversify its activities.
Regarding the four main questions addressed in this paper, we can answer that: i) internationalization impacts leverage, being the sign of that relationship dependent upon the maturity of debt; ii) there are not significant differences between exporting firms and domestic firms with regard to the composition – short-term versus long-term debt – and the degree of financial leverage; iii) additionally, the relationship between international diversification and the extent of debt financing does not depend upon the destination region of exports; iv) and, finally, there are not relevant differences between sectors of activity.
Our results provide some insights to characterize the Portuguese manufacturing firms’ capital structure but also call for further research. For instance, the exporting firms’ capital structure determinants only partially explain the changes in debt. So, that suggests that the debt levels of the different firms not only depends of mainly financial factors but also depends of factors inherent to organizational behavior. So, further research should, inter alia, (i) introduce qualitative variables, for instance, consider problems in terms of access to credit and capture the role played by firm-bank relationships and consider factors such as the quality of management and the organizational characteristics or the ownership structure of the firms; (ii) research in what extent product diversification is also an important factor affecting capital structure and consider cost of capital issues; (iii) further research the relationship between international diversification and capital structure, covering a longer period in order to obtain more insights for the complete business cycle. Finally, we expect further research could give a final answer to the “upstream-downstream” hypothesis.
In summary, the results of this paper allow us to conclude that the Pecking Order and Agency Costs theories are not mutually exclusive in explaining the capital structure of Portuguese industrial SMEs. Globally speaking, Pecking Order theory seems more suited, but the different sectors are not homogeneous and in terms of internationalization agency costs seem rather present.
22 REFERENCES
Agmon, T., Lessard, D., 1977. Investor recognition of corporate international diversification. Journal of Finance 32(4), 1049-1055. DOI: 10.1111/j.1540-6261.1977.tb03308.x.
Anderson, R., Reeb, D., 2003. Fouding-family ownership and firm performance: Evidence from the S&P500. Journal of Finance 58(3), 1321-1328. DOI: 10.1111/1540-6261.00567
Ang, J., 1992. On the theory of finance for privately held firms. Journal of Small Business Finance 1(3), 185-203. Antão, P., Bonfim, D., 2012. The dynamics of capital structure decisions. Working Paper. Economics and Research Department. Banco de Portugal, Lisboa.
Ardalan, K., 2016. Capital theory reconsidered. Research in International Business and Finance, in press. DOI 10.1016/j.ribaf.2015.11.010.
Banco de Portugal. 2015. Análise das Empresas do Setor Exportador em Portugal. Estudos da Central de Balanços, 22, June.
Bartholdy, J., Mateus, C., 2011. Debt and taxes for private firms. International Review of Financial Analysis 20(3), 177-189. DOI: 10.1016/j.irfa.2011.02.012.
Bartholdy, J., Mateus, C., Olson, D., 2015. Do Portuguese private firms follow pecking order financing?. European Journal of Finance 21(10–11), 848–866. DOI: 10.1080/1351847X.2012.706815.
Burgman, T.A., 1996. An empirical examination of multinational corporate capital structure. Journal of International Business Studies 27(3), 553-570.
Chen, C., Cheng, C., He, J., Kim, J., 1997. An investigation of the relationship between international activities and capital structure. Journal of International Business Studies 28(3), 563-577.
Chkir, I., Cosset, J., 2001. Diversification strategy and capital structure of multinational corporations. Journal of Multinational Financial Management 11, 17-37, DOI: 10.1016/S1042-444X(00)00040-2.
Cole, R. A., 2013. What do we know about the capital structure of privately held US firms? Evidence from the surveys of small business finance. Financial Management 42(4), 777-813, DOI: 10.1111/fima.12015.
Couto, G., Ferreira, S., 2010. Os determinantes da estrutura de capital de empresas do PSI-20. Revista Portuguesa e Brasileira de Gestão 9(1-2), 26-38.
Degryse, H., Goeij, P., Kappert, P., 2012. The impact of firm and industry characteristics on small firms’ capital structure., Small Business Economics 38(4), 431-447, DOI: 10.1007/s11187-010-9281-8.
Desai, M., Foley, C., Hines Jr., J., 2008. Capital structure with risky foreign investment. Journal of Financial Economics 88(3), 534-553. DOI: 10.2139/ssrn.902489.
Doukas, J., Pantzalis, C., 2003. Geographic diversification and agency costs of debt of multinational firms. Journal of Corporate Finance 9(1), 59-92. DOI: 10.1016/S0929-1199(01)00056-6.
Durand, D., 1952. Costs of debt and equity funds for business: trends and problems of measurement, in: Conference on Research in Business Finance, National Bureau of Economic Research, 215-262.
23
Eun, C., Kolodny, R., Scheraga, C., 1996. Cross-border acquisitions and shareholder wealth: Tests of the synergy and internationalization hypotheses. Journal of Banking and Finance 20, 1559-1582. DOI: 10.1016/S0378-4266(96)00013-1
Fama, E., French, K., 2007. The anatomy of value and growth stock returns. Financial Analysts Journal 63(6), 44-54. DOI: 10.2469/faj.v63.n6.4926.
Fatemi, A., 1984. Shareholder benefits from corporate international diversification. Journal of Finance 39, 1325-1344. DOI: 10.1111/j.1540-6261.1984.tb04910.x.
Fatemi, A., 1988. The effect of international diversification on corporate financing policy. Journal of Business Research 16(1), 17–30. DOI: 10.1002/tie.5060300101.
Gama, A., 2000. Os determinantes da estrutura de capital das PME’s industriais Portuguesas. Instituto Mercado de Capitais, Porto.
Gujarati, D., Porter, D., 2008. Basic Econometrics, 5th edition. McGraw-Hill/Irwin.
Harris, M., Raviv, A., 1991. The theory of capital structure. Journal of Finance 46(1), 297-355. DOI:10.1111/j.1540-6261.1991.tb03753.x.
International Monetary Fund, 2015. Global Financial Stability Report. World Economic and Financial Surveys, April.
Jensen, M., 1986. Agency costs of free cash flow, corporate finance and takeover. American Economic Review 76, 323-329.
Jensen, M., Meckling, W., 1976. Agency costs and the theory of the firm. Journal of Financial Economics 3(4), 305-360.
Jorge, S., Armada, R., 2001. Fatores determinantes do endividamento: uma análise em painéis. Revista de Administração Contemporânea 5(2), 9-31. DOI: 10.1590/S1415-65552001000200002.
Kontinen, T., Ojala, A., 2010. The internationalization of family businesses: A review of extant research. Journal of Family Business Strategy 1(2), 97-107. DOI: 10.1016/j.jfbs.2010.04.001.
Kwok, C., Reeb, D., 2000. Internationalization and firm risk: an upstream-downstream hypothesis. Journal of International Business Studies 31(4), 611-629. DOI: 10.1057/palgrave.jibs.8490925.
Lee, K., Kwok, C., 1988. Multinational corporations vs. domestic corporations: international environmental factors and determinants of capital structure. Journal of International Business Studies 19(2), 195-217. Lewellen, W., 1971. A pure financial rationale for the conglomerate merger. Journal of Finance 26, 521-537. Low, P., Chen, K., 2004. Diversification and capital structure: some international evidence. Review of Quantitative Finance and Accounting 23, 55-71. DOI: 10.1023/B:REQU.0000037064.15144.04.
Mateev, M., Poutziouris, P., Ivanov, K., 2013. On the determinants of SME capital structure in Central and Eastern Europe: A dynamic panel analysis. Research in International Business and Finance 27(1), 28-51. DOI:10.1016/j.ribaf.2012.05.002.