Contents lists available atScienceDirect
Journal of Archaeological Science: Reports
journal homepage:www.elsevier.com/locate/jasrepMedieval Tuscan glasses from Miranduolo, Italy: A multi-disciplinary study
Ivona Posedi
a,⁎, Zsófia Kertész
b, Pedro Barrulas
a, Vittorio Fronza
c, Nick Schiavon
a, José Mirão
a aHERCULES Laboratory, University of Évora, Largo Marques do Marialva 8, 7000-809 Évora, PortugalbInstitute for Nuclear Research, Hungarian Academy of Sciences, Bem tér 18/c., P.O. Box 51, Debrecen 4026, Hungary cDepartment of Historical Sciences and Cultural Heritage, University of Siena, Via Roma 56, Italy
A R T I C L E I N F O Keywords: Archaeometry Archaeovitreology Glass studies Medieval glass VP-SEM-EDS PIXE/PIGE LA-ICP-MS A B S T R A C T
Twenty transparent glass fragments from Miranduolo were analysed by Variable Pressure - Scanning Electron Microscopy - Energy Dispersive System (VP-SEM-EDS), Particle Induced X-Ray Emission and Particle Induced Gamma-Ray Emission (PIXE/PIGE) and Laser Ablation - Inductively Coupled Plasma - Mass Spectrometry (LA-ICP-MS). The fragments are dated from mid-13th to mid-14th century CE, when the first Tuscan glass-making workshops emerged. Miranduolo did not have an in situ glass-making workshop. Hence, the aim was to de-termine the glass production technology and raw material provenance. All the glasses are of plant ash (PA) soda-lime-silica (Na-Ca-Si) composition, with eighteen being made with Levantine plant ash (LPA), one with Barilla plant ash (BPA), and one Na-Ca-Si glass with high magnesium and low potassium (HMg-LK). The production of LPA glasses can be distinguished according to the use of different sand typologies as former. It seems probable that glasses were produced regionally from multiple Tuscan glass factories.
1. Introduction
Medieval Tuscany is rich in archaeological remains and artefacts that were owned by aristocratic families (Valenti, 2008). From the beginning of the Medieval period, the hilltop villages - especially those of central Italy – were newly built by the rural aristocracy, using the labour of peasants and accumulating agricultural goods. These sites turned into castles mostly during the 10th – early 11th century, as a result of a slow formation process (Valenti, 2008;Fronza and Valenti, 2015). Miranduolo is a castle whose residents were involved in agricultural and metallurgical industry. Since the 13th century the historical Valdesa (Siena) was important for the establishment of glass-making (Cagno et al., 2010;Basso et al., 2009; Cagno et al., 2008). Germagnana, San Vettore and Santa Cristina in the territory of Gambassi were leading workshops of the period. The glass-making and glass-working products were discovered in situ and were chemically analysed (Cagno et al., 2010;Casellato et al., 2003;Bianchin et al., 2005a;Bianchin et al., 2005b;Brianese et al., 2005). Besides Tus-cany, the glass-making in Ligurian region was getting stronger at the time, while Venice had one of the most influential glass-making productions in Europe (Cagno et al., 2010;Cagno et al., 2012a;Verità, 2013).
1.1. Archaeological context
Miranduolo castle (Castello di Miranduolo) is a multi-layered
medieval hill-top site (7th to 14th century CE with eight occupation periods) located on the Castagnoli slope in the Municipality of Chiusdino, Province of Siena, Tuscany region, Italy. More precisely, 3.9 km air distance south-southwest from Chiusdino and 7 km air dis-tance south-west from the San Galgano Abbey. The extension of the 12th and 13th century site is around 4650 m2, of which 3900 m2are occupied by the village area with peasants huts, metallurgical factory, church and cemetery and 750 m2are taken up by the summit area (cassero, Area 1) with the palace of the ruling noble family (Fig. 1, Table 1) (Valenti, 2008;Valenti, 2010;Castello di Miranduolo, n.d.).
Miranduolo castle was one of the centres in the region of historical Val di Merse, which was located between Siena and Volterra dioceses. Its location was important as the road, heading to the Tyrrhenian coast, crossed the Val di Merse. Besides the important geographical position, the area is rich with ore deposits of iron oxides, sphalerite, chalcopyrite and galena. Miranduolo itself, on the other hand, was erected in top of iron and copper minerals veins deposits (Valenti, 2008;Valenti, 2010). In written sources, Miranduolo is defined as a castle for the first time in 1004, marking the final step of a gradual transition process to territorial sovereignty, expressed through severe investments that in-cluded building actions and physical protection by constructing de-fensive walls at the end of the 11th century. Comparing to the previous occupation periods, the life of the village was on decline during mid-13th to mid-14th century (Period II). Possibly, during the second half of
https://doi.org/10.1016/j.jasrep.2019.101878
Received 6 March 2019; Received in revised form 12 May 2019; Accepted 4 June 2019
⁎Corresponding author at: School of History and Heritage, University of Lincoln, Brayford Pool, Lincoln LN6 7TS, UK.
E-mail address:[email protected](I. Posedi).
2352-409X/ © 2019 Elsevier Ltd. All rights reserved.
the 13th century, the site was used as a getaway residence of the Cantieri noble family (Valenti, 2008;Valenti, 2010).
1.2. Aims
The Period II (ca. 1250–1350 CE) tableware glasses were chosen for this study since it is the period when local Tuscan glass-making fac-tories start to be established (Cagno et al., 2010; Basso et al., 2009; Cagno et al., 2008;Cagno et al., 2012b).
Hence, the aim was to determine:
◊ the glass production technology including the chemical composi-tion, the use of decolourants and extent of recycling
◊ which glass-making workshops could have acted as probable sup-pliers of glass as no in situ workshop has been found at Miranduolo ◊ the presence of any socio-economic relevance connected to the
chemical composition of the Miranduolo glass fragments
2. Experimental
2.1. Samples and sampling strategy
Twenty transparent glass fragments from Period II were selected for
this study (Table 1) (Reperti vitrei Castello di Miranduolo, n.d.). The fragments were sampled by the principle of having a complete sequence of diverse colours representing all three phases in each single excava-tion area. The glasses analysed come from five excavaexcava-tion areas: 1 (cassero), 8, 9, 10 and 11 (Table 2, Fig. 1). The colours range from various hues of green, yellow to aqua and colourless. The fragments were classified as cups, bowls, bottles, closed forms, while some frag-ments were too small and could not be identified (Table 2).
Macroscopically, air bubbles are visible in all the samples. The preservation state of the glasses can be generally defined as very well preserved. Sample MD 191 shows a slight iridescence effect, while MD 139 and MD 259 show a strong iridescence effect and heavy flaking. The walls of the vessels were sampled, except in the case of MD 173, MD 191 and MD 276 which are ring bottoms of the cups (Table 2).
After being photographed, the samples were dry cut, set in epoxy resin blocks and polished.
2.2. VP-SEM-EDS
Variable Pressure – Scanning Electron Microscopy – Energy Dispersive Spectroscopy (VP-SEM-EDS) was used to evaluate the homogeneity of the pristine glass and the presence and intensity of glass deterioration (de-alkalisation). Additionally, these results are semi-quantitative and aided in selection of glass certified reference materials for quantification of results by PIXE/PIGE and LA-ICP-MS. Cross-sec-tions embedded in epoxy resin were analysed with a HITACHI S3700N VP-SEM equipped with a Bruker AXS X-Flash® 5010 Silicon Drift Detector (126 eV Spectral Resolution at MnKα Full Maximum Half Width FMHW) for EDS. The use of VP-SEM eliminates carbon coating need and it is less time consuming. Quantitative standardless PB/ZAF elemental analysis was made using the Bruker ESPRIT 1.9 software. The operating conditions for SEM-EDS analysis were: backscattered electron
Fig. 1. Representation of the excavated areas at Miranduolo. Analysed glass fragments come from areas marked in italics. Satellite image viawww.maps.google.hr. Table 1
Periodisation of Miranduolo's Period II (Valenti, 2008).
Period II
Phase I ca 1250–1278 CE
Phase II ca 1278–1333 CE
Table 2
Sample specifications. ni = not identified.
Sample Colour Type Phase Area Part sampled Glass thickness (μm) Corrosion thickness (μm)
MD12 Green Cup 3 1 Body 484 ni
MD21 Green Bowl 2 2 Body 1110 ni
MD24 Colourless Ni 2 1 Body 5260 2.25
MD66 Yellow Cup 2 1 Body 981 ni
MD67 Amber ni 2 1 Body 1320 ni
MD139 Aqua Cup 3 1 Body 1930 136–500
MD143 Aqua Cup 1 1 Body 702 26.8
MD172 Yellow-Green Bottle 2 9 Body 3120 ni
MD173 Yellow Cup 2 9 Ring foot 2850 ni
MD191 Yellow-Green Cup 1 8 Ring foot 5140–6000 ni
MD193 Yellow ni 1 8 Body 727 ni
MD222 Green ni 1 8 Body 1660 ni
MD231 Yellow Cup 1 1 Body 1400 ni
MD243 Green Bowl 1 10 Body 1410 ni
MD256 Yellow ni 1 10 Body 830 ni
MD257 Green ni 1 10 Body 1230 ni
MD259 Colourless Cup 3 8 Bottom 349 17.01
mode (BSEM), pressure 40 Pa, 20 kV accelerating voltage, 10–14 mm working distance. An area measurement per sample was performed for 60 s in real time. The data are presented as oxides in weight percent (wt %).
2.3. PIXE/PIGE
The Particle Induced X-Ray Emission and Particle Induced Gamma-Ray Emission (PIXE/PIGE) analysis was carried out at MTA Atomki, Debrecen, Hungary at the scanning nuclear microprobe installed on the 0° beamline of the 5 MV Van de Graaff accelerator (Brianese et al., 2005). The measurement setup included four detectors. For PIXE two X-Ray detectors were placed at 135ogeometry to the incidence beam: an SDD detector with AP3.3 ultra-thin polymer window (SGX Sensortech) with 30 mm2active surface area for measurement of low and medium energy X-rays (0.2–12 keV, Z > 5); a Gresham type Be-window Si(Li) X-ray detector with 30 mm2active surface area equipped with an ad-ditional kapton filter of 125 μm thickness for measurement of medium and high energy X-rays (3–30 keV, Z > 19). For PIGE a Canberra HPGe 40% gamma-Ray detector was placed at 45owith respect to the in-cidence beam direction and 11 cm distance from the sample, outside the vacuum chamber. The accumulated charge was monitored using a beam chopper equipped with a collimated PIN diode.
All the signals of the detectors were recorded event by event in list mode by the Oxford type OMDAQ data acquisition system. A detailed description of the measurement setup can be found in (Simon et al., 2011).
A proton beam of 3.2 MeV focused down to ~5 μm × 5 μm with a current of 50–100 pA was applied to irradiate the samples. On each sample measurements were carried out on 2–4 spots with a size of 1 mm × 1 mm by scanning the beam on the sample. Firstly, elemental maps on the aforementioned 1 mm × 1 mm areas were recorded, and if there was a necessity, a homogeneous area was selected for further measurements. The accumulated charge on each spot was 0.1–0.15 μC. In the case of samples MD 139, MD 143 and MD 259 that display corrosion layers, further maps of the corrosion layer were recorded with a scan size adjusted to the size of the corrosion layer.
To test the quality and the precision of the dose measurement and of the quantification measurements were carried out on standard re-ference materials (SRM) The calibration of the beam chopper was done at the same time. The SRMs included NIST 610, Corning A and Corning B glasses (Inline Supplementary Table S1), a series of pure metals and a layered sample of 6 μm thick Ti foil on 50 μm Ni (Wagner et al., 2012; Trace Elements (wafer form), n.d.;Brill, 1999a).
The evaluation of the PIXE spectra was done with the GUPIXWIN software (Campbell et al., 2010) Samples were treated as thick samples. Firstly, the matrix composition was determined from the SDD detector spectra using the iterative matrix solution method. Afterwards, the spectra recorded by the Be-window Si(Li) X-ray detector were analysed in trace mode, implementing the previously obtained matrix and the
measured irradiation dose. In the 3.0–8.5 keV range there are the in-tensive X-ray lines such as K Kα, Ca Kα, Ti Kα, Fe Kα which were common for both detectors, therefore these were used for elemental concentration normalization, if it was necessary. Generally, the differ-ence between the concentrations obtained independently for the two PIXE detectors was < 5%.
Besides evaluating the spectra of the individual measurement areas spectra measured on the same sample were summed in order to reduce the detection limits. This way the detection limits (MDL) were reduced by 30–50% comparing to the MDL of the spectra corresponding to a one-point analysis. By measuring in several points, the homogeneity of the samples was also investigated.
The analytical uncertainty of PIXE (including the fitting process uncertainty) for major elements was ~2–5%, while for minor and trace elements ~10–15%. The data is presented as oxides in wt% or as ele-ments expressed in ppm.
Since the information depth of PIXE for light elements is only few micrometres, particle induced gamma emission (PIGE) was used to gather information about the concentration of Na and Mg from the deeper layers of the glass. NIST 610 and Corning A were used as cali-bration standards (Wagner et al., 2012; Trace Elements (wafer form), n.d.;Brill, 1999a).
The concentration obtained from PIGE was in a very good agree-ment (within uncertainty) with the PIXE results, showing homogeneity down to 100 μm.
2.4. LA-ICP-MS
No further sample preparation was required as laser ablation mode was used. The ablation was performed by Cetac Technologies LSX-213 G2+ coupled with Agilent 8800 Triple Quadrupole Instrument. Instrument specifications and conditions are presented inTable 3.
The PIXE/PIGE provided the silica concentration that was converted into SiO2and used as internal standard for the quantification process by Laser Ablation – Inductively Coupled Plasma – Mass Spectrometry (LA-ICP-MS).
The data evaluation for glass standard materials included the cal-culation of average, recovery (%) and drift (%). Recoveries of 90–110%, and a drift ≤10% were accepted as a result that did not require any corrections.
Each measurement campaign consisted of 3 spot analyses for each glass standard material and 4 spot analyses for glass samples. Between 8 and 12 glass sample measurements, three replicates of the certified references materials were performed in order to check for any potential instrumental drift.
NIST 610 and 612 were used as CRM's (Inline Supplementary Table S1) (Trace Elements (wafer form), n.d.). Mg, P, K, Ti, Mn, Zn, Sr and Ba were calculated using NIST 610 due to their higher concentrations. Remaining elements were quantified using NIST 612. Major and minor elements were normalised to 100 wt% in oxides.
Table 2 (continued)
Sample Colour Type Phase Area Part sampled Glass thickness (μm) Corrosion thickness (μm)
MD261 Aqua ni 3 11 Body 1020 ni
MD272 Amber Cup 3 11 Body 1250 ni
3. Results
3.1. Homogeneity
Both VP-SEM-EDS and PIXE/PIGE analyses determined that all Miranduolo samples are homogeneous (Fig. 2). This was further con-firmed by LA-ICP-MS as the data of four points of the same sample did not show compositional discrepancies. The samples thickness varies due to different parts of the container were sampled (Table 2).
The thinnest sample was blown to 350 μm. The glass blower would need to have experience of couple of decades in order to blow the glass this thin. There are no inclusions nor frequent presence of air bubbles. Only four samples display corrosion layers.
3.2. Classification and nomenclature
All glasses have soda-lime-silica (Na-Ca-Si) composition as de-termined by all three analytical techniques (Inline Supplementary Table S1). The K2O and MgO concentrations are above 1.5 wt% and classify Miranduolo glasses as plant ash (PA) Na-Ca-Si glasses. The origin of plant ash glasses can be determined according to the K2O concentra-tion. Glasses with 1.5 < K2O < 4.5 wt% are assumed to be made with Levantine plant ash (LPA) (Cagno et al., 2008). Barilla plant ash (BPA) was used when 4.5 < K2O < 8 wt% (Cagno et al., 2008; Vandini et al., 2018). The plant ashes could have been purified which would include the treatment with boiling water (Cagno et al., 2008;Casellato et al., 2003). The precipitated salts were less soluble and the original CaO and MgO content diminished (Cagno et al., 2008;Casellato et al., 2003). Hence, Cagno et al. (2008) indicate the distinction between purified and impurified PA according to the CaO concentration. Glasses containing CaO < 7 wt% indicate the use of purified ashes, and glasses with CaO > 7 wt% have impurified plant ashes added as a flux (Cagno et al., 2008).
To avoid creating new terminology and for these purposes only, Cagno et al. (2008)terminology for purified and impurified plant ashes will be continuously used throughout the paper.
3.2.1. Glass sub-groups
The differences in the CaO concentrations between the techniques need to be highlighted because CaO is used a classifying discriminant. The CaO values by PIXE/PIGE are generally lower than the VP-SEM-EDS and LA-ICP-MS (Inline Supplementary Table S1). This could be a reflectance of the methodology used: PIXE/PIGE has a different depth of analysis, spot size and different sensitivity for detecting lighter ele-ments than VP-SEM-EDS and LA-ICP-MS (Janssens, 2013;Pollard and Heron, 2008). Because the recovery of calcium values was more precise with LA-ICP-MS than PIXE/PIGE, and EDS being semi-quantifying, the distinction between purified and impurified plant ashes throughout this paper will be based on and LA-ICP-MS data (Fig. 3). The analysis de-termined that eighteen Miranduolo glasses are made from LPA: im-purified and im-purified (Fig. 3). One glass is made with BPA (Fig. 3). MD 139 is classified as High Magnesium – Low Potassium Na-Ca-Si glass (HMg-LK) due to K2O < 1.5 wt% and MgO > 1.5 wt% (Fig. 3). This sub-group has only been acknowledged by Franjić (Franjić, 2018) and it is not often encountered. It is generally overseen such as on Roman La Négade (sample 2, LN, pu, v) (Henderson, 1988), early medieval and high medieval sites of Piazza Bovio, Napoli (sample v12) (De Francesco et al., 2014), San Genesio (sample 52) (Cagno et al., 2012b), Rocca di Campiglia (sample t_63) (Cagno et al., 2010), Savona (sample 4121) (Cagno et al., 2012a), Nogara (samples OF6a, OR3, PR2b, PR5) (Silvestri and Marcante, 2011) and Cordoba, Spain (samples COR1,
Table 3
LA-ICP-MS instrument specifications and analysis conditions. Laser system
Manufacturer and
model Cetac Technologies LSX-213 G2 + Laser type Q-switched Nd:YAG laser
Wavelength 213 nm
Repetition rate (Hz) 20
Ablation mode Single-spot (600 shots) Carrier gas (flow rate) Helium (1 L/min) Pre-ablation time (s) 15 Ablation time (s) 30 Wash out (s) 10 Beam diameter (μm) 50 Spectrometer Manufacturer and
model Agilent 8800 Triple Quadrupole
RF power (W) 1550
Argon dilution gas (L/
min) 0.7
Argon plasma gas (L/
min) 15
Sample depth (mm) 4
Mode MS/MS
Dwell time (ms)
-isotopes 5 –
23Na,24Mg,27Al,28Si,39K,44Ca,56Fe
10 –43Ca,47Ti,52Cr,55Mn,57Fe,59Co,60Ni,63Cu,66Zn, 75As,85Rb,88Sr,89Y,90Zr,118Sn
20 –31P,51V,93Nb,121Sb,137Ba,139La,140Ce,141Pr, 146Nd,147Sm,153Eu,147Gd,159Tb,163Dy, 165Ho, 166Er,169Tm,172Yb,175Lu,178Hf,208Pb,232Th,238U Data processing software
Glitter v 4.4.2 Certified standards NIST 610 and NIST 612
COR14, COR18 and COR24) (Duckworth et al., 2015).
The difference in average composition of impurified and purified LPA glasses is notable as well as the difference in the Na2O/K2O and K2O/CaO (Inline Supplementary Table S1).
3.3. Different plant ashes or different sands as raw materials?
The basic glass recipe seems to be in accordance with other Italian glasses (Brianese et al., 2005;Verità, 2013;Brill, 1999a;Vandini et al., 2018;Schibille and Freestone, 2013;Brill, 1999b;Brill and Pongracz, 2004) (Figs. 4, 5). The purified LPA glasses with CaO < 7 wt% and Sr ≤ 420 ppm have a constant MgO concentration between 1.5 and 1.8 wt%. Therefore, the MgO concentration could be an indication of plant purification process.
The analysis of plant ashes (Barkoudah and Henderson, 2008) has proven the existence of strong positive correlation of K2O - CaO and K2O - MgO, CaO - Ba, MgO - Ba, K2O - Ba and CaO - MgO in Salsola plant ashes. The non-Salsola plant ashes only have moderate positive correlation of K2O - MgO and CaO - Ba.
Miranduolo's impurified LPA glasses display the following: ◊ no correlation of K2O - MgO, K2O - Ba
◊ a moderate positive correlation of K2O - CaO and CaO - Ba ◊ a strong positive relationship between CaO - Mg and MgO - Ba.
Therefore, this could indicate that
◊ both Salsola and non-Salsola plant ashes were added to the melt ◊ the calcium content is related to the silica source or to an intentional
adding of calcium source in form of shell fragments or limestone, and not to the plant ashes
◊ a combination of both types of plant ashes was mixed with calcium rich sands.
The high calcium content (10.6–14.2 wt%) of the sands have been found in the region at La Casina La Cava quarry near Gambassi (Casellato et al., 2003). This sand was, experimentally, been washed and both heavier and lighter parts chemically analysed. The heavier part of the washed sand has sufficiently lower amount of magnesium (0.6 wt%) and higher amount of calcium (14.2 wt%) comparing to the lighter part (1.7 wt% and 10.6 wt%) (Casellato et al., 2003).
Strontium behaves related to calcium in most geochemical en-vironments. In impurified LPA the strontium is higher than in the purified LPA (Table 4).
Hence, it seems possible that the sand purification process by washing it with water, could have had an impact on the compositional differences. To understand if this sand was used to make Miranduolo glasses trace element analysis of the sand would be necessary. 3.4. Minor and trace elements
3.4.1. The extent of recycling
The extent of recycling is usually displayed by showing elevated concentrations of Pb, Cu, Zn, Sb, Sn (> circa 100 ppm) (Silvestri and Marcante, 2011).
Miranduolo glasses do not show these tendencies. Exceptions are: ◊ MD 172 with Cu and Pb > 100 ppm;
◊ MD 257 with Cu, Sb and Cu > 100 ppm;
◊ MD 256 with Cu, Zn, Sb, Pb > 100 ppm (Table 4).
Fig. 3. The distinction of four Miranduolo soda-lime-silica glass subgroups based on LA-ICP-MS data in wt%.
Fig. 4. Ternary plot of CaO - MgO + K2O - Na2O of 13th–14th century glasses in wt% (LA-ICP-MS).
Fig. 5. Ternary plot of Al2O3-TiO2-Fe2O3of 13th–14th century glasses in wt% (LA-ICP-MS).
Table 4
LA-ICP-MS data. Oxides are represented in wt% and elements as ppm. Glass group Sample Colour Type Phase Area Part
sampled Glassthickness μm
Corrosion thickness μm
Na2O MgO Al2O3 SiO2 P2O5 K2O CaO TiO2 MnO Fe2O3
BPA MD 243 Green bowl 1 10 Body 1410 nd 11.7 2.73 2.87 62.1 0.76 7.08 9.83 0.17 1.05 1.77
HMg-LK MD 139 Aqua cup 3 1 Body 1930 136–500 14.8 4.45 3.25 62.6 0.57 1.46 11.5 0.11 0.08 1.14
Impurified LPA MD 12 Green cup 3 1 Body 484 nd 13.2 5.66 4.37 61.2 0.64 2.94 10.6 0.11 0.12 1.10
Impurified LPA MD 21 Green bowl 2 2 Body 1110 nd 12.4 5.42 5.28 60.4 0.64 3.84 10.6 0.14 0.15 1.13
Impurified LPA MD 24 Colourless nd 2 1 Body 5260 2.25 17.4 1.91 2.21 66.1 0.31 2.64 7.39 0.12 0.78 1.14
Impurified LPA MD 66 Yellow cup 2 1 Body 981 nd 16.4 2.81 2.66 63.0 0.60 2.67 9.55 0.11 0.85 1.29
Impurified LPA MD 143 Aqua cup 1 1 Body 702 26.8 13.3 4.87 4.66 63.0 0.51 2.42 10.0 0.10 0.16 0.98
Impurified LPA MD 173 Yellow cup 2 9 Ring foot 2850 nd 12.7 2.36 2.39 70.0 0.41 2.40 8.43 0.09 0.40 0.86 Impurified LPA MD 191 Yellow-Green cup 1 8 Ring foot 5140–6000 nd 16.3 1.93 2.16 66.3 0.45 2.81 7.90 0.10 0.92 1.16 Impurified LPA MD 231 Yellow cup 1 1 Body 1400 nd 14.2 2.47 3.97 65.7 0.54 2.87 8.30 0.14 0.97 0.85
Impurified LPA MD 257 Green nd 1 10 Body 1230 nd 18.3 2.47 3.81 63.2 0.30 2.25 6.84 0.26 1.20 1.43
Impurified LPA MD 259 Colourless cup 3 8 Bottom 349 17.0 15.3 3.40 1.55 64.4 0.25 3.02 11.3 0.10 0.33 0.41 Impurified LPA MD 272 Amber cup 3 11 Body 1250 nd 15.5 3.44 2.44 66.4 0.47 1.95 7.83 0.13 0.96 0.94 Impurified LPA MD 276 Green cup 1 11 Ring foot 15,000 nd 16.6 1.97 3.10 65.8 0.38 2.93 7.33 0.14 0.92 0.87
Purified LPA MD 67 Amber nd 2 1 Body 1320 nd 22.1 1.68 3.91 64.2 0.28 1.93 2.75 0.29 0.82 2.08
Purified LPA MD 172 Yellow-Green bottle 2 9 Body 3120 nd 18.7 1.69 3.23 65.1 0.34 2.70 5.60 0.20 0.87 1.57
Purified LPA MD 193 Yellow nd 1 8 Body 727 nd 17.2 1.62 3.88 67.1 0.25 2.43 5.02 0.27 0.55 1.72
Purified LPA MD 222 Green nd 1 8 Body 1660 nd 16.4 1.53 3.24 68.8 0.25 2.27 5.28 0.19 0.61 1.41
Purified LPA MD 256 Yellow nd 1 10 Body 830 nd 15.5 1.76 3.31 67.6 0.46 3.95 5.21 0.24 0.77 1.19
Purified LPA MD 261 Aqua nd 3 11 Body 1020 nd 19.0 1.51 3.58 64.9 0.22 1.79 6.70 0.21 0.83 1.30
Sample V Cr Co Ni Cu Zn As Rb Sr Y Zr Nb Sn Sb Ba MD 243 21 23 7 19 72 133 4 27 493 7 110 3 8 19 162 MD 139 17 19 6 18 31 73 4 10 590 7 43 3 9 2 108 MD 12 16 20 6 18 39 94 2 26 607 7 49 3 11 1 240 MD 21 18 23 7 19 31 102 3 39 594 9 72 4 8 2 276 MD 24 16 15 5 14 46 65 5 11 456 6 83 3 16 20 145 MD 66 18 16 6 21 47 80 5 16 519 7 56 3 9 15 171 MD 143 14 17 7 16 26 74 3 29 554 8 59 3 16 1 241 MD 173 13 13 4 11 52 56 4 10 473 5 58 3 5 72 159 MD 191 19 17 5 12 55 64 4 10 511 5 48 3 10 3 96 MD 231 19 18 6 20 109 77 4 16 497 8 72 4 8 38 170 MD 257 30 29 7 20 132 69 4 16 523 11 203 6 23 110 175 MD 259 11 12 10 9 16 32 3 17 467 5 81 2 3 1 243 MD 272 19 21 7 19 27 74 4 8 518 5 62 3 3 1 271 MD 276 19 18 8 17 98 64 5 19 476 7 82 4 18 88 97 MD 67 39 35 9 25 46 54 3 9 173 9 69 5 7 4 126 MD 172 26 24 10 20 99 56 7 15 389 7 77 4 30 23 296 MD 193 31 26 6 19 28 40 2 16 323 10 221 6 2 2 100 MD 222 22 21 6 15 79 37 3 14 349 8 144 4 10 41 161 MD 256 28 25 6 20 41 53 3 23 309 8 163 5 5 10 217 MD 261 28 27 11 17 503 166 10 19 420 10 169 5 143 1225 347 Sample La Ce Pr Nd Sm Eu Gd Tb Dy Ho Er Tm Yb Lu Hf Pb Th U MD 243 9 16 2 8 2 0 1 0 1 0 1 0 1 0 3 276 9 16 MD 139 10 17 2 8 2 0 1 0 1 0 1 0 1 0 1 37 10 17 MD 12 11 21 2 8 2 0 1 0 1 0 1 0 1 0 1 76 11 21 MD 21 15 25 3 11 2 0 2 0 1 0 1 0 1 0 2 56 15 25 MD 24 7 13 2 7 1 0 1 0 1 0 1 0 1 0 2 1448 7 13 MD 66 7 15 2 7 2 0 2 0 1 0 1 0 1 0 2 505 7 15 MD 143 10 20 2 8 1 0 1 0 1 0 1 0 1 0 1 62 10 20 MD 173 6 12 1 6 1 0 1 0 1 0 1 0 1 0 2 94 6 12 MD 191 6 13 2 5 1 0 1 0 1 0 0 0 1 0 1 137 6 13 MD 231 8 16 2 7 2 0 1 0 1 0 1 0 1 0 2 259 8 16 MD 257 13 24 3 12 2 1 2 0 2 0 1 0 1 0 5 881 13 24 MD 259 7 12 2 6 1 0 1 0 1 0 1 0 0 0 2 13 7 12 MD 272 7 17 2 6 1 0 1 0 1 0 1 0 1 0 2 75 7 17 MD 276 8 16 2 7 2 0 1 0 1 0 1 0 1 0 2 627 8 16 MD 67 9 18 2 8 2 1 2 0 2 0 1 0 1 0 2 199 9 18 MD 172 8 16 2 8 2 0 2 0 1 0 1 0 1 0 2 603 8 16 MD 193 12 24 3 11 2 1 2 0 2 0 1 0 1 0 6 50 12 24 MD 222 9 17 2 8 2 0 2 0 2 0 1 0 1 0 4 331 9 17 MD 256 12 22 3 9 2 0 2 0 2 0 1 0 1 0 4 234 12 22 MD 261 11 21 3 10 2 0 2 0 2 0 1 0 1 0 4 1691 11 21
The latter two could imply the recycling of tesserae.
There is a possibility that glass cullet, which is not rich in metal-bearing colourants, was added to the glass melt. The result could be a difference in chemical composition of the glass, which do not show
elevated values for lead, copper, zinc, tin and antimony. The cause of possible low values of the aforementioned elements could also be in the small amount of recycling cycles.
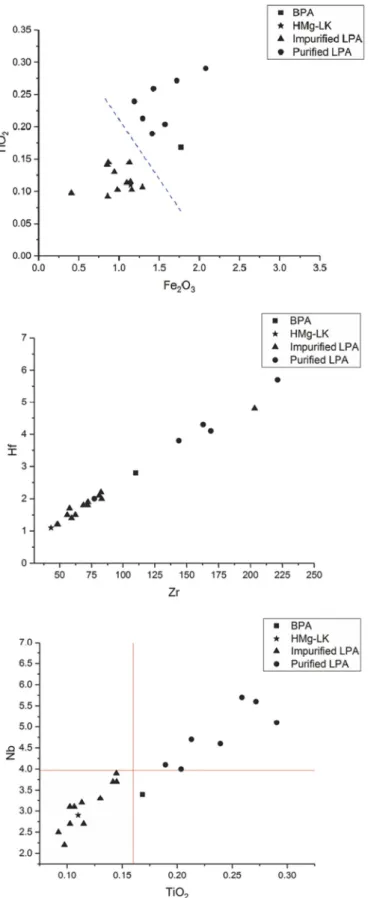
3.4.2. Chemical fingerprint of the sands
Trace elements can be considered compositionally indicative. In general, Zr ≥ 70 ppm, TiO2≥ 0.18 wt%, Cr ≥ 21 ppm, V ≥ 21 ppm and Nb ≥ 4 ppm are correlated with purified LPA glasses. Impurified LPA glasses have Zr ≤ 70 ppm, TiO2≤ 0.18 wt%, Cr < 20 ppm, V ≤ 20 ppm and Nb ≤ 4 ppm. The exceptions from this pattern are the recycled glasses. Miranduolo samples have a strong positive correlation of Fe2O3-TiO2, TiO2- Zr, Zr - Hf and TiO2- Nb (Fig. 6). All the afore-mentioned correlations are explained as mineral impurities in the sandy raw material. Columbite (FeNb2O6), a niobium-containing mineral, can be found selectively deposited with Fe - Ti bearing oxide minerals, in-cluding zircon and ilmenite. They are found in sedimentary fluvial deposits as heavy mineral placers. Columbite-bearing mineral deposits are common in geological regions characterised by granitic rocks and outcrops (Schiavon et al., 2012). On the other hand, no significant granite outcrops are present near the Miranduolo area nor near San Vettore and Germagnana glass-making factories (Constantini et al., 2005). Rare Earth Elements (REE): La, Ce, Pr, Nd, Sm, Eu, Gd, Tb, Dy, Ho, Er, Tm, Yb and Lu give the raw material fingerprint.
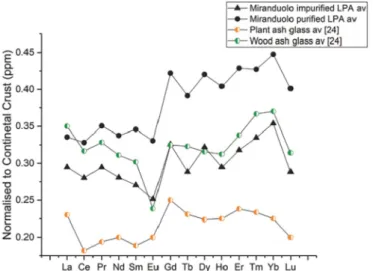
They are known to be resistant to precipitation in numerous che-mical reactions (Wedepohl et al., 2011a). More importantly, plant ash Na-Ca-Si glasses derive their REE from the silica sand (Wedepohl et al., 2011a). The REE's were normalised to continental crust data (Inline Supplementary Table S1) (Wedepohl, 1995).
Four different methods were used to group REE data (Inline Supplementary Table S1):
1) an average for all Miranduolo glasses (Fig. 7- top);
2) an average for impurified and purified LPA glasses (Fig. 7- bottom); 3) according to aluminium concentration: each group is assigned for
every 0.5 wt% of Al2O3;
4) as the third method but without recycled glasses (Fig. 8).
Comparing the third and fourth method, the distinction can be only sought in the group 3 as it contained two recycled samples.
The REE were compared with the available published data from Wedepohl et al. (Fig. 7, Fig. 8) (Wedepohl et al., 2011a; Wedepohl et al., 2011b). Miranduolo's REE seem to be comparable with wood ash glasses (K-Ca-Si) not Na-Ca-Si glasses (Fig. 7). Negative Eu anomaly occurs as Eu2+and separates from the other REEs (Wedepohl et al., 2011a). Those anomalies are often in granites where Eu2+ is in-corporate in Ca-plagioclases (Wedepohl et al., 2011a). Every Mir-anduolo REE group displays this anomaly except group 5 and 13th century Venetian glass from Höxter (Fig. 8) (Wedepohl et al., 2011b). Negative Ce anomaly is “…formed under oxidizing conditions in rocks that late in their history reacted with seawater...” (Wedepohl et al., 2011a). This anomaly is not noted in groups 5 and 6 (Fig. 8) (Wedepohl et al., 2011b).
3.4.3. Rubidium and arsenic as dating discriminants for Tuscan glass-making?
Cagno et al. (Cagno et al., 2010) use K2O-Rb plot for LPA glasses as a dating discriminant:
1) Rb ≤ 30 ppm dated to 13th -14th century CE 2) Rb > 30 ppm dated to 15th -16th century CE.
Additionally, the authors discuss the occurrence of LPA glasses in the 13th/14th and the occurrence of BPA glasses in the 15th century (Cagno et al., 2010). The main distinction between them in arsenic concentrations:
Fig. 6. Bi-plots according to LA-ICP-MS data: Fe2O3– TiO2(top); Zr – Hf (middle); TiO2– Nb (bottom). Oxides are represented in wt%, while elements in ppm.
◊ As < 10 ppm in LPA glasses ◊ As > 30 ppm in BPA glasses.
All Miranduolo LPA glasses have Rb < 30 ppm. The only exception is MD 21 (Fig. 9). A coeval glass t_62 from San Vettore is also an ex-ception with rubidium of 47 ppm (Cagno et al., 2010). Apart from these two discrepancies, the glasses from 13th–14th century Tuscan sites including Miranduolo have rubidium concentrations below 30 ppm. Hence, there is a possibility that glasses MD 21 and t_62 were in-correctly dated or rubidium plot cannot be used as a dating dis-criminant for LPA glasses.
Only one BPA glass has been recovered at Miranduolo: MD 243. It has arsenic levels of 4 ppm and rubidium levels of 27 ppm (Inline Supplementary Table S1). Therefore, this BPA glass shows concentra-tions that are characteristic of 13th–14th century LPA glasses. According to the current data no firm conclusions can be made. 3.4.4. Colourants
The Fe2O3-TiO2strong positive correlation indicates that the glasses obtained their colour due to iron impurities present in the sands. On the other hand, intentional input of manganese was added to decolourise
Fig. 7. Plot of Mirandoulo's REE average (top), impurified and purified LPA glasses (bottom) compared to wood and plant ash glass average from (Wedepohl et al., 2011a).
Fig. 8. Normalised REE abundances of Miranduolo glass groups according to alumina concentration without recycled samples. The data is compared to average abundances of 13th century Venetian glass found in Höxter, Germany (Wedepohl et al., 2011b).
Fig. 9. K2O-Rb plot of Miranduolo glasses according to LA-ICP-MS data. The data is presented as oxide in wt% and element in ppm.
the glasses (Fig. 10). Manganese as a decolouriser is acknowledged to be used in Tuscan glass recipes by the end of 13th century (Gimeno et al., 2008;Gimeno et al., 2010).
3.5. Coeval Italian sites
The results were compared with coeval Italian sites (Cagno et al., 2010; Cagno et al., 2008; Verità, 2013; Cagno et al., 2012b; Brill, 1999a;Vandini et al., 2018;Brill, 1999b).
All the sites have similar composition of major elements showing that there was a glass recipe which was used throughout the Apennines (Fig. 11). One has to take in consideration that in Medieval times the glassmakers did not have commercially standardised raw materials (Smedley and Jackson, 2002). Between 11th and 14th century Venetian glassmakers used more impure raw silica sources comparing to the fa-mous glasses made with Ticino pebbles. These “impure” Venetian glasses had iron and alumina concentrations of Fe2O3> 0.80 wt% and Al2O3> 2.5 wt% as Miranduolo glasses (Verità, 2013; Brill, 1999a; Brill, 1999b). Only MD 259 has a “purer” sand with Fe2O3< 0.5 wt%. and Al2O3< 2.5 wt%. The titanium, zirconium, cerium and hafnium concentrations do not correspond to the Venetian glasses made with Ticino pebbles (Cagno et al., 2010;Smedley and Jackson, 2002;Šmit et al., 2005).
The major and minor elements of MD 259 correspond composition of 90.4 8 and 90.4 9 glasses at Santa Cristina glass-making workshop (Brianese et al., 2005). Additionally, 90.4 8, 90.4 9 and MD 259 are colourless and display visible iridescence effect on the surface. On the other hand, the non-recycled FA1 and FA2 glasses from Nogara also have the same major and minor chemical composition. Other 13th – 14th century Nogara glasses tend to be recycled with copper, tin, an-timony and lead above 100 ppm (Silvestri and Marcante, 2011).
Savona glasses have consistent different concentrations of copper, arsenic, rubidium, zirconium, niobium and barium than Miranduolo glasses (Cagno et al., 2012a).
The coeval Germagnana glasses (t_92 and t_95) contain MgO > 6.5 wt% (Cagno et al., 2010).
Although the major and minor elemental composition of glasses t_90
and t_91 from San Vettore is equal to Miranduolo, the barium and strontium levels are different (Cagno et al., 2010). San Vettore barium (> 1000 ppm) and strontium (> 750 ppm) concentrations are con-siderably higher than in Miranduolo's glasses (Cagno et al., 2010).
Rocca di Campiglia glasses (t_58–59 and t_63) and prunted beakers (N5–7) from St. Severus in Classe near Ravenna (Emilia-Romagna re-gion) have major, minor and trace elements that seem to be perfectly overlapping with Mirnaduolo's (Cagno et al., 2010;Vandini et al., 2018; Brill, 1999b). It is probable that all three sites have been supplied by the same glass-making factory.
The REE of 13th century Venetian glass found in Höxter, Germany displays a significantly different fingerprint than Miranduolo glasses. Only group 5 does not have the Eu anomaly as the Venetian Höxter glasses (De Francesco et al., 2014).
Unfortunately, the REE fingerprint for the quarried sands and coeval Italian glasses is not available. Hence, the exact comparison of quartz sand signatures is not possible. Therefore, we leave it probable that Tuscan glass-making factories were suppliers for Miranduolo castle. 3.6. Categorical data
The glasses have been distinctively selected according to the fol-lowing categorical data parameters: typology, colour, thickness, set-tlement's phase of recovery, settlements area of recovery with socio-economic and political distinction - noble family area and village area. No connection was found between the categorical and the chemical data.
4. Conclusions
Three techniques were used in this study to evaluate glass homo-geneity, presence and intensity of de-alkalisation, and chemical com-position to understand glass production methodologies (decolourants, colourants, extent of recycling, raw materials), provenance and can glass be associated with socio-economic markers present at Miranduolo. VP-SEM-EDS, although a semi-quantifying in nature with over-estimation of sodium, aluminium, magnesium and underover-estimation of
Fig. 11. Comparison of concentration between coeval Italian glasses and Venetian glass with a broader time-frame. All the areas are a representa-tion of an average composirepresenta-tion with the standard deviation; all the points are exact values (wt%). For details of the sites: (Cagno et al., 2010;Cagno et al., 2008;Verità, 2013;Cagno et al., 2012b;Brill, 1999a; Vandini et al., 2018;Brill, 1999b).
silica, yielded potassium and calcium values that correspond to LA-ICP-MS data. On the other hand, PIXE/PIGE calcium values seem to be underestimated comparing to the two. Due to this discrepancy all sub-grouping was based on LA-ICP-MS data because it displayed highest accuracy and precision.
The glass finds from Miranduolo are typical 13th–14th century vessel forms that are found at coeval Italian sites. The skill of the glassmaker is accentuated with shapes blown down to 350 μm. In order to blow the glass as thin the glassmaker should have decades of hands-on experience. The major and minor elements data displays similarities in the glass production. Plant ashes and “impure” sands were used throughout Tuscany, Liguria and Venice. This could imply the existence of a “recipe trend” and/or the movement of Venetian glass masters to Tuscany. It is exactly from the 13th century that Tuscan glass-making workshops were established and started to flourish.
The glasses mainly do not display properties of recycling indicating that the glasses went through the whole glass-making process from obtaining raw materials to forming them into final product. But there is a possibility that a glass cullet (possibly Venetian), poor in metal-bearing colourants, was added to the glass melt affecting only major chemical composition. The recycling markers would not be elevated if there was a small amount of recycling cycles. Due to the raw materials used, the natural tint was trying to be diminished and/or reduced with manganese is well known in Tuscan glass recipes by the end of 13th century.
There is a notable difference in chemical composition between two sub-types of LPA glasses. Trace elements consistently show the differ-ence in the sand sources used for impurified and purified glasses, with the impurified LPA glasses being made with a purer sand source than the purified LPA glasses. The correlations of K2O - CaO and K2O - MgO, CaO - Ba, MgO - Ba, K2O - Ba and CaO - MgO in impurified LPA glasses are different that those found in both Salsola and non-Salsola plant ashes. This leaves the probability that the high calcium content in the glass is not related to input of the plant ashes but to the silica sources, or to an intentional adding of a calcium source in form of shells or lime-stone. The possibility is that calcium rich sands of La Casina La Cava quarry near Gambassi, which could have been subjected to purification by washing, were used. On the other hand, the purified LPA glasses were made with more impure sand sources. Lower concentrations of calcium and a constant concentration of magnesium indicate that a purification process of the ashes might have taken place.
The REE fingerprint shows that different sands were used implying that the glasses could have come from multiple factories. One should take into consideration the possibility of the existence of glass-making factories that have still not been excavated and those that are perma-nently destroyed. Additionally, the timespan of one century seems very long in terms of data comparisons as different batches would have been manufactured on a daily basis. This implies that the sand could have been obtained from different places and/or imported outside the glass-making workshops vicinity. The use of Ticino pebbles as a raw silica source can be excluded as a possibility. As we do not know the exact concertation of REE of the glasses from other coeval Italian sites, only speculation is possible. What seems the most probable option is that multiple Tuscan glass-making centres were the suppliers for Miranduolo.
Acknowledgements
Ivona Posedi gratefully acknowledges the financial support from EACEA agency of EC under FPA 2013-0238 through ARCHMAT EMMC scholarship. Financial support by the Access to Research Infrastructures activity in the H2020 Programme of the EU (IPERION CH Grant Agreement) is gratefully acknowledged. We are especially indebt to Marco Valenti, Alessandra Nardini and Manuelle Putti from the Department of Historical Sciences and Cultural Heritage for providing glass samples and to the research staff at the MTA Atomki: Zita Szikszai,
Anikó Angyal, László Csedreki, Enikő Furu, Róbert Huszánk, Enikő Papp and Zoltán Szoboszlai. Special thanks to Guilhem Mauran for assistance with the methodology and Melina Smirniou for critically evaluating the manuscript prior to submission. Constructive comments from two reviewers are gratefully acknowledged; any remaining errors are our own responsibility.
Appendix A. Supplementary data
Supplementary data to this article can be found online athttps:// doi.org/10.1016/j.jasrep.2019.101878.
References
Barkoudah, Y., Henderson, J., 2008. Plant ashes from Syria and the manufacture of an-cient glass: ethnographic and san-cientific aspects. Journal of glass studies 48, 297–321. Basso, E., et al., 2009. Composition of the base glass used to realize the stained glass
windows by Duccio di Buoninsegna (Siena Cathedral, 1288–1289 AD): a geochemical approach. Mater. Charact. 60 (12), 1545–1554.
Bianchin, S., et al., 2005a. Medieval and renaissance glass technology in Valdelsa (Florence). Part 2: vitreous finds and sands. J. Cult. Herit. 6 (1), 39–54. Bianchin, S., et al., 2005b. Medieval and renaissance glass technology in Valdelsa
(Florence). Part 3: vitreous finds and crucibles. J. Cult. Herit. 6 (2), 165–182. Brianese, N., Casellato, U., Fenzi, F., Sitran, S., Vigato, P.A., Mendera, M., 2005. Medieval
and Renaissance glass technology in Tuscany. Part 4: the XIVth sites of Santa Cristina (Gambassi–Firenze) and Poggio Imperiale (Siena). J. Cult. Herit. 6 (3), 213–225. Brill, R.H., 1999a. Chemical Analyses of Early Glasses. vol. 2 Corning Museum of Glass,
Corning, N.Y.
Brill, R.H., 1999b. Chemical Analyses of Early Glasses Vol 1. vol. 1 Corning Museum of Glass, Corning, N.Y.
Brill, R.H., Pongracz, P., 2004. Stained glass from Saint-Jean-des-Vignes (Soissons) and comparisons with glass from other medieval sites. Journal of glass studies 46, 115–144.
Cagno, S., Janssens, K., Mendera, M., 2008. Compositional analysis of Tuscan glass samples: in search of raw material fingerprints. Anal. Bioanal. Chem. 391 (4), 1389–1395.
Cagno, S., Mendera, M., Jeffries, T., Janssens, K., 2010. Raw materials for medieval to post-medieval Tuscan glass-making: new insight from LA-ICP-MS analyses. J. Archaeol. Sci. 37, 3030–3036.
Cagno, S., Brondi Badano, M., Mathis, F., Strivay, D., Janssens, K., 2012a. Study of medieval glass fragments from Savona (Italy) and their relation with the glass pro-duced in Altare. J. Archaeol. Sci. 39, 2191–2197.
Cagno, S., Favaretto, L., Mendera, M., Izmer, A., Vanhaecke, F., Janssens, K., 2012b. Evidence of early medieval soda ash glass in the archaeological site of San Genesio (Tuscany). J. Archaeol. Sci. 39 (5), 1540–1552.
Campbell, J.L., Boyd, N.I., Grassi, N., Bonnick, P., Maxwell, J.A., 2010. The Guelph PIXE software package IV. Nuclear instruments & methods in physics research B 268 (20), 3356–3363.
Casellato, U., et al., 2003. Medieval and renaissance glass technology in Valdelsa (Florence). Part 1: raw materials, sands and non-vitreous finds. J. Cult. Herit. 4 (4), 337–353.
Castello di Miranduolo Castello di Miranduolo. [Online]. Available:http:// archeologiamedievale.unisi.it/miranduolo/mediacenter, Accessed date: 31 August 2016.
Reperti vitrei Castello di Miranduolo. Castello di Miranduolo [Online]. Available.http:// archeologiamedievale.unisi.it/miranduolo/lo-scavo/documentazione/i-materiali/ vetri?field_num_inv_vetri_value=&field_area_rif_ceramica_nid=All&field_us_ reference_nid=All&field_periodo_ceramica_nid=All&field_struttura_rif_ceramica_ nid=All&field_forma, Accessed date: 31 August 2016.
A. Constantini et al., Note Illustrative della Carta Geologica d'Italia alla scala 1:50.000. Foglio 296- Siena. Roma: Università degli Studi di Siena e ISPRA-Servizio Geologico d’ Italia, 2005.
De Francesco, A.M., Scarpelli, R., Del Vecchio, F., Giampaola, D., 2014. Analysis of early medieval glass from excavations at ‘Piazza Bovio’, Naples (Italy). Archaeometry 56 (SUPPLS1), 137–147.
Duckworth, C.N., de la Llave, R. Córdoba, Faber, E.W., Edwards, D.J. Govantes, Henderson, J., 2015. Electron microprobe analysis of 9th–12th century Islamic glass from Córdoba, Spain. Archaeometry 57 (1), 27–50.
A. Franjić. Personal communication, Sept. 2018.
Fronza, V., Valenti, M., 2015. Chiusdino (SI). Castello di Miranduolo: relazione pre-liminare 2015. In: Notiziario della Soprintendenza per i Beni Archeologici della Toscana, Notizie. vol. 11. pp. 401–403.
Gimeno, D., et al., 2008. From Siena to Barcelona: deciphering colour recipes of Na-rich Mediterranean stained glass windows at the XIII–XIV century transition. J. Cult. Herit. 9, e10–e15.
Gimeno, D., et al., 2010. Caracterización química de la vidriera del rosetón del Duomo de Siena (Italia, 1288–1289). Boletin de la Sociedad Espanola de Ceramica y Vidrio 49 (3), 205–213.
Henderson, J., 1988. Electron probe microanalysis of mixed-alkali glasses. Archaeometry 30 (1), 77–91.
Glass. John Wiley & Sons.
Pollard, A.M., Heron, C., 2008. Archaeological Chemistry. Royal Society of Chemistry, Cambridge.
Schiavon, N., et al., 2012. A combined multi-analytical approach for the study of Roman glass from South-West Iberia: synchrotron micro-XRF, external-PIXE/PIGE and BSEM-EDS. Archaeometry 54 (6), 974–996.
Schibille, N., Freestone, I.C., 2013. Composition, production and procurement of glass at San Vincenzo al Volturno: an early Medieval monastic complex in Southern Italy. PLoS One 8 (10), 1–13.
Silvestri, A., Marcante, A., 2011. The glass of Nogara (Verona): a ‘window’ on production technology of mid-Medieval times in Northern Italy. J. Archaeol. Sci. 38, 2509–2522. Simon, A., et al., 2011. PIXE analysis of Middle European 18th and 19th century glass
seals. X-Ray Spectrom. 40 (3), 224–228.
Smedley, J.W., Jackson, C.M., Feb. 2002. Medieval and post-medieval glass technology: batch measuring practices. Glass Technol. 43 (1), 22–27.
Šmit, Ž., Janssens, K., Bulska, E., Wagner, B., Kos, M., Lazar, I., 2005. Trace element fingerprinting of façon-de-Venise glass. Nucl. Instrum. Methods Phys. Res. B 239 (1), 94–99.
“Trace Elements (wafer form),” National Institute for Standards and Technology. [Online]. Available:https://www-s.nist.gov/srmors/viewTableH.cfm?tableid=90.
Valenti, M. (Ed.), 2008. Miranduolo in alta Val di Merse (Chiusdino -SI). Archeologia su un sito di potere del Medioevo toscano. All'Insegna del Giglio s. a. s, Firenze. Valenti, M. (Ed.), 2010. Miranduolo in alta Val di Merse (Chiusdino – SI). Archeologia su
un sito di potere del Medioevo toscano, Ebook. University of Siena.
Vandini, M., Chinni, T., Fiorentino, S., Galusková, D., Kaňková, H., 2018. Glass produc-tion in the Middle Ages from Italy to Central Europe: the contribuproduc-tion of archaeo-metry to the history of technology. Chem. Pap.
Verità, M., 2013. Venetian Soda Glass. In: Janssens, K. (Ed.), Modern Methods for Analysing Archaeological and Historical Glass. vol. 1. pp. 515–536.
Wagner, B., Nowak, A., Bulska, E., Hametner, K., Günther, D., 2012. Critical assessment of the elemental composition of Corning archeological reference glasses by LA-ICP-MS. Anal. Bioanal. Chem. 402 (4).
Wedepohl, K.H., 1995. The composition of the continental crust. Geochim. Cosmochim. Acta 59 (7), 1217–1232.
Wedepohl, K.H., Simon, K., Kronz, A., 2011a. The chemical composition including the Rare Earth Elements of the three major glass types of Europe and the Orient used in late antiquity and the Middle Ages. Chemie der Erde - Geochemistry 71 (3), 289–296. Wedepohl, K.H., Simon, K., Kronz, A., 2011b. Data on 61 chemical elements for the
characterization of three major glass compositions in late antiquity and the middle ages. Archaeometry 53 (1), 81–102.