Especially Low Mutation Rates
John W. Drake*
Laboratory of Molecular Genetics, National Institute of Environmental Health Sciences, Research Triangle Park, North Carolina, United States of America
Abstract
Rates of spontaneous mutation have been estimated under optimal growth conditions for a variety of DNA-based microbes, including viruses, bacteria, and eukaryotes. When expressed as genomic mutation rates, most of the values were in the vicinity of 0.003–0.004 with a range of less than two-fold. Because the genome sizes varied by roughly 104-fold, the mutation rates per average base pair varied inversely by a similar factor. Even though the commonality of the observed genomic rates remains unexplained, it implies that mutation rates in unstressed microbes reach values that can be finely tuned by evolution. An insight originating in the 1920s and maturing in the 1960s proposed that the genomic mutation rate would reflect a balance between the deleterious effect of the average mutation and the cost of further reducing the mutation rate. If this view is correct, then increasing the deleterious impact of the average mutation should be countered by reducing the genomic mutation rate. It is a common observation that many neutral or nearly neutral mutations become strongly deleterious at higher temperatures, in which case they are called temperature-sensitive mutations. Recently, the kinds and rates of spontaneous mutations were described for two microbial thermophiles, a bacterium and an archaeon. Using an updated method to extrapolate from mutation-reporter genes to whole genomes reveals that the rate of base substitutions is substantially lower in these two thermophiles than in mesophiles. This result provides the first experimental support for the concept of an evolved balance between the total genomic impact of mutations and the cost of further reducing the basal mutation rate.
Citation:Drake JW (2009) Avoiding Dangerous Missense: Thermophiles Display Especially Low Mutation Rates. PLoS Genet 5(6): e1000520. doi:10.1371/ journal.pgen.1000520
Editor:Josep Casadesu´s, Universidad de Sevilla, Spain
ReceivedMarch 18, 2009;AcceptedMay 18, 2009;PublishedJune 19, 2009
This is an open-access article distributed under the terms of the Creative Commons Public Domain declaration which stipulates that, once placed in the public domain, this work may be freely reproduced, distributed, transmitted, modified, built upon, or otherwise used by anyone for any lawful purpose.
Funding:This research was supported by funds allocated to project number Z01 ES65016 of the Intramural Research Program of the NIH, National Institute of Environmental Health Sciences. The funders had no role in study design, data collection and analysis, decision to publish, or preparation of the manuscript. Competing Interests:The author has declared that no competing interests exist.
* E-mail: [email protected]
Introduction
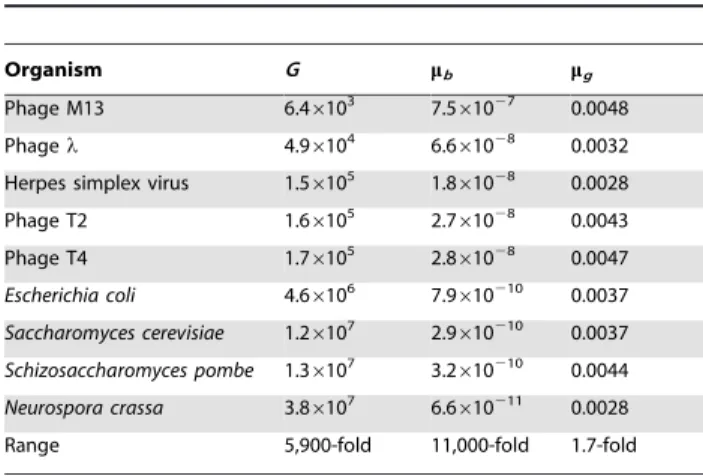
It has become increasingly clear that the basal rate of spontaneous mutation per genome per replication is remarkably invariant in DNA microbes: using a classical correction factor for estimating the ratio of all base-pair substitutions (BPSs) to detected base-pair substitutions, genomic mutation rates (mutations per genome per replication) vary by less than twofold while genome sizes vary by <6,000-fold (Table 1). Thus, when mutation rates are expressed per average base pair, they also vary by a similarly large factor. Therefore, basal mutation rates characteristic of unstressed microbial populations can evolve to finely tuned values. The theory of mutation rates has its roots in Haldane’s 1927 formulation of the impact of selection and mutation on fitness [1], followed by Sturtevant’s 1937 conjecture that the deleterious character of most mutations would generate selective pressures that should lower mutation rates indefinitely [2]. In 1967, Kimura offered the hypothesis that there would be a ‘‘physiological cost’’ to each reduction in rate, leading to an equilibrium value when that cost outweighs the gain in fitness [3]. The surprise has been that the observed genomic rates are so narrowly distributed among DNA microbes despite a wide variety of life histories and genome sizes. An even deeper mystery, not to be addressed here, is why the particular microbial genomic rate of about 0.003–0.004 has been adopted by microbes of such diverse life histories and genome sizes.
mutations accumulated to a lesser extent (compared to synonymous mutations) in thermophiles than in mesophiles during the course of molecular evolution (dN/dS falling from 0.14 to 0.09), implying stronger purifying selection in thermo-philes [5]. Here, direct measurements of the rate and character of spontaneous mutation are compared for mesophilic and thermophilic microbes.
Results
Two Extrapolation Problems
The first phase of determining genomic mutation rates involves measuring a mutation frequency, converting the frequency to a rate, and taking precautions to exclude or take into account the
impact of perturbations such as differential growth rates of mutants versus wild type and delayed expression of the mutant phenotype. In addition to measuring rates, it is crucial to identify the kinds of mutations that arise in order to exclude biases due to massive mutational hotspots or to bizarre classes of mutations. The typical result is a rate for a mutation-reporter gene, which is then extrapolated to the whole genome provided that the spectrum of mutations is fairly ordinary. However, there is a substantial problem here: while most indels are detected, most BPSs fail to produce a phenotypic change detectable in the laboratory. One must therefore estimate their full frequencies. (An exception is the still rare case that mutation detection is achieved with phenotype-blind genomic DNA sequencing.) Two methods have been applied. Both make the reasonable assumption that almost all indels and chain-termination (CT) BPSs are detected with high efficiency in protein-coding sequences. (Although exceptions occur, they are infrequent and tend to occur at the extreme downstream end of a gene.) The first method was based in part on the average relative frequencies of CT and non-CT BPSs in a handful of spectra and provided a correction factor for base substitutions of 4.726 [6]. This method was used for almost all of the entries in Table 1; however, the range of values averaging to 4.726 was large, reducing reliability. The second method is based exclusively on CT mutations. It involves examining the reporter sequence for all possible BPSs capable of generating CTs and then dividing the observed CT mutation frequency by that reduced target size and multiplying by 3 (to account for the three BPSs that can arise at any site) to obtain an average mutation rate per base pair. The CT method also has drawbacks. First, it cannot report A?TRG?C mutations, but these generally arise at approximately average BPS rates, suggesting a minimal problem. Second, CT mutations are typically a minority of all mutations, so that many spectra sport only a few CTs, reducing sampling accuracy.
The other major barrier to accurate extrapolation from a mutation-reporter gene to the whole genome becomes manifest when sequencing reveals a major hotspot. Mutation rates at particular sites vary greatly, but most mutational spectra display a range of site-specific numbers of mutations ranging from 1 to hotspots with from several percent to even a quarter of the whole collection. The impact of a hotspot containing a quarter of all the mutations is modest, but some genes contain single hotspots bearing the large majority of mutations; the classic example is the E. coli lacIgene, where,72% of all mutations are indels arising at a stretch of 13 BPSs consisting of 3.25 repeats of a tetramer [7]. However, such massive indel hotspots are infrequent among genes, and it is reasonable to post occasional genomic rates both including and removing them.
Thermophiles Versus Mesophiles
All informative microbial mutation rates obtained before 2000 were for mesophilic species, but rates and spectra are now available for two genes in each of two very different thermophiles, the crenarchaeonSulfolobus acidocaldarius[6] and the bacteriumThermus thermophilus[8], both growing at close to 75uC. In the first study, with S. acidocaldarius, BPSs were a smaller fraction of the spectrum than in mesophiles, and this observation prompted the hypothesis of dangerous missense. Note, however, that if greater fractions of missense mutations are phenotypically detectable in thermophiles than in mesophiles, then the historical method of correcting for undetected BPSs becomes inappropriate when based on mesophiles. It is therefore advisable to resort exclusively to the CT method for estimating total BPS rates, which is the central result for this report. Table 2 lists genomic mutation rates estimated using the CT method (or its lacZa equivalent), sometimes based on the same Author Summary
Spontaneous mutations are key drivers of evolution and disease. In microbes, most mutations are deleterious, some are neutral (without significant impact), and a few are advantageous. Because deleterious mutations reduce fitness, there should be constant selection for antimutator mutations that reduce rates of spontaneous mutation. However, such reductions are necessarily achieved at some cost. Therefore, a mutation rate should converge evolu-tionarily on a value that reflects this trade-off. For DNA microbes, the observed genomic mutation rate is remark-ably (and mysteriously) invariant, in the neighborhood of 0.003–0.004, with a range of less than two-fold despite huge variation per average base pair in organisms with a wide diversity of life histories. Would an environmental condition that increased the average deleterious impact of a mutation be balanced by additional investments in antimutator mutations? It is widely observed that many mutations with mild impacts become strongly deleterious at higher temperatures, so mutation rates were measured in two thermophiles, a bacterium and an archaeon. Remarkably, both displayed average mutation rates reduced by about five-fold from the characteristic meso-philic value, most of the decrease reflecting a 10-fold reduction in the rate of base substitutions.
Table 1.Microbial genomic mutation rates estimated using historical methods.
Organism G mb mg
Phage M13 6.46103 7.5
61027 0.0048
Phagel 4.96104 6.661028 0.0032
Herpes simplex virus 1.56105 1.861028 0.0028
Phage T2 1.66105 2.7
61028 0.0043
Phage T4 1.76105 2.861028 0.0047
Escherichia coli 4.66106 7.9610210 0.0037 Saccharomyces cerevisiae 1.26107 2.9
610210 0.0037
Schizosaccharomyces pombe 1.36107 3.2610210 0.0044 Neurospora crassa 3.86107 6.6610211 0.0028
Range 5,900-fold 11,000-fold 1.7-fold
G= genome size in bases or base pairs.mb= average mutation rate per base pair
per replication.mg= mutation rate per genome per replication =G6mb. See the
sources as for Table 1 but excluding some reports whose sequencing information was inadequate for the CT method. The nine entries at the top are for mesophiles and reveal no significant departures from the values in Table 1, providing empirical confidence in the robustness of the CT method. The two entries at the bottom are for thermophiles, whose numbers of CTs are small. (The data for the two mutation-reporter genes are combined in each organism because of the small number of CTs.) The thermophile BPS rates are substantially lower, by about 10-fold, than their mesophile counterparts. When major indel hotspots are included, indel rates are less than twofold lower in thermophiles, while total genomic rates are about fivefold lower. (When the indel hotspots are removed from the analysis, the indel rate decrease is three-fold and the total genomic rate decrease is seven-fold.) Although these ratios are somewhat uncertain because of the small numbers of CTs for five of the seven mesophiles and both thermophiles, the mean difference is large enough to support the inference that BPS rates are lower in thermophiles. The mesophile and thermophile values were com-pared using randomization t-tests [9], a nonparametric test that requires no assumptions about normality or equal variances of the mutation rates. The resulting one-sidedpvalues are 0.018 for both the total mutation rate and its BPS component, and 0.27 for the indel values that include the hotspots.
Discussion
The Central Result
Genomic mutation rates have long been suspected to evolve as a balance between the deleterious impact of the average mutation and the cost of further reducing the mutation rate. A test of this conjecture on the evolutionary scale could consist of estimating mutation rates in organisms whose environment increases the
impact of the average mutation. Because many base substitutions do greater harm at higher temperatures, thermophiles were suitable candidate organisms. For both a bacterium and an archaeon, the thermophiles display sharply reduced rates of base pair substitutions compared to the typical mesophile.
The lower mutation rates in thermophiles are likely to reflect their higher optimal growth temperatures. There is no obvious hint of a particular aspect of life history other than temperature that sets the two thermophiles apart from the mesophiles. The %(G+C) values for the ten organisms in Tables 1 and/or 2, listed monotonically with the two thermophile values in bold, are 35– 36–37–38–41–50–50–51–68–69, providing no hint of a role for this variable, as also noted in the earlier molecular-evolution study [5]. Thus, the Kimura conjecture, that the equilibrium mutation rate reflects a balance between the impact of the average mutation compared to the cost of keeping mutations in check, is supported in a natural experiment.
The hypothesis of dangerous missense predicts that BPS rates will be reduced in thermophiles but does not speak directly to indel rates. However, indel rates are also reduced, although less strongly than are BPS rates and with apvalue of 0.27 for these data. One candidate explanation for this difference is that the reduction in BPS rates is achieved by the accumulation of modifiers selected to target BPS mutagenesis but at most incidentally targeting indel mutagenesis. Because single-base additions and deletions tend to be the large majority of indels in mesophiles (35 single-base indels/ 38 total indels in phagel, 20/23 in phage T4, 45/45 in Herpes simplex virus, 604/641 inE. coli, 88/97 inS. cerevisiae, and 24/32 inS. pombe) and are similarly frequent in thermophiles (84/95 inS. acidocaldariusand 46/54 inT. thermophilus), these small indels must be the main targets of antimutagenic modifiers acting on indels generally. Both single-base indels and BPSs result from errors of
Table 2.Microbial genomic mutation rates calculated using the CT method.
Organism Mutation reportera m
g(I) (2HS)b mg(B) (CTs)c mg(2HS)b
Phage M13 lacZa 0.00103 0.0038 (245) 0.0048
Phagel cII 0.00041 0.0022 (8) 0.0026
Phage T4 rI 0.00079 0.0030 (6) 0.0038
Herpes simplex virus tk 0.00083 0.0035 (5) 0.0043
Escherichia coli lacI 0.00230 (0.00042) 0.0025 (24) 0.0048 (0.0030)
Saccharomyces cerevisiae URA3(4) 0.00016 0.0029 (108) 0.0030
CAN1(3) 0.00056 0.0058 (76) 0.0063
Schizosaccharomyces pombe ura4 0.00031 0.0019 (5) 0.0022
ura5 0.00050 0.0034 (4) 0.0039
Mesophile mean 0.00077(0.00056) 0.0032 0.0040(0.0038)
Mesophile range 15-fold (6.7-fold) 3.0-fold 2.9-fold (2.9-fold)
Sulfolobus acidocaldarius pyrEF 0.00053 (0.00026) 0.00011 (1) 0.00065 (0.00037)
Thermus thermophilus pyrEF 0.00038 0.00013 0.00054 (2) 0.00093 (0.00067)
Thermophile mean 0.00046(0.00019) 0.00033 0.00079(0.00052)
Thermophile range 1.4-fold (2.0-fold) 4.8-fold 1.4-fold (1.8-fold)
Mean (mesophile/thermophile) 1.7(2.9) 9.8 5.1(7.2)
mg(I) = genomic indel rate.mg(B) = genomic base-pair substitution rate.mg=mg(I)+mg(B).
a(Number of values averaged).
b(Value excluding a large frameshift hotspot). c(Number of chain-terminating mutations or equivalent).
insertion followed by failures of proofreading and DNA mismatch repair in well studied model organisms such as E. coli and S. cerevisiae, but little is known about the sources of spontaneous mutations inS. acidocaldariusandT. thermophilus.
New Fishing Holes
Are there likely to be other outliers with informative deviations from the mutational pattern that is consistently displayed among the mesophilic microbes examined to date with respect to either the mutation rate or the BPS:indel ratio?
Mutations to cold sensitivity are rarely reported and are anecdotally described as difficult to discover. If they are indeed rare, perhaps fewer missense mutations produce mutant phenotypes in psychrophiles than in mesophiles. One evolutionary consequence might then be a relaxation to a higher spontaneous rate of BPS mutation, perhaps with little effect on the rate of indel mutation.
Because of incomplete buffering against the impacts of their environments, halophiles and acidophiles experience relative high internal concentrations of Na+and H+, respectively, compared to
other microbes. These ionic environments might be unusually stressful to mutants carrying missense mutations, resulting in adjustments to their mutational patterns in the same direction as seen for thermophiles. Although without significance because of sampling constraints, Table 2 attributes a five-fold lower BPS mutation rate to the acidophileS. acidocaldariusthan to the non-acidophileT. thermophilus. Unfortunately, an attempt to character-ize mutation in the halophilic archaeon Haloferax volcanii failed, probably because this mesophile is highly polyploid [10].
The lactic acid bacteriumOenococcus oeni, used in wine making to convert malic acid to lactic acid, lacks the usual bacterial DNA mismatch repair (MMR) system and has a high mutation rate as judged by mutations conferring resistance to rifampin and erythromycin, as does Oenococcus kitaharae [11]. These results suggest a powerful genus-wide mutator condition, which would normally be highly deleterious. The question then arises whether the lack of MMR is so strongly adaptive in these species as to outweigh the sharply decreased fitness of the mutator condition, or whether the species have been unable to re-acquire the MMR genes by horizontal transfer.
Whereas the above two species lack MMR function and display mutator phenotypes, the crenarchaeons as a whole, includingS. acidocaldarius, lack all known bacterial MMR genes, but S. acidocaldarius, at least, displays an antimutator phenotype com-pared with mesophiles. How can this be? In Escherichia coli, the mutation rate per average base pair<8610210(Tables 1 and 2).
Based on the strengths of mutator mutations, replication infidelity can be estimated as the product of three components during DNA replication: insertion errors <0.961025, proofreading failures
<1.761022, and MMR failures <561023 [12,13]. In
bacterio-phage T4, which does not employ a general MMR system, the mutation rate per average base pair<261028(Tables 1 and 2). Based on the strengths of mutator mutations, replication fidelity can be estimated as the product of two components during DNA replication: insertion errors <161025 and proofreading failures <261023[13]. Thus, T4 makes up for the lack of MMR by a
proofreading potency about an order of magnitude greater than that operating in E. coli. The mutation rate per base pair forS. acidocaldarius<3610210, which might be achieved by a product of factors applied to the T4 insertion and proofreading accuracies that together produce a 70-fold improvement. Alternatively, S. acidocaldarius may possess an MMR system so distinct from the standard mutHLS model as to have escaped recognition by genomic scans. Note also that both thermophiles have genomes about twofold smaller than theE. coligenome.
Methods
General Procedures
We begin in possession of values for the following: G= the genome size in bases or base pairs.
T= the number of bases or base pairs in the target (the mutation-reporter sequence).
mT= the measured mutation rate at T, corrected where necessary for mutants expressing the characteristic phenotype but revealed by sequencing to lack mutations in the reporter gene, but not corrected for mutants with two or more mutations (which are infrequent and sometimes absent). In many cases, mT=f/
ln(mTN) wheref= the measured mutation frequency for the given
target, N= the final population size, and the median mT over
several cultures is used [14], a method that is robust compared to the classical fluctuation test provided the average number of mutational events per culture is$30 [15].
M= number of sequenced mutants =B+I, whereB= number of BPS mutants and I= number of indel mutants, the latter also including complex mutants (a minority, if present at all) regardless of their components.
For the ‘‘historical’’ method, we correct for undetected BPSs by multiplying the number of detected BPSs by 4.726 [6]. Then the average mutation rate per base or base pair mb= [mT corrected
upwards by (I+4.726B)/M]/T= (I+4.726B)( mT/MT). The
geno-mic mutation ratemg=Gmb.
For the ‘‘CT’’ method, the indel genomic mutation ratemg(I) is
calculated as above ignoring the BPS component, B becomes BCT= number of mutations to a chain-terminating codon (TAG,
TGA, or TAA), andP= number of possible mutational pathways to a CT mutation withinT(there being three mutational BPS pathways per base or base pair). Then the BPS genomic mutation rate mg(B) =mT(3BCT/MP)G. The total genomic ratemg=mg(I)+mg(B).
Calculations
Phage M13. G= 6407. This system is unique among popular mutation reporters. It consists of an E. coli lacZa transgene embedded in the single-stranded DNA of the M13 genome and carrying both an upstream regulatory region and the beginning of thelacZgene. Because thousands of mutants have been sequenced, it has become apparent which mutations are detectable when present singly and which are not [14,16]. The target sizes for base substitutions (TB= 245) and for single-base indels (T61= 177) are thus well defined, and we further assume that the infrequent larger indels are fully detectable (TL= 239). The measured mutation
frequencyf was 5.8661024[17], M= 117,B= 67, I61= 11 and IL= 39. Assuming that virtually all replication occurs by a rolling
circle mechanism, the mutation rate is calculated as for RNA viruses,m=f/2c where c is the number of consecutive cycles of infection [18]. The following protocol was used to grow the stock ([17] and T. A. Kunkel, personal communication). The contents of one plaque ($1013pfu) were added to l L of medium containingE. colicells diluted from an overnight culture to about 107cells/ml, so that the multiplicity of infection was about 103. The input of infected cells from the plaque was#108, so that the input concentration of infected cells = 108/103/ml = 105/ml, that is, no more than 105/ 107= 0.01 of all cells.c<2.5 in the plaque+1 in the liquid culture = 3.5. Then mb= (f/2c)S(proportion of mutations of type i=Ni/
117)(1/Ti) = (5.8661024/7)[(3667/117)(1/245)+(11/117)(1/177)+ (39/117)(1/239)] = 7.4861027. mg(B) = (f/2c)(36proportion of
Phage l. G= 4.8506104. For the cII gene, T= 294,
f= 5.3661025, and, for 93 mutants,B= 55 (BCT= 8 andP= 35)
andI= 38 ([19] and J. Wagner, personal communication). Then mT=f/ln(mT N) = 6.10610
26
. Using the historical method, mb= (6.1061026)(38+5564.726)(1/93)(1/294) = 6.6461028 and mg= 0.00304. mg(I) = (6.1061026)(38/93)(4.856104/294) = 0.00041.
Using the CT method, mg(B) = (6.1061026)(8/93)(364.856104/
35) = 0.00218 andmg=mg(I)+mg(B) = 0.00259.
Herpes simplex virus type 1. G= 1.5236105. For the tk
gene, T= 1131, f= 661025, N= (0.3–20)6108 and, for 67
mutants, B= 22 (BCT= 5 and P= 90) and I= 45 [20].
Replication proceeds by a mixture of exponential and linear replication, for which we use mT=f/ln(mTN) and mT=f/2c (with
c= 2), respectively. The corresponding values aremT= 8.4061026
and 1061026, giving a mean of 9.2061026. Using the historical method,mb= (9.2061026)(45+2264.726)(1/67)(1/1131) = 1.8161028
and mg= 0.00275. mg(I) = (9.2061026)(45/67)(1.526105/1131) =
0.00083. Using the CT method, mg(B) = (9.2061026)(5/
67)(361.526105/90) = 0.00348 andmg=mg(I)+mg(B) = 0.00432.
Phage T2. See [15].
Phage T4. G= 1.6896105. For the rI gene, T= 294, mT= 2.8261026 and, for 66 mutants, B= 34 (BCT= 6 and
P= 43) and I= 32 [21]. Using the historical method, mb= (2.8261026)(32+3464.726)(1/66)(1/294) = 2.8061028 and mg= 0.00473. mg(I) = (2.8261026)(32/66)(1.6896105/294) = 0.00079.
Using the CT method, mg(B) = (2.8261026)(6/66)(361.696105/
43) = 0.00302 andmg=mg(I)+mg(B) = 0.00381.
Thermus thermophilus. G= 2.1276106. For the pyrEF
genes, T= 1326, mT= 3.2161027 and, for 73 mutants, B= 19
(BCT= 2 andP= 103) andI= 54 (or 18 without the hotspot) [8].
The historical method is inappropriate for thermophiles (see text). mg(I) = (3.2161027)(54/73)(2.1276106/1326) = 0.000381. Using
the CT method, mg(B) = (3.2161027)(2/73)(362.1276106/
103) = 0.000545.mg=mg(I)+mg(B) = 0.000926 (or 0.000672 without
the indel hotspot).
Sulfolobus acidocaldarius. G= 2.2266106. For the pyrEF
genes, T= 1240, mT= 3.3761027 and, for 108 mutants, B= 13
(BCT= 1 andP= 184) andI= 95 (or 46 without the hotspot) [6].
The historical method is inappropriate for thermophiles (see text). mg(I) = (3.3761027)(95/108)(2.2266106/1240) = 0.000532. Using
the CT method, mg(B) = (3.3761027)(1/108)(362.2266106/
184) = 0.000113.mg=mg(I)+mg(B) = 0.000645 (or 0.000371 without
the indel hotspot).
Escherichia coli. G= 4.6396106. For the lacI gene, mT= 6.04361027 (excluding 10 IS insertions) [15]. T= 1083
and, for 721 mutants,B= 80 (BCT= 24 andP= 110) andI= 641
(or 116 without the indel hotspot) [7]. Using the historical method, mb= (6.04361027)(641+8064.726)(1/721)(1/1083) = 7.89610210
and mg= 0.00366. mg(I) = (6.04361027)(641/721)(4.6396106/
1083) = 0.00230. Using the CT method, mg(B) =
(6.04361027)(24/721)(364.6396106/110) = 0.00255 andmg=mg(I)+ mg(B) = 0.00485 (or 0.002961 without the indel hotspot).
Saccharomyces cerevisiae. G= 1.2466107and calculations
are as above.
For theURA3gene,T= 804,P= 123, and four sets of values are available. For the first [22],mT= 2.7761028and, for 106 mutants,
B= 89 (BCT= 39) and I= 17; for the historical method, mb= 1.42610210 and mg= 0.00177; mg(I) = 0.00007; for the CT
method,mg(B) = 0.00310; and mg= 0.00317. For the second [23], mT= 6.2561028and, for 20 mutants,B= 15 (BCT= 4) andI= 5;
for the historical method, mb= 2.95610210 and mg= 0.00368;
mg(I) = 0.00024; for the CT method, mg(B) = 0.00380; and mg= 0.00404. For the third [23], mT= 3.5061028 and, for 106
mutants,B= 89 (BCT= 39) andI= 17; for the historical method, mb= 1.56610210 and mg= 0.00195; mg(I) = 0.00017; for the CT
method,mg(B) = 0.00022; and mg= 0.00038. For the fourth [24], mT= 4.7561028 and, for 106 mutants, B= 89 (BCT= 39) and
I= 17; for the historical method, mb= 2.37610210 and mg= 0.00295; mg(I) = 0.00014; for the CT method, mg(B) = 0.00446; and mg= 0.00460. The respective averages are,
for the historical method, mb= 2.08610210 and mg= 0.00259; mg(I) = 0.00015; and, for the CT method, mg(B) = 0.00289 and mg= 0.00305.
For theCAN1gene,T= 1773,P= 226, and three sets of values are available. For the first [25], mT= 2.7761027 and, for 20
mutants, B= 11 (BCT= 1) and I= 9; for the historical method, mb= 5.18610210 and mg= 0.00645; mg(I) = 0.00095; for the CT
method,mg(B) = 0.00249; and mg= 0.00344. For the second [26], mT= 3.01610
27
and, for 23 mutants,B= 17 (BCT= 5) andI= 6;
for the historical method, mb= 4.13610210 and mg= 0.00514; mg(I) = 0.00036; for the CT method, mg(B) = 0.00701; and mg= 0.00737. For the third [24], mT= 1.5261027 and, for 227
mutants, B= 150 (BCT= 70) and I= 77 (including 13 complex
mutations); for the historical method, mb= 2.97610210 and mg= 0.00370; mg(I) = 0.00036; for the CT method, mg(B) = 0.00775; and mg= 0.00811. The respective averages are,
for the historical method, mb= 4.09610210 and mg= 0.00510; mg(I) = 0.00056; and, for the CT method, mg(B) = 0.00575 and mg= 0.00631.
The averages of the fourURA3plus threeCAN1values (sum47) are: for the historical method,mb= 2.94610210andmg= 0.00366; mg(I) = 0.00033; and, for the CT method, mg(B) = 0.00412 and mg= 0.00444.
Schizosaccharomyces pombe. G= 1.2526107, values are
from [27] and S. Davey (personal communication) and calculations are as above. For the ura4 gene, T= 795, mT= 4.56610
28
and, for 39 mutants, B= 22 (BCT= 5, P= 116)
and I= 17; for the historical method, mb= 1.78610210 and mg= 0.00223; mg(I) = 0.00031; for the CT method, mg(B) = 0.00189; and mg= 0.00221. For the ura5 gene, T= 648, mT= 8.4461028and, for 49 mutants,B= 34 (BCT= 5,P= 96) and
I= 15; for the historical method, mb= 4.67610210 and mg= 0.00585; mg(I) = 0.00050; for the CT method, mg(B) = 0.00337; and mg= 0.00387. The average values for the
two genes are: for the historical method, mb= 3.23610210 and mg= 0.00404;mg(I) = 0.00041; for the CT method,mg(B) = 0.00263;
andmg= 0.00304.
Neurospora crassa: G= 3.8046107. Using the old mutation data (see [15]), forad-3AB,mb= 4.11610211andmg= 0.00172. Formtr, mb= 9.15610211 and mg= 0.00383. The average values are mb= 6.63610211andmg= 0.00278.
Acknowledgments
I thank Grace Kissling for the statistical analysis, and Marilyn Diaz, Dennis Grogan, Libertad Garcı´a Villada, Tom Kunkel, Susan Rosenberg, and Roel Schaaper for their helpful suggestions regarding intermediate versions of this article.
Author Contributions
References
1. Haldane JBS (1927) A mathematical theory of natural and artificial selection, Part V: Selection and mutation. Proc Camb Phil Soc 23: 838–844. 2. Sturtevant AH (1937) Essays on evolution. I. On the effects of selection on
mutation rate. Quart Rev Biol 12: 464–467.
3. Kimura M (1967) On the evolutionary adjustment of spontaneous mutation rates. Genet Res 9: 23–34.
4. Sterner R, Liebl W (2001) Thermophilic adaptation of proteins. Crit Rev Biochem Mol Biol 36: 39–106.
5. Friedman R, Drake JW, Hughes AL (2004) Genome-wide patterns of nucleotide substitution reveal stringent functional constraints on the protein sequences of thermophiles. Genetics 167: 1507–1512.
6. Grogan DW, Carver GT, Drake JW (2001) Genetic fidelity under harsh conditions: analysis of spontaneous mutation in the thermoacidophilic archaeon Sulfolobus acidocaldarius. Proc Natl Acad Sci U S A 98: 7928–7933.
7. Halliday JA, Glickman BW (1991) Mechanisms of spontaneous mutation in DNA repair-proficientEscherichia coli. Mutat Res 250: 55–71.
8. Mackwan RR, Carver GT, Kissling GE, Drake JW, Grogan DW (2008) The rate and character of spontaneous mutation in Thermus thermophilus HB27. Genetics 180: 17–25.
9. Conover WJ (1971) Practical nonparametric statistics. New York: John Wiley & Sons Inc.
10. Mackwan RR, Carver GT, Drake JW, Grogan DW (2007) An unusual pattern of spontaneous mutations recovered in the halophilic archaeonHaloferax volcanii. Genetics 176: 697–702.
11. Marcobal AM, Sela DA, Wolf YI, Markarova KS, Mills DS (2007) Role of hypermutability in the evolution of the genus Oenococcus. J Bacteriol 190: 564–570.
12. Schaaper RM (1993) Base selection, proofreading, and mismatch repair during DNA replication inEscherichia coli. J Biol Chem 268: 23762–23765. 13. Bebenek A, Dressman HK, Carver GT, Ng S, Petrov V, et al. (2001) Interacting
fidelity defects in the replicative DNA polymerase of bacteriophage RB69. J Biol Chem 276: 10387–10397.
14. Drake JW (1991) A constant rate of spontaneous mutation in DNA-based microbes. Proc Natl Acad Sci U S A 88: 7160–7164.
15. Foster PL (2006) Methods for determining spontaneous mutation rates. Methods Enzymol 409: 195–214.
16. Bebenek K, Kunkel TA (1995) Analyzing fidelity of DNA polymerases. Methods Enzymol 262: 217–232.
17. Kunkel TA (1985) The mutational specificity of DNA polymerase-bduringin vitroDNA synthesis. J Biol Chem 260: 5787–5796.
18. Drake JW, Holland JJ (1999) Mutation rates among lytic RNA viruses. Proc Natl Acad Sci U S A 96: 13910–13913.
19. Wagner J, Nohmi T (2000)Escherichia coliDNA polymerase IV mutator activity: genetic requirements and mutational specificity. J Bacteriol 182: 4587–4595. 20. Drake JW, Hwang CBC (2005) On the mutation rate of herpes simplex virus
type 1. Genetics 170: 969–970.
21. Schultz GE Jr, Drake JW (2008) Templated mutagenesis in bacteriophage T4 involving imperfect direct or indirect sequence repeats. Genetics 178: 661–673. 22. Lee GS-F, Savage EA, Ritzel RG, von Borstel RC (1988) The base-alteration spectrum of spontaneous and ultraviolet radiation-induced forward mutations in theURA3locus ofSaccharomyces cerevisiae. Mol Gen Genet 214: 396–404. 23. Pursell ZF, Isoz I, Lundstro¨m E-B, Johansson E, Kunkel TA (2007) Yeast DNA
polymerase e participates in leading-strand DNA replication. Science 317: 127–130.
24. Lang GI, Murray AW (2008) Estimating the per-base-pair mutation rate in the yeast,Saccharomyces cerevisiae. Genetics 178: 67–82.
25. Tran PT, Simon JA, Liskay RM (2001) Interactions of Exo1p with components of MutLainSaccharomyces cerevisiae. Proc Natl Acad Sci U S A 98: 9760–9765. 26. Venkatesan RN, Hsu JJ, Lawrence NA, Preston BD, Loeb LA (2006) Mutator
phenotypes caused by substitution at a conserved motif A in eukaryotic DNA polymerased. J Biol Chem 281: 4486–4494.