ISSN 0100-879X
BIOMEDICAL SCIENCES
AND
CLINICAL INVESTIGATION
www.bjournal.com.br
www.bjournal.com.br
Volume 45 (1) 1-92 January 2012
Braz J Med Biol Res, January 2012, Volume 45(1) 78-85
doi: 10.1590/S0100-879X2011007500158
Serum metabolic profiling of human gastric cancer based on gas
chromatography/mass spectrometry
Hu Song, Jun-Sheng Peng, Dong-Sheng Yao, Zu-Li Yang, Huan-Liang Liu, Yi-Ke Zeng,
Xian-Ping Shi and Bi-Yan Lu
Institutional Sponsors
The Brazilian Journal of Medical and Biological Research is partially financed by
Faculdade de Medicina de Ribeirão Preto Campus
Ribeirão Preto
Ex plor e H igh - Pe r for m a n ce M S Or bit r a p Te ch n ology I n Pr ot e om ics & M e t a bolom ics
Serum metabolic profiling of human
gastric cancer based on gas
chromatography/mass spectrometry
Hu Song
1, Jun-Sheng Peng
1, Dong-Sheng Yao
2, Zu-Li Yang
1, Huan-Liang Liu
3,
Yi-Ke Zeng
1, Xian-Ping Shi
3and Bi-Yan Lu
31Department of Gastrointestinal Surgery, the Sixth Affiliated Hospital (Gastrointestinal and Anal Hospital),
Sun Yat-sen University, Guangzhou, Guangdong, China
2National Engineering Research Center of Genetic Medicine, Ji Nan University,
Guangzhou, Guangdong, China
3Institute of Gastroenterology, Sun Yat-sen University, Guangzhou, Guangdong, China
Abstract
Research on molecular mechanisms of carcinogenesis plays an important role in diagnosing and treating gastric cancer.
Meta-bolic profiling may offer the opportunity to understand the molecular mechanism of carcinogenesis and help to non-invasively
identify the potential biomarkers for the early diagnosis of human gastric cancer. The aims of this study were to explore the underlying metabolic mechanisms of gastric cancer and to identify biomarkers associated with morbidity. Gas chromatography/ mass spectrometry (GC/MS) was used to analyze the serum metabolites of 30 Chinese gastric cancer patients and 30 healthy controls. Diagnostic models for gastric cancer were constructed using orthogonal partial least squares discriminant analysis
(OPLS-DA). Acquired metabolomic data were analyzed by the nonparametric Wilcoxon test to find serum metabolic biomarkers
for gastric cancer. The OPLS-DA model showed adequate discrimination between cancer and non-cancer cohorts while the model failed to discriminate different pathological stages (I-IV) of gastric cancer patients. A total of 44 endogenous metabolites such as amino acids, organic acids, carbohydrates, fatty acids, and steroids were detected, of which 18 differential metabolites
were identified with significant differences. A total of 13 variables were obtained for their greatest contribution in the discriminating OPLS-DA model [variable importance in the projection (VIP) value >1.0], among which 11 metabolites were identified using both
VIP values (VIP >1) and the Wilcoxon test. These metabolites potentially revealed perturbations of glycolysis and of amino acid, fatty acid, cholesterol, and nucleotide metabolism of gastric cancer patients. These results suggest that gastric cancer serum
metabolic profiling has great potential in detecting this disease and helping to understand its metabolic mechanisms.
Key words: Metabolomics; Gastric cancer; Gas chromatography/mass spectrometry
Introduction
Correspondence: Jun-Sheng Peng, Department of Gastrointestinal Surgery, the Sixth Affiliated Hospital (Gastrointestinal and Anal
Hospital), Sun Yat-sen University, 26 Yuan Cun Er Heng Road, Guangzhou, Guangdong 510655, China. Fax: +86-20-3825-4221. E-mail: pengjunsheng@tom.com
Received March 6, 2011. Accepted November 11, 2011. Available online November 25, 2011. Published January 16, 2012. Gastric cancer is the fourth most common type of cancer
and the second most frequent cause of cancer mortality in the world (1,2). It is one of the most prevalent and deadly forms of cancers with nearly a million new cases diagnosed each year worldwide. A majority of the gastric cancer patients diagnosed at an already advanced stage, is the result of the relatively asymptomatic nature in the early stages of the disease and the lack of adequate screening methods. The prognosis of advanced cancer still remains poor because of its high recurrence rate and metastatic features (3). Gastros-copy is widely used for early screening, but this methodology
is invasive, uncomfortable and costly. An effective way to improve the prognosis is to predict the carcinogenesis and metastasis at an early stage, to understand the molecular mechanism of carcinogenesis, and to identify the biomarkers at the early diagnosis of human gastric cancer. Although some serum biomarkers have been studied as noninva-sive tools for screening gastric cancer (4,5), these serum tests are not available as screening or surveillance tests
because of their low specificity and sensitivity (5). However,
with the use of highly sensitive metabolomic techniques,
Serum metabolic fingerprinting of human gastric cancer 79
understand the molecular mechanism of carcinogenesis and help to noninvasively identify the potential biomarkers for an early diagnosis of human gastric cancer.
Metabolomics is a recently developed technology for the
detection, identification and quantification of low molecular
weight metabolites that are involved in the metabolism of an
organism at a specified time under specific environmental
conditions (6). This method has already been used as an effective tool for disease diagnosis (7), biomarker screening (8,9), and characterization of biological pathways (6). Recent technological advances in NMR spectroscopy and mass spectrometry (MS) have also further improved the sensitiv-ity and spectral resolution for cancer metabolomic study (10). Among various techniques conventionally used for
metabolic profiling, gas chromatography/MS (GC/MS) has
proven to be a robust metabolomic tool widely applied to the
identification and quantitation of cancer metabolites based
on its high sensitivity, peak resolution, and reproducibility (11). Since cancers are known to possess highly unique
metabolic profiles, identification of specific biomarkers in
serum using a metabolomic approach could be noninvasive and useful for early cancer detection and prognosis.
In the present study, we hypothesized that the global
analysis of metabolites in serum would define a metabolic
signature that discriminates gastric cancer patients from healthy controls. To test the hypothesis, we conducted a comprehensive analysis of the serum metabolites using GC/ MS. We aimed to determine whether variations in gastric
cancer metabolites are reflected in serum, thereby possi -bly creating an alternative, noninvasive means for cancer detection. The study also intended to gain knowledge of potential metabolic biomarkers associated with gastric cancer morbidity, which can be used for early diagnosis, staging, and therapeutic strategies.
Material and Methods
Sample collection and reagents
The study protocol was approved by the Review
Board of the Sixth Affiliated Hospital, Sun Yat-sen
University and written informed consent was ob-tained from all participants before the study. Thirty patients aged from 39 to 88 years were diagnosed with gastric cancer. The pathological diagnosis was
confirmed in routine histopathological H&E-stained
specimens and categorized according to
postopera-tive classification of malignant tumors (TNM) (12):
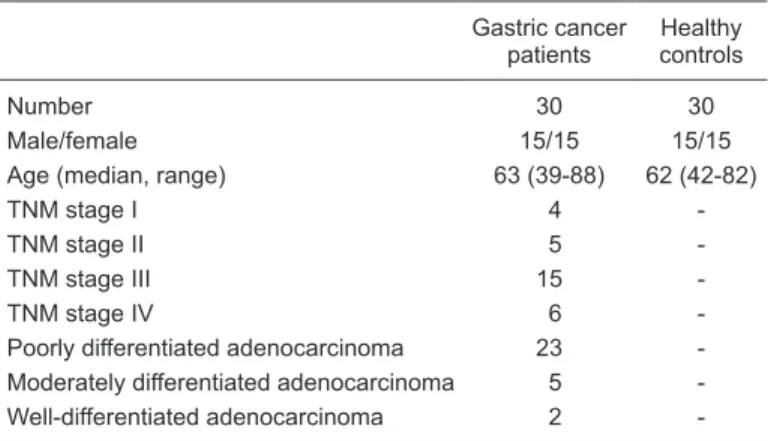
stage I, 4 patients; stage II, 5 patients; stage III, 15 patients; stage IV, 6 patients. None of the patients were diagnosed with metabolic diseases such as diabetes mellitus or hyperthyroidism and none receive any medication before sample collection. The normal control group consisted of 30 healthy
individuals aged 42 to 82 years, confirmed by gas -troscopy. Each gastric cancer patient was matched
with a healthy control based on gender and age. Clinical information about the participants is provided in Table 1. Venous blood (4 mL) was collectedin the morning after an 8-h fasting from a total of 30 gastric cancer patients and
30 healthy controls at the Sixth Affiliated Hospital, Sun
Yat-sen University.
Pyridine and N, O-Bis (trimethylsilyl)trifluoro-acetamide
(BSTFA) were purchased from Sigma-Aldrich (USA). Chro-matography grade methanol, ethyl acetate (EA), chloroform, and reference standards such as amino acids (methionine, phenylalanine, proline, lysine, tyrosine, and glutamate), fatty acids (lauric acid, palmitic acid, stearic acid, oleic acid, arachidonic acid), glucose, and cholesterol were purchased from Sijia Chemicals Group Corporation (China).
Specimen preparation for GC/MS analysis
Individual 100-µL serum samples were transferred to 2.0-mL Eppendorf tubes, lyophilized and extracted with 300 µL of a mixture of methanol/chloroform (3:1, v/v) and vortexed for 30 s (13). After storing for 10 min at -20°C, the samples were centrifuged at 12,000 g for 10 min at 4°C. A 200-µL aliquot of the supernatant was collected and transferred to 1.5-mL Eppendorf tubes. All samples were dried using liquid nitrogen and 50 µL EA was added to each of the dried serum extracts, and vortex-mixed for 1 min. A widely used derivatization reagent, a mixture of BSTFA, pyridine and EA (3:1:1, v/v/v), was then added to the extract for derivatization for 16 h at room temperature (14). The solution thus obtained was then vortexed for 1 min and transferred to an amber glass vial for GC/MS analysis. In order to prevent a batch effect, all assays were conducted in a random- and double-blind manner.
One milligram of reference standards including amino acids (methionine, phenylalanine, proline, lysine, tyrosine, and glutamate), fatty acids (lauric acid, palmitic acid, stearic acid, oleic acid, arachidonic acid), glucose, and cholesterol
Table 1. Summary of the anatomical and clinicopathological characteris-tics of the gastric cancer patients and healthy controls studied.
Gastric cancer patients
Healthy controls
Number 30 30
was dissolved in 5 mL pyridine to give a final concentra -tion of 200 µg/mL. Each 200 µL reference standard was transferred to 1.5-mL Eppendorf tubes and derivatized as described above and prepared for GC/MS analysis accord-ing to the methodology described below.
GC/MS analysis
Analysis was performed on an Agilent 7890A gas chro-matography system equipped with an Agilent 5975C Series autosampler (Agilent Technologies, USA). Separation was achieved on an Agilent DB-5MS capillary column (30 m x
0.25 mm ID x 0.25 μm film thickness). Each 2-µL aliquot of
the derivatized solution or derivatized reference standard was injected in the splitless mode and helium was used as
the carrier gas at a constant flow rate of 1.0 mL/min. The
temperatures of inlet, transfer line, ion source, and qua-drupole were maintained at 270°, 260°, 200°, and 150°C, respectively. The GC temperature programming was set to 2 min isothermal heating at 80°C, followed by 10°C/min oven temperature ramps to 180°C, 5° to 240°C/min, 20°
to 290°C/min, and a final 10-min maintenance at 290°C.
Data acquisition was achieved using MS in the electron impact mode at 70 eV and in the full-scan monitoring mode from m/z 30 to 600 with an acquisition rate of 20 spectra/s. Solvent delay time was set at 5 min.
Data processing and statistical analysis
GC/MS was employed to profile serum samples of gas -tric cancer patients and normal controls. Each sample or reference standard was represented by a GC/MS total ion current (TIC) chromatogram. Among the detected peaks, a multidimensional vector was constructed manually to
char-acterize the biochemical profile (14). Peaks due to column
bleeding and derivatization reagent were removed. Peaks were taken into account only when they were consistently detected in at least 80% of the samples. All the detected
peaks were identified by comparing the MS spectra (15)
with those available in the NIST mass spectral library (Wi-ley registry, 2008 edition) and customized reference mass spectral libraries (16). The mass spectra obtained were investigated manually and only those compounds with a matching probability of more than 80% were considered. The retention time and m/z data pairs were used as the
identifier for each peak within each sample and the ion
intensities for each peak were normalized to the sum of the peak intensities in that sample. To account for any dif-ference in concentration between samples, all data were normalized to a total value of 100.
Statistical analysis was performed using multivariate statistics combined with univariate statistics. Normalized data were exported to SIMCA-P + (Version 11.5, Umet-rics, Sweden) to perform orthogonal partial least squares discriminant analysis (OPLS-DA) and a model was built to identify variables that accounted for the differentiation of gastric cancer and non-gastric cancer cohorts, and
group-ing trends were observed in the data (17). Indication of
significance was based on non-parametric two-tailed paired
Wilcoxon analysis performed with SPSS 13.0 for Windows (SPSS, USA). P values of <0.05 were considered to be
statistically significant. The fold change (FC) was based
on the mean value of 30 gastric cancer patients relative to the mean of normal controls.
Results
GC/MS metabolic profiling and OPLS-DA modeling
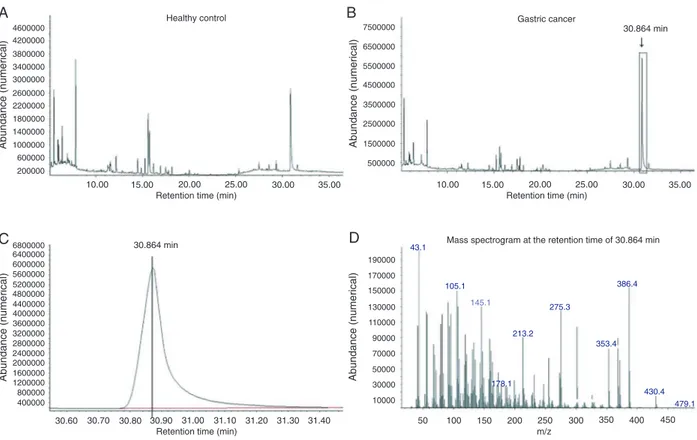
Typical GC/MS TIC chromatograms of serum samples from a gastric cancer patient and the matched normal con-trol are shown in Figure 1. Within one TIC chromatogram, over 60 signals were usually detected in a single specimen and some of these peaks were not investigated further as they were not consistently found in other sets of samples, too low in concentration, or of poor spectral quality to be
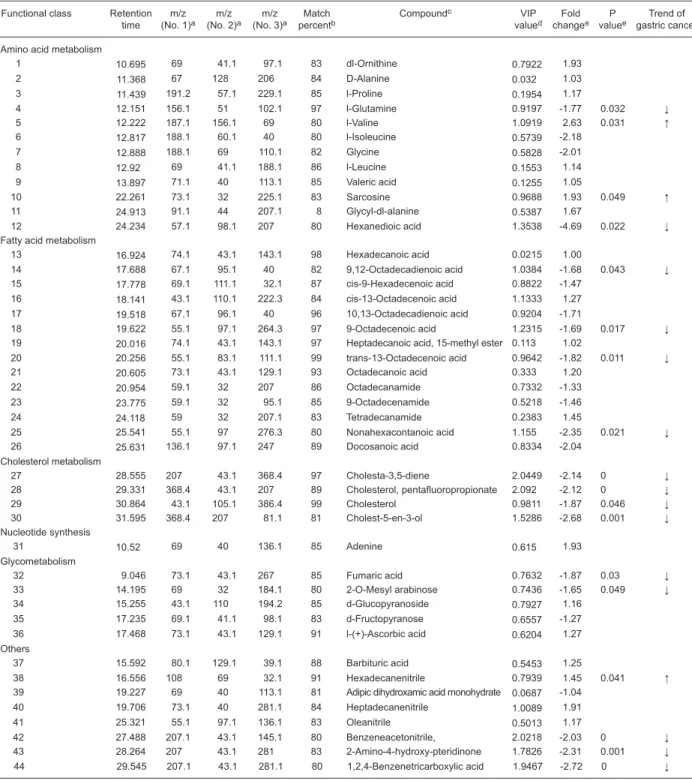
confirmed as metabolites. As shown in Table 2, a total of
44 endogenous metabolites such as amino acids, organic acids, carbohydrates, fatty acids, and steroids were de-tected sequentially and these compounds are involved in many biochemical processes in biosystems, such as energy metabolism, lipid metabolism and amino acid
metabolism. The first three fragment-ion m/z values with
the highest abundance within each fragmentation pattern and the matching percentage to the NIST library are also listed in Table 2.
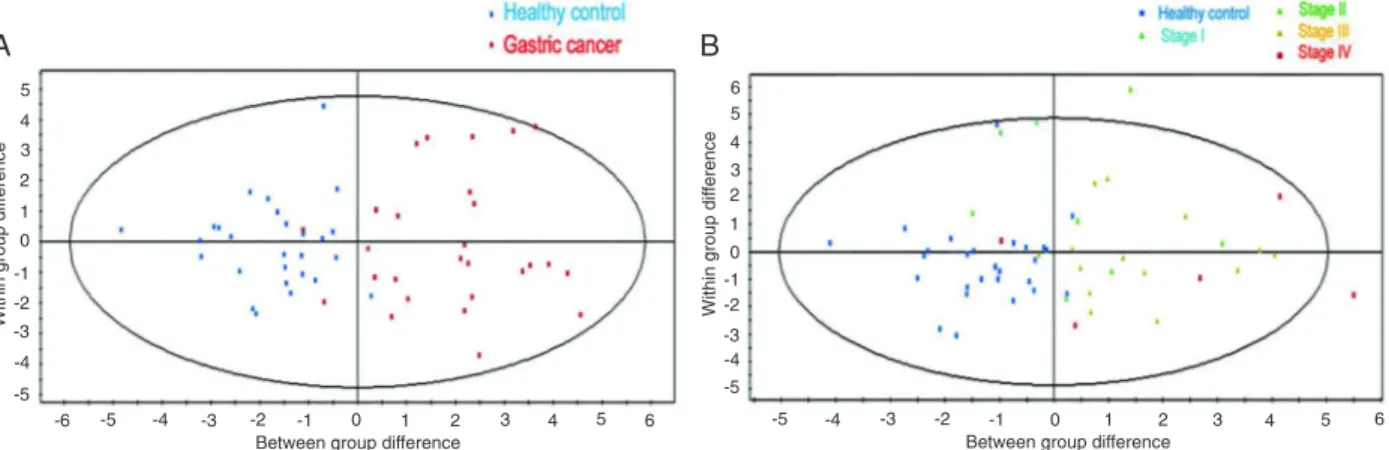
For the metabolic profile, the OPLS-DA model demon -strated satisfactory modeling and predictive abilities using one predictive component and three orthogonal components (R2Ycum = 0.745, Q2cum = 0.671). Distinct separation
trends were achieved between the metabolite profiles of the
two groups, as shown in Figure 2A. However, a separate OPLS-DA model using one predictive component and three orthogonal components (R2Ycum = 0.575, Q2cum = 0.0379) failed to discriminate different pathological stages (I-IV) of gastric cancer sera, although separation trends could be observed between the gastric cancer group and non-gastric cancer group as displayed in Figure 2B.
Analysis of highlighted metabolites
To identify which variables were accountable for such
significant separation, variable importance in the projection (VIP) statistics from OPLS-DA modeling was first used to
pre-select variables. As shown in Table 2, according to the criterion for VIP statistics (VIP >1), a total of 13 variables were obtained, which mostly contributed to discriminating
metabolic profiles between the two groups. The Wilcoxon
test (P < 0.05) was used to investigate the differences of biomolecules between gastric cancer patients and normal controls. A total of 18 metabolites including carbohydrates, amino acids, fatty acids, and steroids were detected with
significant differences, as displayed in Table 2. Only 3 of
Serum metabolic fingerprinting of human gastric cancer 81
tissues, while 15 were lower. Valine, showing the greatest fold change (FC = 2.63), was the serum metabolite found to be most increased in gastric cancer patients compared to controls and hexanedioic acid was the metabolite most depleted (FC = -4.69) in gastric cancer patients. Eleven
metabolites were identified using both VIP values (VIP >1)
and the Wilcoxon test (P < 0.05).
Discussion
Metabolic profiling of digestive cancer using GC/MS
has been reported (8,9,13,14,18), while few studies have
focused on the investigation of the metabolic profile of the
serum of gastric cancer patients. The present study explored
the serum metabolic fingerprints of gastric cancer patients
compared to healthy controls. Since the metabolomic data typically contain a large number of variables that are inter-related, a multivariate statistical method such as OPLS-DA coupled with a univariate statistical method such as the Wil-coxon test was usedand selection of differential metabolites
was performed with a threshold of 1.0 by VIP and a P value
set at 0.05, to identify variables with biological significance
as endpoints of altered biochemical pathways.
Previous studies have indicated that a supervised model could be a robust model for discrimination in multivariate analysis and the OPLS-DA model has been adopted to separate cancer and non-cancer cohorts in human col-orectal cancer tissue and serum specimen (13,14,18). The OPLS-DA model derived from our current metabolomic data showed satisfactory and adequate separation trends between the cancer and non-cancer groups, indicating
the diagnostic potential of serum metabolic profile. It has
been reported that the unsupervised principal component analysis model also could separate gastric cancer tissues from normal mucosa (19). Our attempt to stratify gastric cancer patients according to pathological stages (TNM I-IV) was not successful. A similar result has been reported for a serum study of colorectal cancer (13). We infer that metabolic perturbations may not be directly associated with the different pathological stages of gastric cancer, or that
Figure 1. Typical gas chromatography/mass spectrometry (GC/MS) total ion current (TIC) chromatograms. A and B show that, within one TIC chromatogram, over 60 signals were usually detected in a single gastric cancer serum or normal control serum specimen. C
shows a base peak at the retention time of 30.864 min that was extracted and magnified. D shows that the mass spectrogram at the
peak summit was selected and compounds were identified via mass spectral match to the National Institute of Standards and Technol
Table 2. Serum differential metabolites derived from gas chromatography/mass spectrometry analysis.
Functional class Retention time
m/z (No. 1)a
m/z (No. 2)a
m/z (No. 3)a
Match percentb
Compoundc VIP valued
Fold changee
P valuee
Trend of gastric cancer
Amino acid metabolism
1 10.695 69 41.1 97.1 83 dl-Ornithine 0.7922 1.93 2 11.368 67 128 206 84 D-Alanine 0.032 1.03 3 11.439 191.2 57.1 229.1 85 l-Proline 0.1954 1.17
4 12.151 156.1 51 102.1 97 l-Glutamine 0.9197 -1.77 0.032 ↓ 5 12.222 187.1 156.1 69 80 l-Valine 1.0919 2.63 0.031 ↑ 6 12.817 188.1 60.1 40 80 l-Isoleucine 0.5739 -2.18
7 12.888 188.1 69 110.1 82 Glycine 0.5828 -2.01 8 12.92 69 41.1 188.1 86 l-Leucine 0.1553 1.14 9 13.897 71.1 40 113.1 85 Valeric acid 0.1255 1.05
10 22.261 73.1 32 225.1 83 Sarcosine 0.9688 1.93 0.049 ↑ 11 24.913 91.1 44 207.1 8 Glycyl-dl-alanine 0.5387 1.67
12 24.234 57.1 98.1 207 80 Hexanedioic acid 1.3538 -4.69 0.022 ↓ Fatty acid metabolism
13 16.924 74.1 43.1 143.1 98 Hexadecanoic acid 0.0215 1.00
14 17.688 67.1 95.1 40 82 9,12-Octadecadienoic acid 1.0384 -1.68 0.043 ↓ 15 17.778 69.1 111.1 32.1 87 cis-9-Hexadecenoic acid 0.8822 -1.47
16 18.141 43.1 110.1 222.3 84 cis-13-Octadecenoic acid 1.1333 1.27 17 19.518 67.1 96.1 40 96 10,13-Octadecadienoic acid 0.9204 -1.71
18 19.622 55.1 97.1 264.3 97 9-Octadecenoic acid 1.2315 -1.69 0.017 ↓ 19 20.016 74.1 43.1 143.1 97 Heptadecanoic acid, 15-methyl ester 0.113 1.02
20 20.256 55.1 83.1 111.1 99 trans-13-Octadecenoic acid 0.9642 -1.82 0.011 ↓ 21 20.605 73.1 43.1 129.1 93 Octadecanoic acid 0.333 1.20
22 20.954 59.1 32 207 86 Octadecanamide 0.7332 -1.33 23 23.775 59.1 32 95.1 85 9-Octadecenamide 0.5218 -1.46 24 24.118 59 32 207.1 83 Tetradecanamide 0.2383 1.45
25 25.541 55.1 97 276.3 80 Nonahexacontanoic acid 1.155 -2.35 0.021 ↓ 26 25.631 136.1 97.1 247 89 Docosanoic acid 0.8334 -2.04
Cholesterol metabolism
27 28.555 207 43.1 368.4 97 Cholesta-3,5-diene 2.0449 -2.14 0 ↓ 28 29.331 368.4 43.1 207 89 Cholesterol, pentafluoropropionate 2.092 -2.12 0 ↓ 29 30.864 43.1 105.1 386.4 99 Cholesterol 0.9811 -1.87 0.046 ↓ 30 31.595 368.4 207 81.1 81 Cholest-5-en-3-ol 1.5286 -2.68 0.001 ↓ Nucleotide synthesis
31 10.52 69 40 136.1 85 Adenine 0.615 1.93 Glycometabolism
32 9.046 73.1 43.1 267 85 Fumaric acid 0.7632 -1.87 0.03 ↓ 33 14.195 69 32 184.1 80 2-O-Mesyl arabinose 0.7436 -1.65 0.049 ↓ 34 15.255 43.1 110 194.2 85 d-Glucopyranoside 0.7927 1.16
35 17.235 69.1 41.1 98.1 83 d-Fructopyranose 0.6557 -1.27 36 17.468 73.1 43.1 129.1 91 l-(+)-Ascorbic acid 0.6204 1.27 Others
37 15.592 80.1 129.1 39.1 88 Barbituric acid 0.5453 1.25
38 16.556 108 69 32.1 91 Hexadecanenitrile 0.7939 1.45 0.041 ↑ 39 19.227 69 40 113.1 81 Adipic dihydroxamic acid monohydrate 0.0687 -1.04
40 19.706 73.1 40 281.1 84 Heptadecanenitrile 1.0089 1.91 41 25.321 55.1 97.1 136.1 83 Oleanitrile 0.5013 1.17
42 27.488 207.1 43.1 145.1 80 Benzeneacetonitrile, 2.0218 -2.03 0 ↓ 43 28.264 207 43.1 281 83 2-Amino-4-hydroxy-pteridinone 1.7826 -2.31 0.001 ↓ 44 29.545 207.1 43.1 281.1 80 1,2,4-Benzenetricarboxylic acid 1.9467 -2.72 0 ↓
aThe first three fragment-ion m/z values with the highest abundance within each fragmentation pattern are listed. bThe matching
per-centage to the NIST library is listed. cMetabolites are identified using available standard reference or NIST library databases. dVariable
importance in the projection (VIP) was obtained by orthogonal partial least squares discriminant analysis (OPLS-DA) with a threshold of 1.0. eP value and fold change were calculated using the nonparametric Wilcoxon test (significance at P < 0.05). Fold change with
Serum metabolic fingerprinting of human gastric cancer 83
a limited sample number may not be effective enough to discriminate different TNM stages in the model.
The metabolic profile also revealed several marker
metabolites related to the metabolic disturbance in gastric cancer serum. First of all, perturbations of amino acid metabolism were noted in the present study. Valine was
observed to be significantly increased in gastric cancer
serum compared with healthy controls while glutamine
was found to be significantly decreased. Other amino
acids such as proline, isoleucine and leucine also varied,
although no statistically significance could be demonstrated.
Most cancer cells produce energy by glycolysis rather than oxidative phosphorylation via the tricarboxylic acid (TCA) cycle (20), termed as Warburg effect (21). As reported, an increase in valine has been detected in cancer tissue due to increased glycolysis (19). Increased levels of serum valine may be related to valine catabolism in cancer cells. In addi-tion, branched chain amino acids including valine, leucine and isoleucine share the same enzyme systems and are considered as a group to maintain amino acid homeostasis (22). This explains the opposite altered trends of different branch chain amino acids. Previous studies have shown that tumors consume large amounts of glutamine as an energy source. Malignant cells transport glutamine across the cytoplasmic membrane to form glutamate at a faster rate than their non-malignant counterparts (23). Glutaminase, which catalyzes glutamine to glutamate, has been found to
be overexpressed in tumor cells (24). Thus, our finding of
decreased glutamine levels in serum is consistent with the hypothesis that rapidly growing tumor cells use glutamine from serum as an energy source.
Several essential and non-essential amino acids have been found to be related to abnormal protein synthesis in
the process of carcinogenesis in colorectal cancer (14). The present results suggest that abnormal protein synthesis also occurs in gastric cancer cells and the altered amino acid levels could be the phenotypic markers in serum. In the present study in gastric cancer, sarcosine, but not glycine,
was found to be significantly elevated in gastric cancer
serum. It has been recently reported that the prevalence of sarcosine increases with escalating severity of prostate cancer as it progresses towards metastatic disease and amino acid metabolism increases along nitrogen break-down pathways (25). Sarcosine was further validated as a potential biomarker for early disease detection and as a predictor of aggressiveness because it was undetectable in any benign tissue samples. We infer that sarcosine may be a potential biomarker for the progression of gastric cancer metastasis.
Another notable feature of the analysis was alteration of fatty acid metabolism in serum from gastric cancer patients. The levels of a wide spectrum of fatty acids were found
to be significantly decreased in cancer sera compared
to normal controls. Fatty acid metabolic perturbation has been observed in several kinds of cancers. Saturated and
monounsaturated fatty acids were found to be significantly
elevated in serum of non-Hodgkin lymphoma patients, while linoleic acid and the levels of polyunsaturated fatty
acids were significantly reduced (26). The levels of a wide
spectrum of fatty acids, from C-12 to C-22, together with
various glycerols were found to be significantly elevated
in colorectal polyps and cancerous tissues compared to the adjacent normal mucosa (14). Decreased levels of palmitic acid, myristic acid and carnitine, the carrier of fatty acids, were observed in colorectal cancer sera compared to healthy controls (13). Fatty acids are used for both cell
membrane structural purposes and energy production, such
as β-oxidation. Fatty acid synthase is highly expressed
in many human cancers (27), leading to transcription-ally up-regulated fatty acid synthesis. The production of polyunsaturated fatty acids has also been associated with tumor cell proliferation, apoptosis, and tumor angiogenesis
(28,29). The present findings indicate that gastric cancer
cells consume a lot of fatty acids to meet the demand of cell membrane synthesis and energy production, resulting in the depletion of serum fatty acids.
The levels of cholesterol and intermediate products of cholesterol synthesis such as cholesta-3,5-diene and
cholest-5-en-3-ol were significantly decreased. Previous studies have confirmed increased levels of cholesterol
in colorectal cancer tissue (18) and serum cholesterol
levels were significantly lower in colon cancer, stomach
cancer, and oral cancer patients (30). Many experimental studies have observed a positive association of tumor cell proliferation with cholesterol synthesis, which is needed for new membrane biogenesis (31). The present result suggests that a large amount of cholesterol is utilized for biomembrane synthesis and serum cholesterol may be ingested by gastric cancer cells. Promotion of glycolysis and disruption of the TCA cycle occur in gastric cancer cells and the intermediate products such as fumaric acid and
α-ketoglutaric acid prominently increase in the metabolic profile of gastric cancer tissue (19). One crucial observation of the present study is that fumaric acid levels significantly
decreased in the gastric cancer serum, suggesting that marker metabolites in serum may not change in parallel with metabolic perturbations of tumor tissue. This observation may indicate an overutilization of the organic acid and that tumor cells adopt a complementary pathway to scramble for energy-rich metabolites to ‘fuel’ tumor growth. Increased levels of adenosine, monophosphates, xanthine, and
hy-poxanthine accompanied by a decrease of uric acid were found in colorectal cancer (14) while adenine was found to be about 1.93 times higher in concentration in gastric cancer patients compared to healthy controls in the present study. This suggests that the highly proliferative nature of cancer cells requires large quantities of these molecules for transmission of ATP and synthesis of nucleic acids. Our current study indicates that adenine, a compound for nucleotide synthesis, may be an indicator of abnormal cell proliferation.
With the use of highly sensitive metabolomic techniques, we were able to identify a metabolic signature in gastric cancer serum with multivariate and univariate statistical
significance. The unique metabolic profiles generated by
GC/MS revealed metabolic perturbations of amino acids, carbohydrate, fatty acids, cholesterol, and nucleotide. The results of this study also indicate the potential of this
suf-ficiently robust profiling approach for the detection of gastric
cancer. Metabolites such as valine, sarcosine, hexanedioic acid, and cholesterol could be possibly potential biomarkers and need to be validated. A limitation of the current study was that many differential endogenous biomarkers as well as macromolecular metabolites are worth exploring further
and yet to be identified. Serum metabolic profile has great
potential in detecting gastric cancer and helping to under-stand its underlying mechanisms.
Acknowledgments
We thank the patients for taking part in this study. We are grateful to the National Engineering Research Center of Genetic Medicine, Ji Nan University, for technical support. Research supported by the Science Technology Develop-ment Program of Guangdong (#2008B030301105).
References
1. Parkin DM, Bray F, Ferlay J, Pisani P. Global cancer statis-tics, 2002. CA Cancer J Clin 2005; 55: 74-108.
2. Crew KD, Neugut AI. Epidemiology of gastric cancer. World J Gastroenterol 2006; 12: 354-362.
3. Cunningham D, Chua YJ. East meets west in the treatment of gastric cancer. N Engl J Med 2007; 357: 1863-1865. 4. Vaananen H, Vauhkonen M, Helske T, Kaariainen I,
Rasmus-sen M, Tunturi-Hihnala H, et al. Non-endoscopic diagnosis of atrophic gastritis with a blood test. Correlation between gastric histology and serum levels of gastrin-17 and pep-sinogen I: a multicentre study. Eur J Gastroenterol Hepatol
2003; 15: 885-891.
5. Miki K, Morita M, Sasajima M, Hoshina R, Kanda E, Urita Y. Usefulness of gastric cancer screening using the serum pepsinogen test method. Am J Gastroenterol 2003; 98: 735-739.
6. Nicholson JK, Connelly J, Lindon JC, Holmes E. Metabo-nomics: a platform for studying drug toxicity and gene
func-tion. Nat Rev Drug Discov 2002; 1: 153-161.
7. Wikoff WR, Gangoiti JA, Barshop BA, Siuzdak G.
Metabo-lomics identifies perturbations in human disorders of propi -onate metabolism. Clin Chem 2007; 53: 2169-2176. 8. Xue R, Lin Z, Deng C, Dong L, Liu T, Wang J, et al. A serum
metabolomic investigation on hepatocellular carcinoma pa-tients by chemical derivatization followed by gas chromatog-raphy/mass spectrometry. Rapid Commun Mass Spectrom
2008; 22: 3061-3068.
9. Wu H, Xue R, Lu C, Deng C, Liu T, Zeng H, et al. Metabolo-mic study for diagnostic model of oesophageal cancer using gas chromatography/mass spectrometry. J Chromatogr B Analyt Technol Biomed Life Sci 2009; 877: 3111-3117.
10. Griffin JL, Shockcor JP. Metabolic profiles of cancer cells.
Nat Rev Cancer 2004; 4: 551-561.
Serum metabolic fingerprinting of human gastric cancer 85
metabolomic analyses. Anal Chem 2005; 77: 5635-5642.
12. Sobin LH, Fleming ID. TNM Classification of Malignant
Tumors, Fifth Edition (1997). Union Internationale Contre le Cancer and the American Joint Committee on Cancer.
Cancer 1997; 80: 1803-1804.
13. Qiu Y, Cai G, Su M, Chen T, Zheng X, Xu Y, et al. Serum
metabolite profiling of human colorectal cancer using
GC-TOFMS and UPLC-QGC-TOFMS. J Proteome Res 2009; 8: 4844-4850.
14. Ong ES, Zou L, Li S, Cheah PY, Eu KW, Ong CN. Metabolic
profiling in colorectal cancer reveals signature metabolic shifts
during tumorigenesis. Mol Cell Proteomics 2010 (in press). 15. Gorgenyi M, Fekete ZA, Van Langenhove H, Dewulf J.
Tem-perature dependence of the Kovats retention index. Convex or concave curves. J Chromatogr A 2008; 1206: 178-185. 16. Denkert C, Budczies J, Kind T, Weichert W, Tablack P,
Se-houli J, et al. Mass spectrometry-based metabolic profiling
reveals different metabolite patterns in invasive ovarian car-cinomas and ovarian borderline tumors. Cancer Res 2006; 66: 10795-10804.
17. Trygg J, Holmes E, Lundstedt T. Chemometrics in metabo-nomics. J Proteome Res 2007; 6: 469-479.
18. Chan EC, Koh PK, Mal M, Cheah PY, Eu KW, Backshall A,
et al. Metabolic profiling of human colorectal cancer using
high-resolution magic angle spinning nuclear magnetic reso-nance (HR-MAS NMR) spectroscopy and gas chromatogra-phy mass spectrometry (GC/MS). J Proteome Res 2009; 8: 352-361.
19. Wu H, Xue R, Tang Z, Deng C, Liu T, Zeng H, et al. Me-tabolomic investigation of gastric cancer tissue using gas chromatography/mass spectrometry. Anal Bioanal Chem
2010; 396: 1385-1395.
20. Hirayama A, Kami K, Sugimoto M, Sugawara M, Toki N,
Onozuka H, et al. Quantitative metabolome profiling of
colon and stomach cancer microenvironment by capillary
electrophoresis time-of-flight mass spectrometry. Cancer
Res 2009; 69: 4918-4925.
21. Warburg O. On the origin of cancer cells. Science 1956; 123: 309-314.
22. Landel AM, Hammond WG, Meguid MM. Aspects of amino acid and protein metabolism in cancer-bearing states. Can-cer 1985; 55: 230-237.
23. Medina MA. Glutamine and cancer. J Nutr 2001; 131: 2539S-2542S.
24. DeBerardinis RJ, Lum JJ, Hatzivassiliou G, Thompson CB. The biology of cancer: metabolic reprogramming fuels cell growth and proliferation. Cell Metab 2008; 7: 11-20. 25. Sreekumar A, Poisson LM, Rajendiran TM, Khan AP, Cao
Q, Yu J, et al. Metabolomic profiles delineate potential role
for sarcosine in prostate cancer progression. Nature 2009; 457: 910-914.
26. Cvetkovic Z, Vucic V, Cvetkovic B, Petrovic M, Ristic-Medic D, Tepsic J, et al. Abnormal fatty acid distribution of the se-rum phospholipids of patients with non-Hodgkin lymphoma.
Ann Hematol 2010; 89: 775-782.
27. Kuhajda FP. Fatty acid synthase and cancer: new application of an old pathway. Cancer Res 2006; 66: 5977-5980. 28. Hyde CA, Missailidis S. Inhibition of arachidonic acid
me-tabolism and its implication on cell proliferation and tumour-angiogenesis. Int Immunopharmacol 2009; 9: 701-715. 29. Lu X, Yu H, Ma Q, Shen S, Das Undurti N. Linoleic acid
sup-presses colorectal cancer cell growth by inducing oxidant stress and mitochondrial dysfunction. Lipids Health Dis
2010; 9: 106.
30. Abiaka C, Al-Awadi F, Al-Sayer H, Gulshan S, Behbehani A, Farghally M, et al. Serum antioxidant and cholesterol levels in patients with different types of cancer. J Clin Lab Anal
2001; 15: 324-330.