Acta Limnologica Brasiliensia, 2016, vol. 28, e30 http://dx.doi.org/10.1590/S2179-975X1616 ISSN 0102-6712
Gas emission from anaerobic decomposition of plant resources
Emissão de gases durante a decomposição anaeróbia de recursos vegetais
Marcela Bianchessi da Cunha-Santino1,2*, Alexandre Luccas Bitar2 and Irineu Bianchini Junior1,2
1 Departamento de Hidrobiologia, Universidade Federal de São Carlos – UFSCar, Rodovia Washington Luiz, Km 235, CP 676, CEP 13565-905, São Carlos, SP, Brazil
2 Programa de Pós-graduação em Ecologia e Recursos Naturais, Universidade Federal de São Carlos – UFSCar, Rodovia Washington Luiz, Km 235, CP 676, CEP 13565-905, São Carlos, SP, Brazil *e-mail: cunha_santino@ufscar
Cite as: Cunha-Santino, M.B., Bitar, A.L. and Bianchini Junior, I. Gas emission from anaerobic decomposition of plant resources. Acta Limnologica Brasiliensia, 2016, vol. 28, e30.
Abstract: Aim: The aim of this study was to quantify the emission rates of gases resulting from the anaerobic decomposition of different plant resources under conditions usually found in sediments of tropical aquatic systems and drained organic soils. Methods: Incubations were prepared with green leaves, bark, twigs, plant litter, sugarcane stalks and leaves, soybean leaves, grasses, forest leaves and an aquatic macrophyte (Typha domingensis). Over 10 months, the daily volume of gas evolved from decay was measured and a kinetic model was used to describe the anaerobic mineralization. Results: Using the mathematical model, it can be observed that the composition of the plant resources is heterogeneous. The temporal variation of the gas rates indicated that the mineralization of the labile fractions of detritus varied, on a carbon basis, from 16.2 (bark) to 100% (samples composed of leaves, grasses and sugar cane stalks). High gas emissions were observed during the mineralization of grasses, sugar cane stalks, leaves and plant litter, while low volumes of gases were measured during the mineralization of bark, twigs, forest leaves and T. domingensis, which are the most fibrous and recalcitrant resources (carbon content: 83.8, 78.2, 64.8 and 53.4%, respectively). The mineralization of labile carbon presented half-life values, which varied from 41 (twigs) to 295 days (grasses). Conclusions: Considering the high amount of remaining recalcitrant fraction, the anaerobic decomposition of these plant resources showed a strong trend towards accumulating organic matter in flooded soils. Despite the higher temperatures found in the tropical environment, these environments represent a sink of particulate detritus due to its slow decomposition.
Keywords: anaerobic decomposition; kinetic parameters; manometric method; cycling model; aquatic environments; drained organic soils.
Resumo: Objetivo: Este estudo teve como objetivo quantificar as taxas de emissão de gases resultante da decomposição anaeróbia de diferentes recursos vegetais em condições usualmente encontradas em sedimentos de sistemas aquáticos tropicais e solos orgânicos drenados. Métodos: As incubações foram preparadas com folhas verdes, cascas, galhos, serapilhera, talos e folhas de cana-de-açúcar, folhas de soja, gramíneas, folhas de foresta e uma macrófita aquática (Typha domingensis). Durante 10 meses, o volume diário de gás liberado pela decomposição foi medido e um modelo cinético foi utilizado para descrever a mineralização anaeróbia. Os modelos consideraram a heterogeneidade dos recursos vegetais. Resultados: A variação temporal das taxas de gases indicou que a mineralização das frações lábeis dos detritos variaram, em uma base de carbono, de 16,2 (cascas) a 100% (amostras compostas de folhas, gramíneas e talo de cana-de-açúcar). Foi observada uma elevada emissão de gás durante a mineralização das gramíneas, talo de cana de açúcar, amostra compostas de folhas e serapilhera, enquanto que baixos volumes de gases foram medidos durante a mineralização de cascas, galhos,
Anaerobic decomposition occurs through electron acceptors, such as NO3-, SO
42-, CO2 and
Fe (III) rather than molecular oxygen (Liesack et al., 2000). In the final stage of the carbon turnover in flooded soils, the organic carbon compounds form inorganic gases (Smith et al., 2003). The pathways for methane production and the relative concentration of methane in comparison to other evolved gases are not completely established for waterlogged environments, as metabolic pathways depend on the properties and concentrations of substrates (Praeg et al., 2016). In decomposition, methane is the most stable carbon compound in anaerobic environments, and is the most important intermediate compound in remineralization of organic matter (Utsumi et al., 1998).
Anaerobic decomposition takes place in inland organic soils, including forests, grassland and croplands areas (such as paddy rice soils) that represent the main environments for decomposition in waterlogged soils (IPCC, 2014). During cycling of organic matter from plant resources, the end product of anaerobic metabolism is an important source of greenhouse gas, due to the fact that considerable amounts of CH4 and CO2 are released
into the atmosphere. C-CO2 and C-CH4 emission from drained cropland soil in tropical climate zones is 14 tons of C ha-1 year-1 and 7.0 kg of C ha-1year-1,
respectively (IPCC, 2014). Tropical flooded soils are important sources of greenhouse gases due to the constant decomposition processes; therefore, understanding the kinetics of decomposition is essential to follow the process of carbon emissions within these systems.
Under anaerobic conditions, the production of C-gaseous (CO2 and CH4) increased with the temperature indicating a greater sensitivity of microorganisms, especially methanogenesis to temperature. This result indicates the importance of the detritus type that undergoes decomposition in warmer subtropical and tropical wetland regions (Inglett et al., 2012). The present study attempts to model the yield of anaerobic gases released during decomposition of different types
1. Introduction
A layer of detritus composed of decomposing plant resources (such as forest leaves or agricultural residues) is a continuous source of energy for heterotrophic organisms. The cycling of organic materials in waterlogged soil is a dynamic process influenced by the climate (driven by temperature), type of vegetation resource (chemical composition: such as content of lignin and cellulose) and type of heterotrophic metabolism as the aerobic and anaerobic processes (Bot & Benites, 2005).
Extensive periods of water saturation lead to poor aeration of soils favoring the anaerobic transformation processes of organic matter. When the plants enter in senescence in waterlogged soils and wetlands, riparian zones or floodplains, the detritus undergoes decomposition. The continuous input of organic matter contributes intensively to the carbon turnover in these environments. The study of decomposition in flooded systems is complex considering the interaction of driving forces such as substratum heterogeneity, dissolved oxygen gradient availability (Noll et al., 2005), activities from various types of microorganisms (e.g. bacteria and archaea;Breidenbach & Conrad, 2015). Considering the carbon cycle, decomposition comprises essentially leaching and microbial catabolism (Hossain et al., 2014), while mineralization involves the complete oxidation of detritus organic compounds by biochemical reactions yielding inorganic products (aerobic condition: CO2 and anaerobic condition: CH4 and CO2). The temporal changes of the detritus
type and chemical composition associated to the environmental factors (such as soil redox potential, moisture, acidity, temperature) determine the types of microorganisms that mediate the cycling processes (Megonigal et al., 2005). Intrinsic factors i.e., when the substrates control positively (low lignin content, high content of P and N) or negatively (Higher C:N and C:P ratio) the decomposition rates (Magee, 1993).
amostra composta de folhas da floresta e T. domingensis que representam os detritos mais fibrosos e recalcitrantes (teor de carbono: 83,8, 78,2, 64,8 e 53,4%, respectivamente). A mineralização do carbono lábil apresentou valores de meia-vida que variaram de 41 (galhos) a 295 dias (gramíneas).
Conclusões: Considerando a quantidade elevada de detritos refratários remanescentes, a decomposição anaeróbica desses recursos vegetais indicou grande tendência ao acúmulo de matéria orgânica nos solos encharcados, apesar das temperaturas mais elevadas encontradas no ambiente tropical, esses ambientes representam um sumidouro de detrito particulado devido à sua decomposição lenta.
of organic matter (green leaves, barks, twigs, plant litter, sugar cane stalks and leaves, soybean leaves, grasses, forest leaves and Typha domingensis, an aquatic macrophyte) in tropical flooded systems, especially regarding drained or waterlogged organic soils. We hypothesized that more refractory resources such as bark, twigs, sugarcane stalks and T. domingensis would present a low yield of gas emission during anaerobic decomposition. In this study, the aim was to quantify gas emission rates from the decay of these plant resources, under simulated conditions (high temperature and anaerobiosis) usually prevailing in tropical ecosystems. Furthermore, we used a mathematical model to predict the yield and pathways of C-gases emitted from anaerobic mineralization during decay of organic resources in order to support studies related to greenhouse gas inventories, as currently requested by the Intergovernmental Panel on Climate Change (IPCC, 2006, 2014). Our findings will provide additional information about carbon gas emissions from tropical waterlogged soils.
2. Material and Methods
2.1. Sampling procedures and experimental design of decomposition kinetics experiments
Samples of different type of green leaves, bark, twigs, plant litter and an aquatic macrophyte (Typha domingensis Pers.) were collected in two adjacent areas of the Paranapanema River (municipality of Cândido Mota, São Paulo State, Brazil: 1st area: 22° 56’ 6” S and 50º 26’ 51’ 2” W;
2nd area: 22° 56’ 1.1” S and 50º 27’ 59.2” W)
situated in the Brazilian Atlantic Forest. The plant resources (ca. 5 kg) were acquired from the following vegetation types: grasslands, semideciduous forest remnants (only plant litter), fragments of secondary vegetation, reforestation areas, wetlands and different croplands (soybeans, wheat, rice, sugar cane and maize). Then, after being washed, the plant material was immediately oven-dried (45 ºC; Harmon et al., 1999) and fragmented; the fragments (size ca. 1.5 cm) of leaves, thin twigs (diameter < 1.0 cm), bark and plant litter were homogenized. The criteria used to select the vegetation types were based on the forest inventories in the section of the Paranapanema basin (CESP, 1990) that provided detailed information the about type of plants, the extent and conditions of each type. The selection of these types of plant resources is to address the different qualities of detritus (i.e. chemical composition), which is the most important determinant of long-term decomposition rates
(Aerts, 1997). The plant resources were selected according to this inventory: reforestation (0.3%), semi deciduous forest (6.4%), secondary forest (2.4%); floodplain areas (9.8%); pasture (44.9%) and crops: soybeans and wheat (22.4%), rice (9.6%) and sugar cane (4.2%). Litter samples were obtained only from semi deciduous forests. The composite samples of twigs and bark were obtained from areas with secondary vegetation, forest and reforestation. In addition to the composite samples (leaves, bark and twigs), six types of plant resources were used: leaves and sugar cane stalks (Saccharum officinarum
L.), soybean leaves (Glycine max (L.) Merr.), leaves and stalks of T. domingensis (cattail), grasses and a composite of forest (i.e. semideciduous forest, reforestation and secondary vegetation) leaves. The carbon contents of these resources were quantified by complete and instantaneous oxidation of the sample by flash combustion using a Carlo Erba Model EA1108 Elemental Analyzer.
Mineralization chambers (n = 2) were prepared for composite samples of leaves, bark, twigs, plant litter and T. domingensis. As well as the mixture of resource types, single mineralization chambers with non-mixed resources (sugar cane stalks and leaves, soybean leaves, grasses and forest leaves) were set up. The incubations were maintained under anaerobic conditions, which was achieved by bubbling nitrogen until the dissolved oxygen (DO) concentration was below detection level (0.03 mg L-1; DO meter YSI, model 58). In each
mineralization chamber, 5.0 g (on dry weight basis; DW) of plant fragments were added to 1.0 L of river water previously filtered (0.45 µm pore size membrane, Millipore).
Water sampling occurred one day before the beginning of experiment in the Paranapanema River, in the stretch between the two regions used to collect the plant material (22º 56’ 36.3” S and 50º 27’ 57.3” W). During transportation, no preservative substances were added to the water samples. The limnological characteristics of water the samples are shown in Table 1.
to avoid bottle pressurization. At the end of the experiment, the pH (pH-meter Digimed, model DMPH-2), the dissolved organic (DOC) and inorganic carbon (DIC) were measured using the combustion/non-dispersive infrared gas analysis method (Shimadzu analyzer, model 5000A; precision: 0.1 to 1.0 mg L-1 and internal standards:
sodium carbonates (NaHCO3 and Na2CO3; 1.65:1 w/w) and potassium hydrogen phthalate).
To obtain the carbon mass balance in the anaerobic incubations, the remaining detritus (after 295 days) was oven-dried (45° C) and gravimetrically quantified. The carbon contents of particulate detritus were also quantified (Elemental Analyzer Carlo Erba, model EA1108). The total inorganic carbon (TIC) deriving from mineralization of organic matter was calculated by the difference between their initial C contents of resources and the remaining organic carbon measured at the end of the experiment, according to Equation 1.
= + − +
TIC (POCi DOC ) (POCi f DOC )f (1)
where: POCi = particulate organic carbon of resource; DOCi = initial content of dissolved organic carbon of incubation; POCf = organic carbon content of remaining particulate detritus; DOCf = dissolved organic carbon of incubation at the end of the experiment.
The remaining DOC and POC measured at the end of the experiment were considered as recalcitrant material, referred to as RDOC and RPOC, respectively. The total concentration of C-gases (i.e. CO2 + CH4) was estimated by the difference between TIC and DICf, therefore the mineralized carbon (MC) was calculated as C-gases + DICf.
Considering the extended duration of the experiments, we assumed that the accumulated MC represented the labile organic carbon (LOC) from detritus and the amount of remaining detritus carbon (POCf + DOCf) was defined as recalcitrant organic carbon (ROC).
2.2. Mathematical modeling and statistical analysis
The traditional exponential model (Jenny et al., 1949) was used to represent the overall mineralization process. We assumed that plant resources were a heterotrophic substrate from the substrate quality point of view and the mineralization rate constant (k) was determined from the experimental results using Equations 2 to 5.
For accurate measurements of greenhouse gas emission from wetlands, we used the approach (Tier 3: concerning mathematical models of biogeochemical cycles) recommended in the Guidelines for National Greenhouse Gas Inventories by the IPCC (2006). The mathematical model encompasses two mass loss pathways: i) an easily degradable (labile organic carbon - LOC) compounds and ii) a slow process related to the mineralization of recalcitrant pools (recalcitrant organic carbon - ROC) compounds (Reddy & DeLaune, 2008). The temporal evolution of accumulated MC during anaerobic decomposition was used to determine the labile mineralization coefficients (kL) and the LOC and ROC proportions of the detritus, but the kinetic fitting does not differentiate the particulate from the dissolved fraction. Regarding the extremely low refractory mineralization coefficient (kR), we assume a constant value (0.0002 day-1; half-time 3465 days) according
to Coûteaux et al. (1998). MC was quantified by the integration of positive daily rates and the final volume (ml) was proportional to the TIC (Equation 1).
The model was validated using a linear regression comparing the experimental data obtained for MC (mass budget on a carbon basis; Equation 1) and the data from the simulation with Equation 4 on the 295th day. The kinetic curves were fitted to
non-linear regressions using the iterative algorithm of Levenberg-Marquardt (Press et al., 2007).
= −
LOC k LOC
L
dt (2)
= −
ROC k ROC
R
dt (3)
= +
MC k LOC k ROCL R (4)
Table 1. Limnological characteristics of water from Paranapanema River (CESP, 1990), where: NO3- = nitrate, NO2- = nitrite, NH
4+= ammonium, BOD5 = biochemical oxygen demand.
Limnological variable Mean SD
pH 7.3 0.8
Dissolved oxygen (mg L-1) 7.5 0.9
Dissolved organic carbon (mg L-1) 2.04 0.02
Dissolved inorganic carbon (mg L-1) 5.65 0.06
Total phosphorus (µg L-1) 30.8 19.0
Dissolved phosphorus (µg L-1) 16.2 13.0
NO3- (µg L-1) 245.1 119.2
NO2- (µg L-1) 2.0 1.2
NH4+ (µg L-1) 125.9 90.9
Electric conductivity (µS cm-1) 56.0 8.6
where LOC = labile fraction of organic carbon (%); ROC = recalcitrant fraction of organic carbon (%); kL = LOC mineralization rate constant (day-1);
kR = ROC mineralization rate constant (day-1).
The analytical integration of Equation 5 leads to:
− −
= × − k tL + × − k tR
MC LOC (1 e ) ROC (1 e ) (5)
The half-time (t½) of the processes were estimated according to Equation 6.
= − ln 0.5
t 1 ks
2 (6)
where k = rate constants for mineralization. The values of the temporal variation of gases evolved were submitted to the Kolmogorov-Smirnov test to check distribution normality and to the Bartlett test to verify homoscedasticity. As these conditions were satisfied, the accumulated volume of the evolved gases (n = 295 per organic substrate) was submitted to ANOVA-repeated measures. Significantly different types of resources were compared using the Tukey multiple comparisons
test with a significance level of 0.001. The software used in the statistics analyses was PAST version 2.16 (Hammer et al., 2001).
3. Results
The anaerobic process containing soft plant resources such as leaves, grasses and plant litter generated the highest amounts of gases (mean: 257 ml, ranging from 121 ml for forest leaves to 305 ml for sugar cane leaves) (Table 2). Except for during the decomposition of sugar cane stalks, the more refractory detritus (twigs, bark and T. domingensis) emitted the lowest volumes of gases (bark = 24.7 ml; twigs = 72.6 ml, and
T. domingensis = 196.2 ml), consequently leaving the highest amounts of organic matter after 295 days (bark = 84.7%; twigs = 78.9% and
T. domingensis = 53.3%). For all types of plant detritus, the recalcitrant DOC (RDOC, Table 2) contents were similar; varying between 2.8 to 6.1% compared to the initial pH values of the water sample (Table 1). For all incubations, the pH values
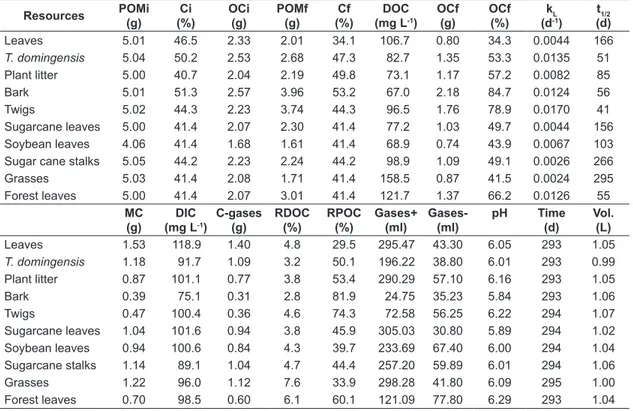
Table 2. Initial and final amounts of resources, carbon budget and experimental parameters derived from anaerobic decomposition of the different plant resources.
Resources POMi
(g)
Ci (%)
OCi (g)
POMf (g)
Cf (%)
DOC (mg L-1)
OCf (g)
OCf (%)
kL (d-1)
t1/2 (d)
Leaves 5.01 46.5 2.33 2.01 34.1 106.7 0.80 34.3 0.0044 166
T. domingensis 5.04 50.2 2.53 2.68 47.3 82.7 1.35 53.3 0.0135 51
Plant litter 5.00 40.7 2.04 2.19 49.8 73.1 1.17 57.2 0.0082 85 Bark 5.01 51.3 2.57 3.96 53.2 67.0 2.18 84.7 0.0124 56 Twigs 5.02 44.3 2.23 3.74 44.3 96.5 1.76 78.9 0.0170 41 Sugarcane leaves 5.00 41.4 2.07 2.30 41.4 77.2 1.03 49.7 0.0044 156 Soybean leaves 4.06 41.4 1.68 1.61 41.4 68.9 0.74 43.9 0.0067 103 Sugar cane stalks 5.05 44.2 2.23 2.24 44.2 98.9 1.09 49.1 0.0026 266 Grasses 5.03 41.4 2.08 1.71 41.4 158.5 0.87 41.5 0.0024 295 Forest leaves 5.00 41.4 2.07 3.01 41.4 121.7 1.37 66.2 0.0126 55
MC (g)
DIC (mg L-1)
C-gases (g)
RDOC (%)
RPOC (%)
Gases+ (ml)
Gases- (ml)
pH Time
(d)
Vol. (L)
Leaves 1.53 118.9 1.40 4.8 29.5 295.47 43.30 6.05 293 1.05
T. domingensis 1.18 91.7 1.09 3.2 50.1 196.22 38.80 6.01 293 0.99
of all the incubations was lower at the end of the experiments (p < 0.0001; t = 32.724), varying from 5.84 (barks) to 6.22 (twigs). A relationship (linear) between the volumes of produced gases and the final amounts of MC (r2 = 0.93) and between
the C-gases and MC (r2 = 0.99) are presented in
Figure 1. Regardless of the mineralization yield, the relation between C-gases and C-MC indicates that ca. 90% of the mineralized carbon was released in gas form, while 10% was maintained dissolved (as DIC; Table 2). The final amounts of gases assimilated (total of negative rates) were not correlated with mineralized carbon or DIC concentrations (Table 2).
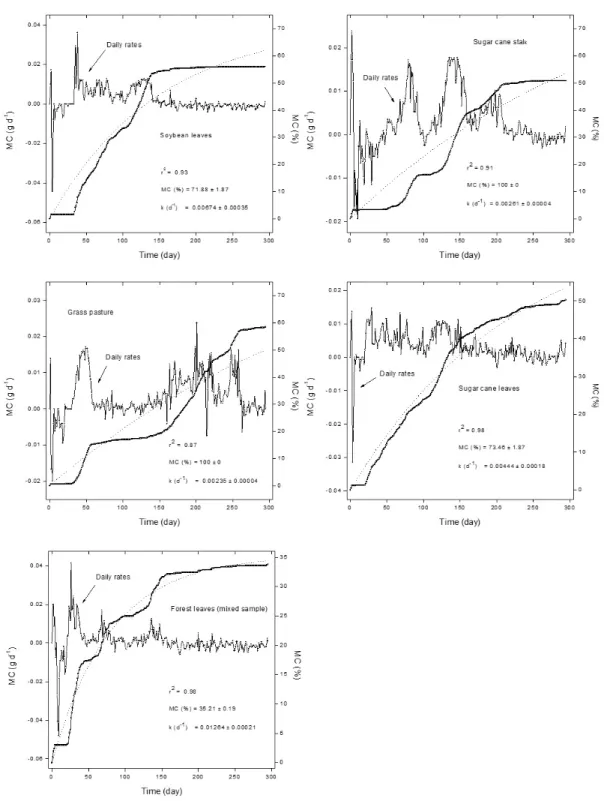
Figures 2 and 3 show the daily rates for the formation (positive values) and uptake (negative values) of gases and the amounts of gas accumulated during mineralization of plant resources (MC). For all resources, the mineralization exhibited three well defined phases: the first, which lasted ca. 3 days, was characterized by a predominance of gas formation. Assimilation dominated in the second phase that lasted throughout the 15 days. The third phase was characterized by an early high rate of gas formation, which tended to decrease slowly. This phase lasted until approximately the end of the 5th month. From the 5th month, the formation
rates tended towards zero or showed negative values (for soybean leaves and forest leaves) as in the first day of incubation (Figure 3).
Anaerobic decay occurred in three phases, but the kinetics of gas formation (MC curves) was significantly different (p < 0.001; F = 502.7; df = 2939) among plant resources, except between twigs and forest leaf incubations (p = 0.09836); grasses and sugar cane stalks (p = 0.9629); soybean leaves and T. domingensis (p = 0.9984) and; plant litter and sugar cane leaves (p = 0.9929). Considering the kinetic model, the half-life of mineralization (kL) was estimated to vary between 41 (twigs) and 295days (grasses); with an average of 127 days (Table 2). Equation 5 and a linear regression (where: x = 0 and y = 0) fitted the experimental (TIC) data for MC at 295 days (r2 = 0.97), with theoretical
values being only ca. 3% lower.
4. Discussion
The gas formation evolved in the first stage of anaerobic decomposition from organic resources (green leaves, bark, twigs, plant litter, sugar cane stalks and leaves, soybean leaves, grasses, forest leaves and Typha domingensis) was attributed to catabolic processes involving the oxidation of labile compounds. The heterotrophic microorganisms rapidly metabolized the easily decomposable compounds, such as soluble carbohydrates, primarily fats and proteins. Considering the early stage of fermentation pathways, the organic acids with low molecular mass were also formed (Adekunle & Okolie, 2015). The phase in which the assimilation predominated over the gas formation (negative rates) arises from the prevalence of mineralized compounds and is used to form and maintain the microbial biomass (e.g. reversible carboxylation, anaerobic methane oxidation; Megonigal et al., 2005). The negative rates observed in the decomposition chambers were also related to CO2 dissolution that generates the carbonates as found in a freshwater marsh (Neubauer & Anderson, 2003). The proportion for C-gases and CID (9:1) was similar to those reported for CO2 and CH4 emission from anaerobic decomposition of aquatic plants (Bianchini Junior et al., 2010); emphasizing the important contribution of these carbon greenhouse gases from the decomposition of organic resources addressed in the present study. Considering the duration of the experiments and the usually relative low leachate potential for the plant resources (leaching yield: 5.9 ± 0.9 to 30.5 ± 2.1%), as reported by Bärlocher (2005), the RDOC values were high, characterizing the recalcitrance characteristic of DOC. The refractory characteristics of DOC found in anaerobic decay Figure 1. Relation among mineralized carbon (MC)
qualified these fractions as a sink of carbon in flooded soils. The remaining dissolved organic matter is characterized as resynthesis compounds (humic substances) deriving from hydrolytic enzyme action (Steinberg, 2003; Berg & McClaugherty, 2008). The amounts of C-gases, CID, RPOC and
the proportion between detritus and the aqueous volume of the environment, in addition to the temperature and CH4 to CO2 rates since these gases have different dissolution potentials (defined by Henry’s Law; Langmuir, 1997). The yield of
Considering the high temperatures prevailing in tropical environments, the RPOC changes (formation of humic substances and other diagenesis products) are governed by the redox state of soil and sediments, pH and availability of catalytic sites on the mineral surface (Brocks & Summons, 2005).
Mineralization rates are related to the number and types of microorganisms, with a formation of products and changes of detritus composition (Konhauser, 2007). Therefore, in the second phase of gas formation (lasting about 150 days) populations of microorganisms have been replaced by species K-strategists (Bianchini Junior et al., 1997) and the mineralization process has become slower due to the majority of recalcitrant compounds. A growth model of a microbial population derived from soil organic matter decomposition suggests that exogenous maintenance (especially from labile compounds) of the population should be associated with r-strategists. Endogenous maintenance should be associated with the recycling of preexisting biomass and K-strategists such as Basidiomycetes or Ascomycetes, which have slow growth (Neill & Gignoux, 2006).
The continuous reduction of the redox potential observed in experiments under anaerobic conditions (McLatchey & Reddy, 1998) presents as the main products biogenic gases such as CO2, mercaptans, NH3, H2S and CH4 (Davis & Cornwell 2008). The anaerobic decomposition in flooded areas contributes to the atmospheric reservoir of greenhouse gases. Regarding the N-biogenic gases, the decrease in the redox potential values are generated from N2O and N2 occurs from denitrification (Mitsch & Gosselink, 1993). However, with the prevalence of carbon gases compared to gases from other elements, the results discussed in our experiment were simplified to the carbon (C-gases) basis (mainly CO2 and CH4). The slowing of metabolic activities and the decreased rates of gas formation pointed to the use of compounds for maintaining the mineralizing microorganisms as energy or a substrata source (King, 2005). The decrease in the daily rates of gas emission can also be attributed to the predominance of refractory fraction of detritus from a limitation of nutrients and/or electron acceptors, as observed in marine sediment (Aller, 2004), as the present study used bioassays for modeling gas emission. The limitations, in turn, arose from the daily purge of gases withdrawing gaseous nutrients from the mineralziation chambers. The episodic behavior of daily rates might also be related to changes in the
microbial community structure (McMahon et al., 2001). During decomposition of plant residues, the early successional groups (e.g. Clostriduim) are responsible for the decomposition of the easily degradable fraction by the fermentation of various carbohydrates and fatty acids, while the late successional groups (e.g. Acidobacteria
and Actinobacteria) become more important in decomposing the refractory fraction of plant residues (Rui et al., 2009).
The high emission of gases from mineralization of leaf samples is primarily due to labile chemical characteristics, with low amounts of fiber than the more recalcitrant resources (Guérin et al., 2008) i.e. twigs, bark and T. domingensis. Studies on anaerobic decomposition kinetics from twigs, bark (Bitar et al., 2002) and T. domingensis (Cunha-Santino & Bianchini Junior, 2006) showed that the refractory fraction of these substrates were: 89.5%, 91.7% and 92.7%, respectively. The vascular plant detritus is resistant to decomposition because of abundant high-molecular-weight compounds, such as lignocelluloses (Reddy & DeLaune, 2008). The anaerobic mineralization of the forest leaves generated smaller volumes of gases; probably because leaves from the Atlantic Forest were rich in fiber content (Giné et al., 2010). Gas emission presented an intermediate yield during the decomposition of soybean leaves. The gas production depended mainly on the chemical composition of the resources, particularly the contents of labile (soluble sugars) and recalcitrant (cellulose and lignin proteins,) compounds as shown by the two-stage process (Osman, 2013). Our results also indicated a direct relationship (linear) between the volume of gases formed and the quantity of organic matter consumed, indicating that the organic resources tested in the present study represent sources of carbon gases during the anaerobic decay.
clearly to zero, thus emphasizing the strong trend to the accumulation of organic matter in sediments and waterlogged soils. Thus, the refractory fraction of the organic resources during anaerobic decay represent a very slow, but continuously source of gases, since the nutritional demands of decomposing microorganisms are supplied in the environment. Considering the low cycling rates of structural compounds of plants, the complete decomposition is a long-term process. For instance, it was observed that trees and trunks, totally or partly submerged, were still present in the Marion Millpond Reservoir (Wisconsin, USA) after 110 years of the reservoir formation (Born et al., 1973).
Our results showed the heterogeneity of organic resources displaying a labile and a refractory fraction. During anaerobic decomposition, the organic resources with a high content of refractory fraction such as bark, twigs and T. domingensis
presented a low yield of gas emission, with the exception of sugarcane stalks. The high yields of gas formation during anaerobic decay operate as a source of carbon greenhouse gas to the atmosphere. On the other hand, the slow decay of refractory fraction of organic resources form the carbon sink reservoir in tropical waterlogged soils.
Acknowledgements
The authors would like to thank the São Paulo Research Foundation (FAPESP processes nº: 98/15011-6; 2007/02683-7; 2007/08602-9) and the Brazilian National Council for Scientific and Technological Development for the scholarship (CNPq process nº 301765/2010-3). We are also indebted to CESP (Companhia Energética de São Paulo) for their assistance in obtaining water samples and plant resources, and Dr. Osvaldo N. Oliveira Jr. (IFSC-USP) for his critical proofreading of the manuscript.
References
ADEKUNLE, K.F. and OKOLIE, J.A. A review of biochemical process of anaerobic digestion. Advances in Bioscience and Biotechnology, 2015, 6(3), 205-212. http://dx.doi.org/10.4236/abb.2015.63020. AERTS, R. Climate, leaf litter chemistry and leaf litter
decomposition in terrestrial ecosystems: a triangular relationship. Oikos, 1997, 79(3), 439-449. http:// dx.doi.org/10.2307/3546886.
A L L E R , R.C. Conceptual models of early diagenetic processes: The muddy seafloor as an unsteady, batch reactor. Journal of Marine Research, 2004, 62(6), 815-835. http://dx.doi. org/10.1357/0022240042880837.
BÄRLOCHER, F. Leaching. In M.A.S. GRAÇA, F. BÄRLOCHER and M.O. GESSNER, eds. Methods to study litter decomposition: a practical guide. Dordrecht: Springer, 2005, pp. 37-42.
BERG, B. and MCCLAUGHERTY, C. Plant litter. decomposition, humus formation, carbon sequestration. Heidelberg: Springer, 2008.
BIANCHINI JUNIOR, I., ANTONIO, R.M. and MOURA, L.F. On the manometric method for estimating the anaerobic mineralization in aquatic ecosystems: kinetic and methodological aspects. Brazilian Journal of Microbiology, 1997, 28(1), 83-90. BIANCHINI JUNIOR, I., CUNHA-SANTINO,
M.B., ROMEIRO, F. and BITAR, A.L. Emissions of methane and carbon dioxide during anaerobic decomposition of aquatic macrophytes from a tropical lagoon (São Paulo, Brazil). Acta Limnologica Brasiliensia, 2010, 22(2), 157-164. http://dx.doi. org/10.1590/S2179-975X2010000200005. BITAR, A.L., ANTONIO, R.M. and BIANCHINI
JUNIOR, I. Degradação anaeróbia de folhas e galhos, cascas e serapilheira. Acta Limnologica Brasiliensia, 2002, 14(2), 17-26.
BORN, S.M., WIRTH, T.L., BRICK, E.M. and PETERSON, J.P. Restoring the recreational potential of small impoundments: the Marion Millpond experience. Madison: Wisconsin Department of Natural Resources, 1973. Technical Bulletin, vol. 71. BOT, A. and BENITES, J. The importance of soil organic
matter: key to drought-resistant soil and sustained food and production. Rome: Food and Agriculture Organization of the United Nations, 2005.
BREIDENBACH, B. and CONRAD, R. Seasonal dynamics of bacterial and archaeal methanogenic communities in flooded rice fields and effect of drainage. Frontiers in Microbiology, 2015, 5, 752. PMid:25620960.
BROCKS, J.J. and SUMMONS, R.E. Sedimentary hydrocarbons, biomarkers for early life. In W.H. Schlesinger, eds. Treatise on geochemistry. Oxford: Elsevier, 2005, pp. 63-115, vol. 8.
COMPANHIA ENERGÉTICA DE SÃO PAULO – CESP. Aproveitamento hidrelétrico do rio Paranapanema - Complexo Canoas: Relatório de Impacto Ambiental - RIMA. Usinas Canoas I - Canoas II/CESP. São Paulo: ENGEVIX, 1990. Série Pesquisa e Desenvolvimento, vol. 57.
COÛTEAUX, M.M., MCTIERNAN, K.B., BERG, B., SZUBERLA, D., DARDENNE, P. and BOTTNER, P. Chemical composition and carbon mineralization potential of Scots Pine needles at different stages of decomposition. Soil Biology & Biochemistry, 1998, 30(5), 583-595. http://dx.doi. org/10.1016/S0038-0717(97)00169-7.
estudos de decomposição de macrófitas aquáticas. Oecologia Brasiliensis, 2006, 10(2), 154-164. http:// dx.doi.org/10.4257/oeco.2006.1002.03.
DAVIS, M.L. and CORNWELL, D.A. Introduction to environmental engineering. Singapore: McGraw-Hill, 2008.
GINÉ, G.A.F., DUARTE, J.M.B. and FARIA, D. Feeding ecology of a selective folivore, the thin-spined porcupine (Chaetomys subspinosus) in the Atlantic forest. Journal of Mammalogy, 2010, 91(4), 931-941. http://dx.doi.org/10.1644/09-MAMM-A-185.1. GREENWAY, H., ARMSTRONG, W. and COLMER,
T.D. Conditions leading to high CO2 (> 5 Kpa) in waterlogged–flooded soils and possible effects on root growth and metabolism. Annals of Botany, 2006, 98(1), 9-32. PMid:16644893. http://dx.doi. org/10.1093/aob/mcl076.
GUÉRIN, F., ABRIL, G., JUNET, A. and BONNE, M.P. Anaerobic decomposition of tropical soils and plant material: Implication for the CO2 and CH4 budget of the Petit Saut Reservoir. Applied Geochemistry, 2008, 23(8), 2272-2283. http://dx.doi. org/10.1016/j.apgeochem.2008.04.001.
HAMMER, Ø., HARPER, D.A.T. and RYAN, P.D. PAST: Paleontological statistics package for education and data analysis. Palaeontologia Electronica, 2001, 4(1), 1-9.
HARMON, M.E., NADELHOFFER, K.J. and BLAIR, J.M. Measuring decomposition, nutrient turnover, and stores in plant litter. In G.P. ROBERTSON, D.C. COLEMAN, C.S. BLEDSOE and P. SOLLINS, eds. Standard soil methods for long-term ecological research. New York: Oxford University Press, 1999, pp. 202-240.
HOSSAIN, M., SIDDIQUE, M.R.H., ABDULLAH, S.M.R., SAHA, S., GHOSH, D.C., RAHMAN, M.S. and LIMON, S.H. Nutrient dynamics associated with leaching and microbial decomposition of four abundant mangrove species leaf litter of the Sundarbans, Bangladesh. Wetlands, 2014, 34(3), 439-448. http://dx.doi.org/10.1007/s13157-013-0510-1. INGLETT, K.S., INGLETT, P.W., REDDY, K.R. and OSBORNE, T.Z. Temperature sensitivity of greenhouse gas production in wetland soils of different vegetation. Biogeochemistry, 2012, 108(1), 77-90. http://dx.doi.org/10.1007/s10533-011-9573-3.
INTERGOVERNMENTAL PANEL ON CLIMATE CHANGE – IPCC. 2006 IPCC Guidelines for National Greenhouse Gas Inventories, National Greenhouse Gas Inventories Programme. Japan: IGES, 2006.
INTERGOVERNMENTAL PANEL ON CLIMATE CHANGE – IPCC. 2013 Supplement to the 2006 IPCC Guidelines for National Greenhouse Gas Inventories: Wetlands. Switzerland: IPCC, 2014.
JENNY, H., GESSEL, S.P. and BINGHAM, F.T. Comparative study of decomposition rates of organic matter in temperate and tropical regions. Soil Science, 1949, 68(6), 419-432. http://dx.doi. org/10.1097/00010694-194912000-00001. KING, G.M. Ecophysiology of microbial respiration. In
P.A. DEL GIORGIO and P.J.B. WILLIAMS, eds. Respiration in aquatic ecosystems. Oxford: University Press, 2005, pp. 18-35.
KONHAUSER, K. Introduction to geomicrobiology. Oxford: Blackwell, 2007.
LANGMUIR, D. Aqueous environmental geochemistry. Upper Saddle River: Prentice Hall, 1997.
LIESACK, W., SCHNELL, S. and REVSBECH, N.P. Microbiology of flooded rice paddies. FEMS Microbiolog y Reviews, 2000, 24(5), 625-645. PMid:11077155. http://dx.doi. org/10.1111/j.1574-6976.2000.tb00563.x. MAGEE, P.A. Detrital accumulation and processing in
wetlands. Waterfowl Management Handbook. Fish and Wildlife. Leaflet, 1993, 13(3), 1-7.
MCLATCHEY, G. and REDDY, K.R. P and REDDY, K.R. Regulation of organic matter decomposition and nutrient release in a wetland soil. Journal of Environmental Quality, 1998, 27(5), 1268-1274. http://dx.doi.org/10.2134/ jeq1998.00472425002700050036x.
MCMAHON, K.D., STROOT, P.G., MACKIE, R.I. and RASKIN, L. Anaerobic codigestion of municipal solid waste and biosolids under various mixing conditions - II: microbial population dynamics. Water Research, 2001, 35(7), 1817-1827. PMid:11329684. http://dx.doi.org/10.1016/S0043-1354(00)00438-3. MEGONIGAL, J.P., HINES, M.E. and VISSCHER, P.T. Anaerobic metabolism: linkages to trace gases and aerobic processes. In W.H. SCHLESINGER, ed. Treatise on geochemistry. Oxford: Elsevier, 2005, pp. 317-424, vol. 8.
MITSCH, W.J. and GOSSELINK, J.G. Wetlands. New York: Van Nostrand Reinhold, 1993.
NEILL, C. and GIGNOUX, J. Soil organic matter decomposition driven by microbial growth: A simple model for a complex network of interactions. Soil Biology & Biochemistry, 2006, 38(4), 803-811. http:// dx.doi.org/10.1016/j.soilbio.2005.07.007. NEUBAUER, S.C. and ANDERSON, I.C. Transport
of dissolved inorganic carbon from a tidal freshwater marsh to the York River estuary. Limnology and Oceanography, 2003, 48(1), 299-307. http://dx.doi. org/10.4319/lo.2003.48.1.0299.
Environmental Microbiology, 2005, 7(3), 382-395. PMid:15683399. http://dx.doi.org/10.1111/j.1462-2920.2005.00700.x.
OHLE, W. Measuring the evolution rate of gases in bottom sediment. In Y.I. SOROKIN and H. KADOTA, eds. Techniques for the assessment of microbial production and decomposition in fresh water. Oxford: Blackwell, 1972. pp. 29-33, IBP nº 23. OSMAN, K.T. Soils: principles, properties and management.
Dordrecht: Springer, 2013.
PRAEG, N., WAGNER, A.O. and ILLMER, P. Plant species, temperature, and bedrock affect net methane flux out of grassland and forest soils. Plant and Soil, 2016, 1-14. http://dx.doi.org/10.1007/s11104-016-2993-z.
PRESS, W.H., TEUKOLSKY, S.A., VETTERLING, W.T. and FLANNERY, B.P. Numerical recipes: the art of scientific computing. New York: Cambridge University Press, 2007.
REDDY, K.R. and DELAUNE, R.D. Biochemistry of wetlands - science and applications. Boca Raton: CRC Press, 2008.
RUI, J., PENG, J. and LU, Y. Succession of bacterial populations during plant residue decomposition in rice field soil. Applied and Environmental Microbiology, 2009, 75(14), 4879-4886. PMid:19465536. http:// dx.doi.org/10.1128/AEM.00702-09.
SMITH, K.A., BALL, T., CONEN, F., DOBBIE, K.E., MASSHEDER, J. and REY, A. Exchange of greenhouse gases etween soil and atmosphere: interactions of soil physical factors and biological processes. European Journal of Soil Science, 2003, 54(4), 779-791. http://dx.doi.org/10.1046/j.1351-0754.2003.0567.x.
STEINBERG, C.E.W. Ecology of humic substances in freshwaters. Heidelberg: Springer, 2003.
UTSUMI, M., NOJIRI, Y., NAKAMURA, T., TAKESHI, N., OTSUKI, A. and SEKI, H. Oxidation of dissolved methane in a eutrophic, shallow lake; Lake Kasumigaura, Japan. Limnology and Oceanography, 1998, 43(3), 471-480. http:// dx.doi.org/10.4319/lo.1998.43.3.0471.