AR
TIGO
AR
TICLE
1 Departamento de Pesquisa e Desenvolvimento, Empresa Brasileira de Pesquisa Agropecuária. Rodovia Brasília/Anápolis BR 060 Km 09, Gama. 70359-970 Brasília DF Brasil.
[email protected] 2 Escola Nacional de Saúde Pública, Fiocruz. Rio de Janeiro RJ Brasil. 3 Campanha Permanente Contra os Agrotóxicos e Pela Vida. São Paulo SP Brasil. 4 Associação Brasileira de Agroecologia. Porto Alegre RS Brasil.
5 Fiocruz Ceará. Fortaleza CE Brasil.
Use of genetically modified crops and pesticides in Brazil:
growing hazards
Uso de sementes geneticamente modificadas e agrotóxicos no Brasil:
cultivando perigos
Resumo Culturas geneticamente modificadas (GM) foram oficialmente autorizadas no Brasil em 2003. O presente estudo documental buscou identificar possíveis alterações no padrão de uso de agrotóxicos a partir da adoção dessa tecnolo-gia, considerando um período de 13 anos (2000 a
2012). Foram avaliadas as variáveis: uso de
agro-tóxicos (kg), uso de agrotóxicos per capita (kg/
habitante), uso de agrotóxicos e uso de
herbi-cidas por área plantada (kg/ha) e produtividade
(kg/ha). Contrariando as expectativas iniciais de diminuição do uso de agrotóxicos após a introdu-ção de culturas GM, observou-se que o uso total de agrotóxicos no Brasil aumentou 1,6 vezes entre os anos de 2000 e 2012. No mesmo período, des-tacou-se o uso de agrotóxicos na cultura de soja, aumentando em mais de 3 vezes. As análises esta-tísticas reforçam baixa correlação entre o consumo de agrotóxicos e herbicidas e a produtividade da soja. Sugere-se que a introdução de culturas GM levou ao aumento no uso de agrotóxicos, com a possibilidade de aumento da exposição humana e ambiental e, consequentemente, aos impactos
ne-gativos associados a essas substâncias.
Palavras-chave Agrotóxicos, Herbicidas, Soja, Saúde e ambiente
Abstract Genetically modified (GM) crops were officially authorized in Brazil in 2003. In this do-cumentary study, we aimed to identify possible changes in the patterns of pesticide use after the adoption of this technology over a span of 13 ye-ars (2000 to 2012). The following variables were analyzed: Pesticide use (kg), Pesticide use per ca-pita (kg/inhab), Pesticide and herbicide use per area (kg/ha) and productivity (kg/ha). Contrary to the initial expectations of decreasing pesticide use following the adoption of GM crops, overall pesticide use in Brazil increased 1.6-fold between the years 2000 and 2012. During the same period, pesticide use for soybean increased 3-fold. This study shows that the adoption of GM crops in Brazil has led to an increase in pesticide use with possible increases in environmental and human
exposure and associated negative impacts.
Key words Pesticide, Herbicide, Soybean, Envi-ronmental health
Vicente Eduardo Soares de Almeida 1
Karen Friedrich 2
Alan Freihof Tygel 3
Leonardo Melgarejo 4
A
lme
ida VES
Introduction
Brazil’s status as one of the largest producers of agricultural commodities in the world is associ-ated with an increase in the consumption of ag-ricultural inputs such as pesticides; the national pesticide market was worth US$12.2 billion in
20141. Between 2000 and 2012, the use of these
chemicals by unit area more than doubled2. This
is worrisome because the impacts on environ-mental and human health due to pesticides have been extensively documented both by interna-tional organizations and in the scientific
litera-ture3-7.
Several studies have pointed to a direct asso-ciation between the increase in global consump-tion of pesticides and the use of
herbicide-resis-tant genetically modified (GM) crops8,9. In the
US, Benbrook10 revealed that between 1996 and
2011, GM crops led to a 183,000-ton increase in pesticides, which is equivalent to 7% of the over-all pesticide use for over-all crops. Between 1995 and 2002, the use of the herbicide glyphosate in soy-bean production increased from 2,500 to 30,000
tons/year8. During the process of authorization
for GM crops resistant to the herbicide 2,4-D, a 3- to 7-fold increase in consumption of 2,4-D
was estimated11.
In Brazil, GM crops were initially introduced illegally at the end of the 1990s and officially
authorized in 200312. Six types of GM crops are
authorized, but only three are effectively in use, namely, soybean, corn and cotton. Although genetic manipulation has broader goals such as pharmaceutical applications and biofortified food development, there are currently three types of GM crops currently in use in Brazil:
herbicide-resistant, insect-resistant or both13,14.
In 2014, when pesticide sales in Brazil were the highest, the cultivated area of GM crops reached 42.2 million hectares, which represented an in-crease of 1306.67% over the 3 million hectares
registered in 200315.
In this context, this paper aims to identify and characterize changes in the patterns of use of pesticides and herbicides after the adoption of GM cropsin Brazil. The emphasis is on soybeans, the main commodity produced in the country, in which 90% of the crops are GM according to the
ISAAA15. The period analyzed was 2000 to 2012,
which corresponds to the most recent statistical data on pesticide consumption provided by the Brazilian Institute of Geography and Statistics
(IBGE)16 from the Sustainable Development
In-dicators publication. This time span also covers
the period before and after the official adoption of GM soybean, corn and cotton, which facilitat-ed the analysis of the impactof the adoption of GM crops on pesticide demand.
Methods
In this study, a descriptive research was adopted that was focused on documentary research and based on secondary data under the framework
of critical epidemiology17,18.This work was
de-veloped through systematizing, tabulating, and statistically treating agronomic and demographic data from the IBGE and the Brazilian Crop Pro-tection Industry Union (Sindiveg).
The first step was to calculate for the study
period the cumulative growth (∆) and the
com-pound annual growth rate (CAGR) of the
fol-lowing indicators: general pesticide use, pesticide
use per capita, pesticide and herbicide use per area,
pesticide and herbicide use per cropland,
produc-tivity per hectare and population growth. ∆ and
CAGR were calculated as follows:
(1) ∆ = (Vf / Vi) -1 and
(2) CAGR = (Vf / Vi) 1/T-1,
where Vf and Vi represent the final and initial
values of the analyzed period, respectively, and T
represents the difference in years between the fi-nal and initial values.
The next step was to carry out a linear cor-relation analysis between annual pesticide and herbicide use per area and the productivity of each GM crop (soybean, corn and cotton) from 2000 to 2012. The Pearson’s correlation coeffi-cient (r) was used to determine the correlation
between pesticide use per area (independent
vari-able) and productivity (dependent variable). The
determination coefficient (R2) was used to
deter-mine the proportion of the variation in
produc-tivity that could be predicted from the pesticide
use per area.
More specific analyses focused on the changes
in patterns of herbicide use and productivity gains
for soybean. Genetically modified, herbicide-re-sistant soybean was the first GM crop officially introduced in Brazil in 2003.
Results and Discussion
During the period investigated, the gross (t) for-mulated pesticide use in Brazil increased more than 2-fold. Table 1 shows that the cumulative
high-aúd
e C
ole
tiv
a,
22(10):3333-3339,
2017
er than the growth in productivity (kg/ha) and
10 times higher than population growth for the
same period. Each year, pesticide use per capita
increased by 7%, while productivity increased by only 3.5%.
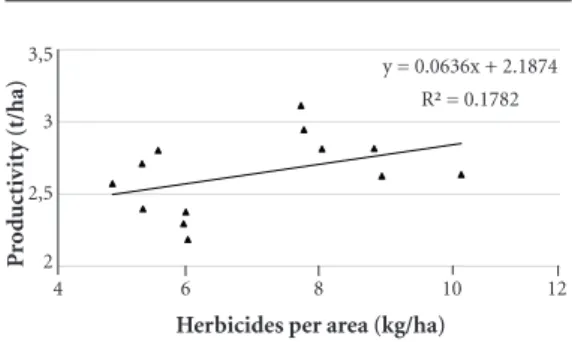
Table 2 presents the data for soybean, corn and cotton in Brazil for the analyzed period. Soybean production was associated with a
great-er than 3-fold increase in pesticide use over the
period analyzed (Table 2), while overall pesticide
use increased 1.6-fold (Table 1). Furthermore,
the determination coefficient (R2) of pesticide
use and soybean productivity was 22.73% (Table
2) and of herbicide use and soybean productivity
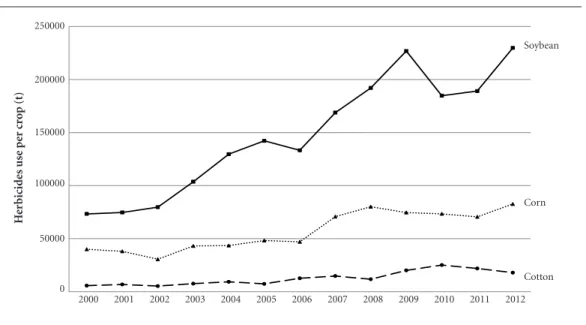
was 17.82% (Figure 1).Figure 2 shows the
sud-den increase in herbicide use in soybean crops in
the year 2003when GM soybean was authorized
in Brazil. Herbicide use in corn and cotton also
increased, but the change was not as pronounced.
Figure 3 highlights the herbicide use per area
(kg/ha) and production of soybean (kg) based on
herbicide (kg). Between 2000 and 2002, herbicide
use per area decreased by 9% and soybean
pro-duction per kg herbicide used increased by 18%.
From 2003 and onward, herbicide use per area
increased by 64% while soybean production per
kg herbicide used decreased by 43%. For each ton
of herbicide used on soybean crops, there was an annual reduction of 16.79 tons in soybean pro-duction (Figure 3).
The cumulative growth of pesticides use in Brazil was higher than the overall productivity of crops between 2000 and 2012. Our data show an increase of 3.2 pp (percentage points) in pesti-cide use and of 1.78 pp in pestipesti-cide use per area, but only 1 pp of productivity increase in the same
Table 1. Accumulated growth (∆) and compound annual growing rate (CAGR) in pesticide use, agricultural
productivity and population between 2000 and 2012 in Brazil.
Indicators 2000 2012 ∆ CAGR
Pesticide use (t) 313,824 823,226 162.32% 8.37%
Pesticide use per capita (kg/inhab) 1.89 4.24 124.67% 6.98% Pesticide use per area (kg/ha) 6.09 15.97 90.31% 8.37%
Productivity (kg/ha) 9.70 14.62 50.71% 3.48%
Brazilian Population (inhab) 166,112,518 193,946,886 16.76% 1.30%
∆ = (Vf / Vi) -1; and CAGR = (Vf / Vi)
1/T -1,where V
f and Vi represents the final and initial values of the analyzed period, and T, the difference of years between Vf and Vi.
Table 2. Increase of pesticides per crop and area and productivity of genetic modified (GM) crops between 2000
and 2012 in Brazil.
Culture Share in
pesticide use
∆ Pesticide
use per crop
∆ Pesticide use
per area (a)
∆ Productivity
(b)
r R2 (a)/(b)
Soybean 44.31% 310.71% 124.15% 9.50% 0.48 22.73% 13.07 Corn 13.07% 137.81% 99.65% 84.61% 0.82 67.71% 1.18 Cotton 7.41% 155.78% 46.22% 41.53% 0.64 41.34% 1.11
Share in pesticide use is the average of percentage of pesticide use per crop related to the total amount of pesticide use in the period studied (2000-2012). Productivity represents the amount of crop production per hectare. ∆ = (Vf / Vi) -1; and CAGR =
(Vf / Vi)
1/T -1, where V
f and Vi the final and initial values of the analyzed period, and T, the difference of years between Vf and Vi. Pearson’s correlation coefficient (r) and the determination coefficient (R
2) were used in order to achieve the relation between productivity and use of pesticides per area.
Figure 1. Soybean Productivity (t/ha) related to
Herbicides use per area (kg/ha) in Brazil between 2000 and 2012.
Herbicides per area (kg/ha)
P
ro
d
uct
iv
it
y (t/ha)
y = 0.0636x + 2.1874 R² = 0.1782 3,5
3
2,5
2
A
lme
ida VES
period (Table 1). This observed increase in pesti-cide use was not accompanied by an increase in the cultivated area or an increase in the growth of the Brazilian population. These findings disagree
with other studies15,19 that predicted reduced
pes-ticide use after the adoption of GM crops.
A more detailed analysis of the indicator
pes-ticide use per crop showed that only three crops,
Figure 2. Evolution of the Herbicides use (t) for soybean (■), corn (▲) and cotton (●) in Brazil between 2000
and 2012.
0 50000 100000 150000 200000 250000
2000 2001 2002 2003 2004 2005 2006 2007 2008 2009 2010 2011 2012
2000 2001 2002 2003 2004 2005 2006 2007 2008 2009 2010 2011 2012
0 50000 100000 150000 200000 250000
H
er
bicid
es use p
er cr
o
p (t)
Cotton Corn Soybean
0 2 4 6 8 10 12
0 100 200 300 400 500 600
2000 2001 2002 2003 2004 2005 2006 2007 2008 2009 2010 2011 2012
■ Herbicides per area (▲).
Soybean per herbicide (kg/kg)
Herbicides per area (kg/ha)
Figure 3. Evolution of the use of herbicides (kg/ha) for soybean production per herbicide used (kg/kg) in Brazil.
Dashed lines show the linear tendencies for production of Soybean per herbicide (■) and Herbicides per area
(▲).
2000 2001 2002 2003 2004 2005 2006 2007 2008 2009 2010 2011 2012
100
0 200 300 400 500
S
o
yb
ean p
er he
rbicid
e (kg/kg)
Soybean per herbicide (kg/kg)
Herbicides per area (kg/ha) y = -16.786x + 508.41
R² = 0.584
y = 0.3867x + 4.3596 R² = 0.7105 600
0 2 4 6 8 10
12
H
er
bicid
es p
er ar
aúd
e C
ole
tiv
a,
22(10):3333-3339,
2017
soybeans, corn, and cotton, accounted for 65% of the overall total pesticide use whereas soybean, which is the dominant GM crop, accounted for 71%.The results also show that soybean presented
the highest increase in pesticide use per cultivated
area and the lowest gain in productivity (Table 2).
The indicator pesticide use per area showed that
a 1 pp increase in soybean productivity required a 13-pp increase in pesticide use, while for corn and cotton this relationship was approximately 1:1 (Table 2).These data suggest that the genetic modification ofsoybeanwas not associated with growth in productivity and instead contributed to an increase in pesticide use.
One explanation for these results is that most GM crops were not developed to enhance pro-ductivity or edaphoclimatic adaptability, but mainly to be resistant to herbicides. Other stud-ies have demonstrated that changes in patterns of herbicide use such as an increase in the total amount of glyphosate applied (kg/ha) were
relat-ed to the adoption of GM soybean14,20,21. A study
performed in the US between 1990 and 2002 also showed an increase in glyphosate use when her-bicide-resistant GM soybeans were authorized
(1996)8. These changes were not observed for
corn and cotton crops, which is likely attributable to the fact that the GM versions of these crops were commercialized in the US at the end of the period of analysis, as also shown in our study.
Several factors associated with the cultivation of herbicide-resistant GM crops may contribute to the increased use of pesticides and losses in productivity, including biological vulnerability,
weed resistance, and decreased soil fertility14,21-30.
Some alternative approaches such as increas-ing the use of different herbicides and develop-ment of GM crops resistant to other herbicides
have been considered31,32. However, these
alter-natives are also concerning due to the increased probability of serious toxic hazards to humans and the environment by mixing different
her-bicides33,34. It is noteworthy that the two most
widely used herbicides in Brazil2, glyphosate and
2,4-D,were recently classified as probable and possible carcinogens, respectively, by the Inter-national Agency for Research on Cancer (IARC). The results obtained in this study agree with similar studies in the US, Argentina, and other
parts of the world9,10,35,36. Data from these studies
strongly suggest that the adoption of GM crops increased pesticide use, specifically herbicides sprayed on soybean, as shown by the present study for Brazil. Ecological studies performed in Brazil have shown correlations between
soy-bean cultivation (in tons) and mortality due to prostate cancer and between pesticide use and
endocrine disturbances37,38. As discussed in
oth-er studies, data for pesticide and GM crop use may be used as indicators of human and envi-ronmental exposure to serious threats, and these data should motivate public actions to prevent or
mitigate these hazards39.
The results from this study suggest that GM crops have contributed to an increase in pesticide use in Brazil and consequently, increased human and environmental exposure to these potentially hazardous chemical substances. Therefore, the potential for an increase in pesticide use should also be considered during the process of licensing for GM crops. Pesticide use in soybean produc-tion increased over the analyzed period, especial-ly after the adoption of GM seeds in 2003. Pesti-cide use per area also increased significantly, in-dicating a possible chemical dependency of these croplands and excluding the hypothesis that GM crops could reduce pesticide use. Another rele-vant aspect, specifically for soybeans, is that this increase did not result in an increase in average productivity. It is also noteworthy that data re-garding pesticide use may serve as indicators to support environmental and health surveillance measures such as soil, water and food monitor-ing for pesticide residues, and such data may strengthen actions related to the diagnosis and treatment of intoxication.
Collaborations
VES Almeida worked on the conception and de-sign of the study, and VES Almeida, K Friedrich, AF Tygel, L Melgarejo and FF Carneiro worked on analysis and data interpretation and manu-script writing and revision.
Acknowledgments
A
lme
ida VES
References
1. Sindiveg. Balanço 2015: Setor de agroquímicos confir-ma queda de vendas. Press release. São Paulo: Sindiveg; 2016. [cited 2016 Jun 6]. Available from: http://dados. contraosagrotoxicos.org/group/comercializacao 2. Instituto Brasileiro de Geografia e Estatística (IBGE).
Indicadores de Desenvolvimento Sustentável Brasil 2015. Rio de Janeiro: IBGE; 2015. [cited 2016 Jun 6]. Avai-lable from: http://www.ibge.gov.br/home/geociencias/ recursosnaturais/ids/default_2015.shtm
3. González-Alzaga B, Lacasa M, Aguilar-Gardu C, Rodrí-guez-Barranco M, Ballester F, Rebagliato M, Hernán-dez AF. A systematic review of neurodevelopmental effects of prenatal and postnatal organophosphate pesticide exposure. Toxicol Lett 2014; 230(2):104-121. 4. World Health Organization (WHO), International
Agency for Research on Cancer (IARC). Volume 112: evaluation of five organophosphate insecticides and herbicides. Lyon: IARC, WHO; 2015. [cited 2016 Jun 6]. Available from: http://monographs.iarc.fr/ENG/ Monographs/vol112/index.php
5. Mascarelli A. Growing up with pesticides. Science 2013; 341(6147):740-741.
6. Mesnage R, Defarge N, Vendomois JS, Seralini GE. Po-tential toxic effects of glyphosate and its commercial formulations below regulatory limits. Food Chem Toxi-col 2015; 84:133-153
7. Schmitz J, Hahn M, Bruhl CA. Agrochemicals in field margins – An experimental field study to assess the impacts of pesticides and fertilizers on a natural plant community. Agric Ecosyst Environ 2014; 193:60-69. 8. Young BG. Changes in herbicide use patterns and
pro-duction practices resulting from glyphosate-resistant crops. Weed Technol 2006; 20(2):301-307.
9. Peshin R, Zhang W. Integrated Pest Management and Pesticide Use. In: Pimentel D, Peshin R, editors. Inte-grated Pest Management. Amsterdam: Springer; 2014. p. 1-46.
10. Benbrook CM. Impacts of genetically engineered crops on pesticide use in the U.S. – the first sixteen years. Env Sci Eur 2012; 24:24.
11. United States Department of Agriculture (USDA). Animal and Plant Health Inspection Service (APHIS).
Dow AgroSciences Petitions (09-233-01p, 09-349-01p, and 11-234-01p) for Determinations of Nonregulated Status for 2,4-D-Resistant Corn and Soybean Varieties— Draft Environmental Impact Statement. Washington: USDA/APHIS; 2013. [cited 2016 Jun 6]. Available from: https://www.aphis.usda.gov/brs/aphisdocs/24d_deis. pdf
12. Brasil. Lei nº 10.688, de 13 de junho de 2003. Estabelece normas para a comercialização da produção de soja da safra de 2003 e dá outras providências. Diário Oficial da União 2003; 16 jun.
13. Acosta O, Chaparro A. Genetically modified food crops and public health. Acta bio Colomb 2008; 3:13. 14. National Research Council (NRC). Impact of
Genetical-ly Engineered Crops on Farm Sustainability in the Unit-ed States. Washington: The National Academic Press; 2010.
15. International Service for the Acquisition of Agri-Bio-tech Aplications (ISAAA). Global status of Commer-cialized biotech/GM Crops. 2014. [cited 2016 Jun 6]. Available from: http://www.isaaa.org/resources/publi-cations/briefs/44/executivesummary/default.asp 16. Instituto Brasileiro de Geografia e Estatística (IBGE).
Indicadores de Desenvolvimento Sustentável Brasil 2015. Rio de Janeiro: IBGE; 2015. [cited 2016 Jun 6]. Avail-able from: http://www.ibge.gov.br/home/geociencias/ recursosnaturais/ids/default_2015.shtm
17. GIL AC. Métodos e técnicas de pesquisa social. 6ª ed. São Paulo: Atlas; 2008.
18. Breilh J. Epidemiologia Crítica; ciência emancipatória e interculturalidade. Rio de Janeiro: Editora Fiocruz; 2006.
19. Huang J, Hu R, Rozelle S, Pray C. Insect-Resistant GM Rice in Farmers’ Fields: Assessing Productivity and Health Effects in China. Science 2005; 308(5722):688-690.
20. United States Department of Agriculture (USDA). Na-tional Agriculture Statistics Service (NASS). Agricultur-al ChemicAgricultur-al Use Database. Washington: USDA-NASS; 2008. [cited 2016 Jun 6]. Available from: www.pest-management.info/nass
21. Johnson WG, Davis VM, Kruger GR, Weller SC. Influ-ence of glyphosate-resistant cropping systems on weed species shifts and glyphosate-resistant weed popula-tions. Europe J Agron 2009; 31(3):162-172.
22. Cerdeira AL, Gazziero DL, Duke SO, Matallo MB. Agricultural impacts of glyphosate-resistant soybean cultivation in South America. J Agric FoodChem 2011; 59(11):799-807.
23. Shaner DL, Lindenmeyer RB, Ostlie MH. What have the mechanisms of resistance to glyphosate taught us?
PestManag. Sci 2012; 68(1):3-9.
24. Service RF. When weed killers stop killing. Science 2013. 341: 1329.
25. Ismail B, Kader A, Omar O. Effects of Glyphosate on Cellulose Decomposition in Two Soils. Folia Microbiol
1995; 40(5):499-502.
26. King C, Purcell L, Vories E. Plant growth and nitro-genase activity of glyphosate-tolerant soybean in re-sponse to foliar glyphosate applications. Agronomy Journal 2001; 93(1):179-186.
27. Zablotowicz R, Reddy K. Nitrogenase activity, nitrogen content, and yield responses to glyphosate in glypho-sate-resistant soybean. Crop Prot 2007; 26(3):370-376. 28. Kremer R, Means N. Glyphosate and glyphosate-resis-tant crop interactions with rhizosphere microorgan-isms. Eur J Agronomy 2009; 31(3):153-161.
29. Zobiole L, Oliveira R, Visentainer J, Kremer R, Bellaloui N, Yamada T. Glyphosate affects seed composition in glyphosate-resistant soybean. J. Agric. Food Chem 2010; 58(7):4517-4522.
aúd
e C
ole
tiv
a,
22(10):3333-3339,
2017
31. Hungria M, Nakatani AS, Souza RA, Sei FB, de Oliveira Chueire LM, Arias CA. Impact of the ahas transgene for herbicides resistance on biological nitrogen fixation and yield of soybean. Transgenic Res 2015; 24(1):155-165.
32. Pandolfo CE, Presotto A, Carbonell FT, Ureta S, Po-verene M, Cantamutto M. Transgenic glyphosate-re-sistant oilseed rape (Brassica napus) as an invasive weed in Argentina: detection, characterization, and control alternatives. Environ Sci Pollut Res Int 2016; 23(23):24081-24091.
33. Braun JM, Gennings C, Hauser R, Webster TF. What Can Epidemiological Studies Tell Us about the Impact of Chemical Mixtures on Human Health? Environ Health Perspect 2016; 124(1):A6-9.
34. Carlin DJ, Rider CV, Woychik R, Birnbaum LS. Unrav-eling the health effects of environmental mixtures: an NIEHS priority. Environ Health Perspect 2013; 121:A6-8.
35. Pengue W. Transgenic Crops in Argentina: The Eco-logical and Social Debt. Bull. Sci. Technol Soc 2005; 25(4):314-322.
36. Landrigan PJ, Benbrook C. GMOs, Herbicides, and Public Health. N Engl J Med 2015; 373(8):693-695. 37. Koifman K, Koifman RJ, Meyer A. Human reproductive
system disturbances and pesticide exposure in Brazil.
Cad Saude Publica 2002; 18(2):435-445.
38. Silva JFS, Silva AMC, Lima-Luz L, Aydos RD, Mattos IE. Correlação entre produção agrícola, variáveis clínicas-demográfcas e câncer de próstata: um estudo ecológico.
Cien Saude Colet 2015; 20(9):2805-2812.
39. Pignati W, Oliveira NP, Silva AMC. Vigilância aos agro-tóxicos: quantificação do uso e previsão de impactos na saúde-trabalho-ambiente para os municípios brasilei-ros. Cien Saude Colet 2014; 19(12):4669-4678.
Artigo apresentado em 30/05/2017 Aprovado em 26/06/2017