Mixed Signals? Morphological and Molecular
Evidence Suggest a Color Polymorphism in
Some Neotropical
Polythore
Damselflies
Melissa Sánchez Herrera1☯, William R. Kuhn1☯, Maria Olalla Lorenzo-Carballa2,3☯, Kathleen M. Harding2, Nikole Ankrom4, Thomas N. Sherratt5, Joachim Hoffmann6,
Hans Van Gossum7, Jessica L. Ware1, Adolfo Cordero-Rivera2, Christopher D. Beatty2,4☯*
1Department of Biological Sciences, Rutgers University, Newark, New Jersey, United States of America, 2Grupo de Ecoloxía Evolutiva e da Conservación, Departamento de Ecoloxía e Bioloxía Animal, Universidade de Vigo, Galiza, Spain,3Department of Evolution, Ecology and Behaviour, Institute of Integrative Biology, University of Liverpool, Liverpool, United Kingdom,4Department of Biology, Santa Clara University, Santa Clara, California, United States of America,5Department of Biology, Carleton University, Ottawa, Ontario, Canada,6ALAUDA—Arbeitsgemeinschaft für landschaftsökologische Untersuchungen und Datenanalysen, Hamburg, Germany,7Evolutionary Ecology Group, University of Antwerp, Antwerp, Belgium
☯These authors contributed equally to this work. *[email protected]
Abstract
The study of color polymorphisms (CP) has provided profound insights into the mainte-nance of genetic variation in natural populations. We here offer the first evidence for an elaborate wing polymorphism in the Neotropical damselfly genusPolythore, which consists of 21 described species, distributed along the eastern slopes of the Andes in South Amer-ica. These damselflies display highly complex wing colors and patterning, incorporating black, white, yellow, and orange in multiple wing bands. Wing colors, along with some com-ponents of the male genitalia, have been the primary characters used in species descrip-tion; few other morphological traits vary within the group, and so there are few useful diagnostic characters. Previous research has indicated the possibility of a cryptic species existing inP.procerain Colombia, despite there being no significant differences in wing color and pattern between the populations of the two putative species. Here we analyze the complexity and diversity of wing color patterns of individuals from five describedPolythore
species in the Central Amazon Basin of Peru using a novel suite of morphological analyses to quantify wing color and pattern: geometric morphometrics, chromaticity analysis, and Gabor wavelet transformation. We then test whether these color patterns are good predic-tors of species by recovering the phylogenetic relationships among the 5 species using the barcode gene (COI). Our results suggest that, while highly distinct and discrete wing pat-terns exist inPolythore, these“wingforms”do not represent monophyletic clades in the re-covered topology. The wingforms identified asP.victoriaandP.ornataare both involved in a polymorphism withP.neopicta; also, cryptic speciation may have taking place among in-dividuals with theP.victoriawingform. OnlyP.auroraandP.spaterirepresent monophyletic
OPEN ACCESS
Citation:Sánchez Herrera M, Kuhn WR, Lorenzo-Carballa MO, Harding KM, Ankrom N, Sherratt TN, et al. (2015) Mixed Signals? Morphological and Molecular Evidence Suggest a Color Polymorphism in Some NeotropicalPolythore Damselflies. PLoS ONE 10(4): e0125074. doi:10.1371/journal.pone.0125074
Academic Editor:Helge Thorsten Lumbsch, Field Museum of Natural History, UNITED STATES
Received:October 19, 2014
Accepted:March 19, 2015
Published:April 29, 2015
Copyright:© 2015 Sánchez Herrera et al. This is an open access article distributed under the terms of the Creative Commons Attribution License, which permits unrestricted use, distribution, and reproduction in any medium, provided the original author and source are credited.
Data Availability Statement:Relevant data are within the paper and its Supporting Information files, including Mathematica Scripts and GenBank Accession numbers.
species with a single wingform in our molecular phylogeny. We discuss the implications of this polymorphism, and the potential evolutionary mechanisms that could maintain it.
Introduction
A polymorphism occurs when genetic diversity produces discrete variation in a phenotypic trait among individuals within a species. Ford [1] defined polymorphism as“the presence of two or more discontinuous forms of a species in such proportions that the rarest of them can-not be maintained merely by recurrent mutation”. Studies of the evolution of color polymor-phism (CP, hereafter) in a number of model systems (Biston betulariamoths [2],Cepaeasnails [3,4],‘Happy Face’spiders [5], and side-blotched lizards [6,7]) have been highly productive, in-creasing our understanding of the selective forces that maintain these polymorphisms. Recent research has shown that there are several mechanisms that contribute to the maintenance of CPs in natural populations, and that also contribute to the speciation process [8]; in many sys-tems polymorphisms are maintained by natural selection in the form of predation, but sexual selection in the form of mate choice is also common. Despite this research, our knowledge of how genetic diversity is maintained in nature and its relation with CP is still poorly understood. The exploration of novel polymorphic systems can add new insights and fill some of these gaps. We here present our initial findings on wing color diversity in the Neotropical damselfly genusPolythore(Zygoptera: Calopterygoidea: Polythoridae), which appears to maintain an elaborate polymorphism in wing color.
Dragonflies and damselflies (Insecta: Odonata) are amongst the most conspicuous of insects, often due to their wing coloration [9]. These colors are generated by a variety of mechanisms, such as pigments, Tyndall scattering, and optical interference [9–11]. Some of the most intense wing color employed by damselflies (Zygoptera) is produced through wing pigmentation. A number of species, mainly in the superfamily Calopterygoidea, possess wing coloration generat-ed by sequestration of either carotenoid (rgenerat-ed and orange) pigments or melanin (black); waxy pruinosity on the wings may also generate white and/or ultraviolet colors [12,13]. The intensity, uniformity and spatial extent of wing coloration in males typically indicates mate quality and impacts male fitness (i.e. mating success) [14–19]. These damselflies thus present an extremely productive model system for the study of the evolution of sexually selected traits [20].
In most odonate species, wing color patterns are fairly simple; interspecific differences are usually based on the single color employed and/or the relative size and shape of the color patch. Among species in the genusCalopteryx, for example, small differences in simple wing patterns appear to allow for effective conspecific recognition during mating; while mating structures are not significantly differentiated between species, hybridization events appear to be relatively rare, even in places where different species live syntopically [21–27].
The genusPolythorecurrently contains 21 described species, distributed primarily along the eastern slopes of the Andes in South America [28,29].Polythoretypically dwell in small stream environments within healthy rainforests; larvae live in the streams and adults generally remain close to their stream habitat [28,30]. In most calopyterygid species, either red/orange pigments or black pigments are used, but not both [12,13,31].Polythore, however, is the rare exception: many“wingforms”use at least two colors to generate combinations of black, white, yellow, and orange, displayed in bands and other geometric patterns that differ dramatically between de-scribed species (Fig 1). Their vibrant wing color pattern is the primary trait used to describe the species in this genus [28,32]. There is, in fact, a surprising lack of variability in other
Fig 1. Examples of color polymorphism inPolythoretaxa used in this study.For each wingform, the typical form is shown on the left, and extrema are shown on the right.
morphological traits: structures such as the male cerci, which function as a“lock and key”
mechanism during copula in many other species [33] show little or no variation inPolythore, even over wide geographic distances. Why selection has brought about such elaborate wing patterning inPolythoreis thus of interest, and a key first step to addressing this question would be the quantitative assessment of these patterns. Recent work by Sánchez Herrera et al. com-pared the variability in wing patterns ofP.procerafrom Colombia, and analyzed genetic diver-sity in several populations; morphological characters (including wing color patterning and the structure of male accessory genitalia) were not significantly different among populations, but genetic diversity among certain populations was quite high, suggesting the presence of at least one cryptic species[34].
Here we quantify the wing color patterns of individuals from fivePolythorespecies (P. auro-ra,P.neopicta,P.ornata,P.spaeteri, andP.victoria). The first of these species has a relatively wide distribution in the Amazon Basin in Peru, Ecuador and Brazil; the remaining species have limited distributions in the Amazon Basin of Central Peru on the eastern slopes of the Andes. As the wing patterns of these species are very elaborate, quantification is not a simple task. We here utilized three methodologies: geometric morphometrics, chromaticity analysis, and Gabor Wavelet Transformation (GWT). These methods allow us to measure differences in wing color pattern, and to determine which components of the wing pattern contribute to those differ-ences. To begin exploring phylogenetic relationships, we also sequence the mitochondrial bar-code gene Cytochrome oxidase I (COI) to assess species definitions and population genetic diversity. Finally, we use the results of our morphometric analysis in a novel approach, to gen-erate a morphological dataset for phylogenetic analysis, and directly compare the resulting tree with our molecular phylogeny. The use of wing color and pattern to describe species is based on one hypothesis about the congruence between morphological and genetic diversity in these damselflies. First, coloration may have been selected through sexual selection to indicate mate quality or mate identity. If this were the case, we would predict that there would be high con-gruence between wing color diversity and phylogenetic patterns. If, however, speciation is cur-rently taking place or there is introgression between individuals with different wing forms, we would not expect congruence in morphological and molecular data.
We found that, while wing pattern diversity is high, distinct and discrete wingforms exist. However, these distinct wingforms do not match clearly with individual species as determined through preliminary phylogenetic analysis: significant differences exist in the genetic diversity of individuals with the same wingforms, while in other cases, there are no differences in wing-forms between individuals that are different genetically. We consider the implications of these results regarding the true diversity within this genus, and the potential explanations for why this diversity may have evolved.
Methods
Taxon Sampling
A total of 94 specimens were collected from localities in regions of the lower and central Ama-zon basin of Peru in July and September of 2008 (Fig 2A, Table A inS1 File). Specimens were collected with permission from the Instituto Nacional de Recursos Naturales (INRENA) of Peru (Authorization #62-2008-INRENA-IFFS-DCB and #016 C/C-2008-INRENA-IANP). All
Color Polymorphism Quantification
In order to measure morphological differences in the wings amongPolythorespecies and among males and females within those species, and to facilitate quantitative comparison of morphological and molecular evidence, we analyzed images of wings using three different methods. First, shape analysis (geometric morphometrics) was used to compare the shape and relative position of bands in the wings (see“Landmarking analysis”below). Second, differences in the color of different parts of the wings were captured using a novel method for color analy-sis (see“Chromaticity analysis”below). Finally, wing patterning (the arrangement of light and dark patches in the wings) was compared using a technique that is common in the field of com-puter vision (see“Gabor wavelet transformation (GWT) analysis”below). These approaches al-lowed us to numerically describe three different, but interconnected aspects of wing
morphology (shape, color, and patterning) in the highly polymorphicPolythore.
Imaging. Four males ofP.aurora, 21 males and 5 females ofP.neopicta, 17 males and 6 females ofP.ornata, 11 males ofP.spaeteri, and 16 males ofP.victoriawere digitized for mor-phological analysis. The left forewing and hindwing of each specimen was excised and scanned using a HP Deskjet F2180 scanner/printer (Hewlett-Packard Co., Palo Alto, CA, USA) in color
Fig 2. Collection localities ofPolythoreused in this study and phylogenetic reconstruction using Cytochrome oxidase I (COI).(A) map of collection localities of and (B) phylogenetic reconstruction (best ML phylogram) using COI data, values above the branches represent bootstraps support (ML) and posterior probabilities (BI). The magenta dots on the nodes represent the OTUs or species boundaries estimated by the PTP species delimitation model; lighter color represents less-supported probability for that OTU.
(RGB) at a resolution of 600 dpi. The wings were placed so that the ventral side of the wing was scanned (the side of the wing most often in view at rest and most commonly in view from the ground during flight). Images were saved as JPEG files.
Computation. Images were processed and analyzed (except where indicated) using cus-tom scripts written inMathematica(v10; [35]). These scripts are available for download as a
Mathematicanotebook (S2 File).
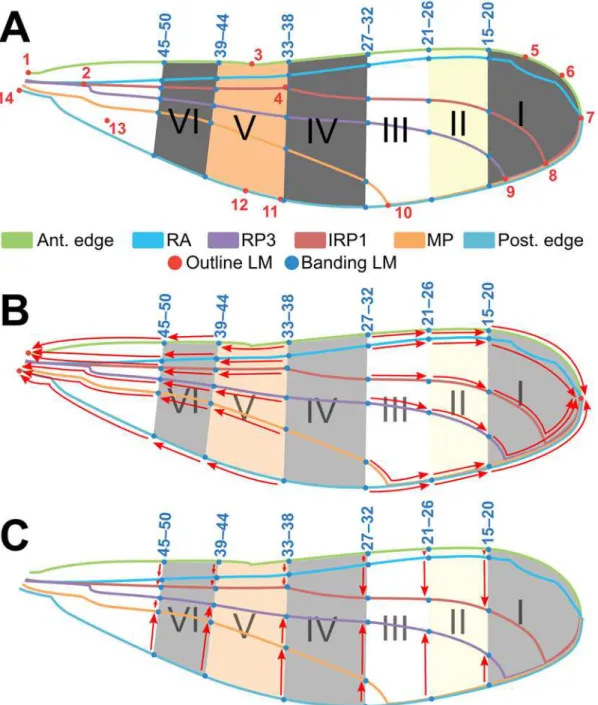
Landmarking analysis. To compare relative position and shape of wing banding patterns, allowing for comparison among individuals, landmarks (LMs, hereafter; i.e. Cartesian coordi-nates) were placed on the wing scans. A standard set of 50 LMs (Fig 3A) was placed on each digitized fore- and hindwing using tpsDig (v2.05; [36]); all landmarking was performed by a single technician to ensure consistent LM placement.
Two subsets of landmarks were applied to each wing. LMs 1–14 designated the position of junctions of six major longitudinal veins in the wing, reflecting underlying wing structure (Fig 3A, red dots). LMs 15–50 were positioned to designate the outlines of color bands on the surface of the wing (Fig 3A, blue dots). A number of different bands exist in the wings of
Polythorespecies; to account for all possible banding patterns we designed a“default wing”
(Fig 3) with six total bands (numbered I–VI) as a template for placement of LMs, such that there were sufficient LMs to capture the full range of wing patterning for all species under study. See Fig. A inS1 Filefor examples of wing scans and their respective landmarks.
LMs were placed exactly where the band intercepted with six reference veins (the anterior edge, RA, RP3, IRP1, MP, and the posterior edge, using venation terminology from Riek & Kukalová-Peck [37]), so that there were six LMs per band. In some cases, a specimen lacked one or more bands and/or had bands that did not extend all the way to the anteroposterior or proximodistal edges of the wing. In order to account for this, LMs were“collapsed”to other LMs using a standardized protocol as described below.
The default wing was divided into two parts between bands III and IV (Fig 3B). If the speci-men lacked any of the bands I–III, the points for that band were collapsed to the next existing band to the right (distally), or to the outermost point (LM 7) if the specimen lacked band I. Likewise, if the specimen lacked any of the bands IV–VI, the LMs for those bands were lapsed to the next existing band to the left (apically). If band VI was absent, its LMs were col-lapsed equally between LMs 1 and 14, with the upper three LMs being colcol-lapsed to LM 1 and the lower three being collapsed to LM 14. When a band did not extend all the way to the anteri-or anteri-or posterianteri-or edge of the wing, it was collapsed medially to the point where the next closest reference vein intersected the band (Fig 3C).
To remove the effects of scale and rotation, LMs for the full set of fore- and hindwings were Procrustes superimposed [38], separately, and recombined into one dataset for analysis. Pro-crustes superimposition was done using the Geometric Morphometrics package for Mathema-tica(v11.1; [39]). The landmarking procedure described here resulted in 200 coefficients per specimen (50 two-dimensional Cartesian coordinates per fore- and hindwing).
Chromaticity analysis. To compare wing coloration across specimens, square RGB images were separated into their component image channels (red, green, and blue), where each channel is an array of pixel values ranging from 0 (black) to 1 (white). Pixel values were transformed into chromaticity coordinates (CCs), which removes the possible effect of non-standardized lighting between images (luminance) and the correlation between red, green, and blue channels
Fig 3.“Default wing”used as a template for landmarking analysis of fore- and hindwings ofPolythorewingform.The positions of six major bands (I– VI) are marked as the cross six longitudinal veins: anterior edge or costa (C), radius anterior (RA), second branch of radius posterior (RP2), third branch of radius posterior (RP3), media posterior (MP), and posterior edge (venation terminology per Riek & Kukalová-Peck (1984)). (A) LMs 1–14 are major morphological points representing the basic venation pattern (~outline) of the wing, and LMs 15–50 represent the proximal edges of the six bands. (C–D) red arrows depict protocol for“collapsing”LMs in (C) proximodistal and (D) anteroposterior directions in wings where bands are missing or do not extend the full width of the wing (seeMethodstext for full description).
[40–42]. CCs (r,g, andb) are calculated with a simple transformationr = R/(R + G + B),
g = G/(R + G + B), andb = B/(R + G + B), whereR,G, andBare the pixel values for the red, green, and blue channel, respectively [42].
Instead of comparing every transformed pixel value among the images of every specimen, which would be computationally taxing and potentially uninformative, the square images were broken into successively smaller sub-images: the first comprising the entire image, the next two comprising each wing, separately, then the proximal, middle, and distal thirds of each wing, and finally the upper and lower halves of each of those wing thirds (see Fig. C inS1 Filefor visual ex-planation). This image-sampling procedure is somewhat similar to that of the GWT (see below; [43]). The mean pixel values forr,g, andbwere then calculated for each sub-image. This process yielded 63 chromaticity coefficients per image (21 sub-images × 3 CCs per sub-image).
Gabor wavelet transformation (GWT) analysis. A Gabor wavelet is a type of scalable, ro-tatable, two-dimensional wave form, which can be used to distill the complex features of an image into relatively few coefficients that describe the gross patterning of light and dark regions in the image (e.g. wing veins, edges, and color patches). Gabor wavelet transforms (GWTs), where a set of Gabor wavelets are convolved over images to encode them, have many applica-tions for image processing, including optical character recognition, fingerprint and iris recogni-tion, and image compression [44,45] since Gabor wavelets behave similarly to cells of the visual cortex in mammals [46].
In this study, GWTs were used to transform each of the square images into a list of coeffi-cients, describing the patterning of its wings. Each RGB image was first converted to grayscale, then the two components of the wavelet (real and imaginary) were applied using four scales (512, 256, 128, and 64 px in diameter; see Fig. D inS1 Filefor wavelet arrangement) and three rotations (0°, 120°, 240°), giving 510 coefficients per image. The script for this analysis was adapted from code provided by G.J. Russell.
Comparative analysis of wing morphology. Wingform morphology was compared using the landmarking, chromaticity and GWT datasets individually, as well as a combined set of all three. Each dataset was transformed using Discriminant Analysis of Principal Components (DAPC)[47]. This two-step analysis comprised (1) finding the first 50 principal component axes (PCs, inMathematica), and (2) finding the Linear Discriminants (LDs) of those PCs in PAST [48]. To determine which coefficients from the untransformed dataset contributed most to each DAPC axis (i.e. the separation between wingforms), the contributions of each coeffi-cient were calculated (similarly to [47]) as DAPC contribution vectors = |(loading vectors for 1st50 PCs) (LD loading vectors)|. Values in each contribution vector were converted to propor-tions of the sum of values in that vector, so that each value in a contribution vector gave the rel-ative contribution of the corresponding dataset coefficient to that DAPC axis (i.e. for a given contribution vector, coefficients with the highest values contributed the most to the separation of wingforms along the corresponding DAPC axis). For the seven wingforms analyzed in this paper, the DAPC process produced 6 (7 groups—1) DAPC axes, and therefore, 6 DAPC contri-bution vectors. Additionally, Mahalanobis distances [49] were calculated between wingform centroids, using all 6 DAPC axes, to compare how well each analysis separated wingforms.
Phylogenetic Reconstruction
Nucleotide variation was assessed in one mitochondrial gene (Cytochrome oxidase I, COI), using the universal primers CJ-2195 and TL2-N-3014 [51]. PCR was carried out in 20μL vol-ume reactions containing 1 to 2μL of DNA, 1X Buffer, 2 mM MgCl2, 0.8 mM dNTPs, 0.5 mM of each primer, and 0.03 U/μL of KapaTaq DNA polymerase. PCR conditions were 94°C for 60 s (two cycles), followed by 94°C for 45 s, 48°C for 45 s and 72°C for 60 s, and 29 cycles at 94°C for 45 s, 52°C for 45 s and 72°C for 1 min and 30 s. PCR products were purified using the NucleoSpin Gel and PCR purification kit (Macherey-Nagel, Düren, Germany). Sanger Se-quencing reactions were performed bidirectionally at MACROGEN Inc. laboratories (Seoul, Korea). Forward and reverse sequence strands were assembled and edited using SeqManII v5.03 (DNAstar, Inc., Madison, WI, USA) and consensus sequences were aligned using Clustal W [52], as implemented in MEGA v. 5.1 [53].
Molecular phylogenetics. In order to increase our overall sample size and improve the res-olution of our phylogenetic analyses, we included the individuals used for wing morphometric analysis as well as sequences from an additional 31 individuals from the following species:P. pro-cera(19 individuals),P.spaeteri(6 individuals),P.gigantea(5 individuals) and the confamilial
Euthore fasciatawhich was used as outgroup (one individual). The sequences associated with these additional individuals were downloaded from GenBank (see Table A inS1 Filefor acces-sion numbers for all sequence data). Phylogenetic reconstructions were performed using maxi-mum likelihood (ML) and Bayesian inference (BI) criteria. ML analysis was implemented in Garli (v2.0; [54]). The best nucleotide substitution model for our data was HKY+G, as selected by Mega (v5.2; [53]). Bootstrap supports for each branch were obtained after running 5000 pseudo-replicates of the best estimated topology; the consensus tree was summarized using Sum-Trees (v3.3; [55]). The BI analysis was performed in MrBayes (v3.2; [56]), where two indepen-dent runs were conducted. Four different heated MCMC chains were used; we ran 10 million generations, sampling a topology every 100 cycles, using default priors for all parameters, and using the GTR+I+G substitution model previously selected by jModeltest 2 [57,58]. Convergence in the posterior probabilities for the two runs was assessed by examining the average standard deviation of split frequencies, and using Tracer v1.6 [59]. Burn-in samples (1 million genera-tions) were discarded and the remaining samples were combined to produce a 50% majority-rule consensus tree, with bipartition frequencies equal to posterior probability values. Both topologies (i.e. ML and BI) were visualized using FigTree (v1.4.1; [60]). We estimated the evolutionary net divergence between the obtained clades and the standard error using Mega [53].
Population genetics analysis. In order to assess the intraspecific genetic variation that the traditional phylogenetic tree analyses lack the power to solve [63], we applied a network repre-sentation of the haplotype relationships, including unsampled haplotype variants. Thus we cal-culated a Minimum Spanning Network (MSN) in the population genetic suite Arlequin (v3.5, [64]), and visualized it using HapStar [65]. To establish the genetic diversity of the geographical populations sampled, polymorphism statistics (i.e. number of haplotypes (h), haplotype diver-sity (Hd), genetic diverdiver-sity (π), and genetic diversity per segregating sites (θ(S)) were estimated for each geographical population where the total number of individuals was>10 (e.g. Pozuzo, Pampa Hermosa, and Panguana) with DnaSP (v5.10; [66]). Neutral evolution was tested with the Tajima D test [67] in Arlequin, assuming the well-accepted premise that mtDNA does not recombine. To determine the degree of population structure between all the geographical pop-ulations, pairwise FSTvalues were calculated in Arlequin and 95% statistical significance for each test was obtained by 10,000 randomizations.
Species delimitation. To test if the morphospecies described using color patterns are con-sistent with our phylogenetic hypothesis; we ran a single-marker model for species delimitation called a Poisson Tree Processes (PTP). This model relies on the number of substitutions of a tree topology, assuming that the number of substitutions among species will be higher than the number of substitutions within the species[68]. The ML phylogram was used to calculate the probabilities that support species boundaries detected by the model. PTP was run via the web interface sponsored by the Exelixis Lab (Alexis Stamatakis:http://sco.h-its.org/exelixis/web/ software/PTP/index.html).
Results
Color Polymorphism Quantification
In total, the wings of 79Polythorespecimens from the five species collected from Peru were an-alyzed with the three color polymorphism (CP) quantification methods (landmarking, chro-maticity, and GWT). These included both males and females ofP.neopictaandP.ornata, and males only forP.aurora,P.spaeteri, andP.victoria—seven wingforms in total. Upon visual comparison, patterning varied markedly both within and among wingforms (Fig 1).P.aurora
males appeared to be the most variable, whileP.neopictamales andP.ornatafemales appeared to be the least variable.
Landmarking analysis. Wings in all scans were landmarked; examples of specimens with landmarks are shown in Fig. A inS1 File. Mean shapes for the wingforms are shown inFig 4. In all wingforms, at least one band was collapsed to the proximal or distal end of the wing, while all six bands were collapsed in the forewing ofP.ornatafemales and hindwing ofP. spae-terimales (seeFig 1).
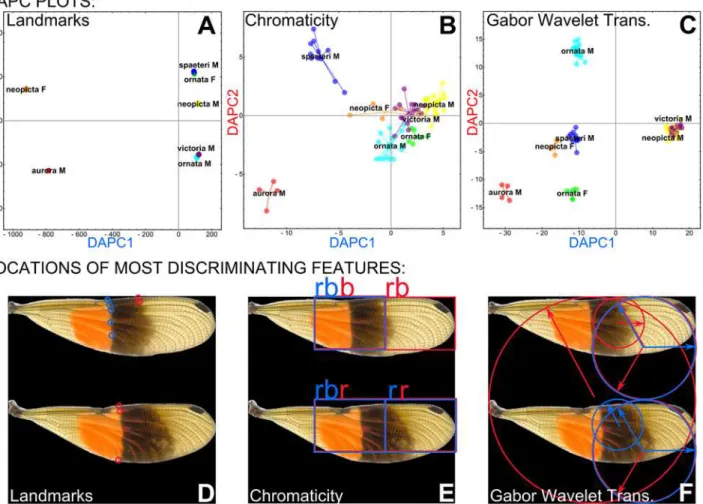
Comparison of morphological analyses. DAPC and Mahalanobis distances (MDs) were used to determine which morphological analysis produced the best separation between wing-forms. Plots comparing the first two DAPC axes (i.e. the first two dimensions of the 6-dimen-sional discriminant space) are shown in Fig5A–5Cand Fig. F.A inS1 Filefor the landmarking, chromaticity, GWT, and combined analyses, respectively. From these DAPC plots, the com-bined analyses and landmarking analysis appeared to give the most separation, while the chro-maticity analysis appears to give the least separation. Interestingly, different wingforms group together depending upon the method used. For instance,P.victoriamales grouped withP. neo-pictamales in the chromaticity, GWT, and combined analyses, but grouped withP.ornata
Despite these apparent differences, however, the MD for pairs of wingforms (measured in stan-dard deviations), calculated from all six DAPC axes, showed similar degrees of separation be-tween most wingforms (Table 1). Mean MDs were as follows: landmarking, 4.32, combined, 4.31, GWT, 4.27, and chromaticity, 3.67. MD values consistently exceeded an arbitrary thresh-old of 3.0 for all wingform pairs except forP.neopictamale—P.ornatamale andP.neopicta
male—P.victoriamale, which consistently showed lower MDs, andP.ornatamale—P.victoria
male andP.spaeterimale—P.victoriamale, which had lower MDs from the chromaticity anal-ysis.P.auroramales showed the highest degree is separation from all other wingforms along withP.neopictafemale—P.ornatafemale.
The axes of the DAPC plots shown in Fig5A–5Cand Fig. F.A inS1 Fileeach comprise a lin-ear combination of the original coefficients that were analyzed. We can determine the relative contribution of each of the original coefficients to each DAPC axis (i.e. which coefficients con-tributed the most to an axis, and thus best discriminated between wingforms). Relative contri-butions for the first and second DAPC axes for each analysis are shown in Figs. E and F.B in S1 File; the five highest-contributing coefficients are highlighted in red. Each of the coefficients corresponds to a particular location on the wings of our specimens, which can be mapped back onto the wings to determine which wing parts are most informative for wingform discrimina-tion. In Fig5D–5Fand Fig. F.C inS1 File, the parts of the wings corresponding to the highest-contributing coefficients for each analysis have been highlighted on an example specimen, where blue and red shapes represent the highest contributors to the first and second DAPC axes, respectively. In the figure, landmarks are represented as small circles; chromaticity sub-images are represented as boxes around the appropriate portion of the square image, and letters
“r”,“g”, or“b”tell which chromaticity channel the sub-image corresponds to; and Gabor wave-lets are represented as circles over the piece of the image to which they were applied, each with an arrow denoting the direction of wavelet rotation. The top coefficients for the combined analysis all correspond to Gabor wavelets. Notice that there is some overlap between coeffi-cients that contribute the most to the first and second DAPC axis (represented as overlapping red and blue shapes). Overall, the medial section, and to a lesser extent the distal section, of the
Fig 4. Mean wing shapes forPolythorewing morphs from landmark analysis.Fifty landmarks were taken from individuals of the 7 wing morphs, Procrustes superimposed, and averaged together for each wing morph. Outline landmarks (LMs 1–14) are dashed; color bands (LMs 15–50) are solid lines and numbered from I to VI. SeeFig 2and text for detailed description of landmarking protocol. M = male, and F = female.
fore- and hindwings contributed the most to discrimination between the different wingforms. This particularly corresponds with wing bands IV and V (Fig 2A). The top contributing coeffi-cients in the landmark analysis werey-components—they-axis here corresponds to the proxi-modistal axis of the wings—of landmarks 33–38 in the forewing and 27–28 in the hindwing (Fig 5D); while in the chromaticity analysis, the most important features were all in the red and blue chromatic channels of the image, not in the green channel (Fig 5E).
Phylogenetic Reconstructions
Molecular phylogenetics. The phylogenetic topologies recovered for both criteria, ML and BI, were consistent (Fig 2B).P.auroraforms a well-supported monophyletic lineage, and seems to be the sister clade to all of the other taxa, although neither of the analyses estimates a support value for this branch. The highly supportedP.giganteaclade is sister to all the other taxa, fol-lowed by two highly supported reciprocal monophyletic clades:P.procerafrom Colombia and a clade that contains all of the individuals collected in the Central Amazon Basin of Peru (i.e.P.
ornata,P.spaeteri,P.neopictaandP.victoria,Fig 2B). Within this Amazon Basin clade, a dis-tinctive clade of the species,P.ornata/P.spaeteriencompasses two reciprocal monophyletic
Fig 5. Discriminant analysis of morphological results.Discriminant analysis of principal components (DAPC) plots for (A) landmarking, (B) chromaticity, and (C) GWT analyses. (D–F) areas of the wings corresponding to the 5 most discriminating coefficients for DAPC axes 1 and 2 for each of the analyses (see Resultstext for further explanation of D–F). Note: here, these locations are superimposed onto an image of aP.auroramale, for presentation, but represent variation among all individuals/wingsforms.
clades (Net divergence = 1.27%, SE = 0.004), while another equal clade composed ofP.neopicta
andP.victoriashows no distinction between these species, with their distinct wingforms (Net divergence = 0.052%, SE = 0.0028). Interestingly,P.neopictashows a paraphyletic position across the Amazon Basin clade; some individuals sampled in Oxapampa are closely related toP.
ornata, while other individuals sampled in Pozuzo localities and the Perené River Road region are close to, and in some cases even indistinguishable from,P.victoria(Fig 2A).
Morphological phylogenetics. For our phylogenetic analyses that include morphological traits (767 characters), we limited our dataset to males (68), such that each species would be represented by a single wingform. We obtained only one most parsimonious tree with a tree length of 4500.780 steps. The overall topology has a consistency index of 0.170, suggesting these traits are highly homoplasic. The retention index was 0.519, showing that, despite the homoplasic nature, the synapomorphic characters are informative. We recoveredP.auroraas sister to all other species, however only two individuals of this species clustered as a monophy-letic clade (Fig. G inS1 File). The remaining species were recovered as monophyletic, although
P.ornataandP.victoriahad low bootstrap branch supports (9 and 5%, respectively), and two individuals ofP.ornatawere recovered withinP.victoria.
Population Genetic Analyses
Overall, among the species and populations ofPolythoreincluded in this analysis we observed a total of 28 COI haplotypes. Of the two species sampled from Colombia,P.procerashows a
Table 1. Mahalanobis distances (MDs; calculated from first 6 DAPCs) between wingforms using for different combinations of morphological coefficients.
Wingform Pair LM CHRM GWT ALL MEAN
auroraM—neopictaF 5.92 4.92 5.8 5.88 5.63
auroraM—neopictaM 4.82 4.58 4.74 4.8 4.74
auroraM—ornataF 5.66 5.17 5.58 5.65 5.52
auroraM—ornataM 4.9 4.57 4.83 4.89 4.80
auroraM—spaeteriM 5.14 4.82 5.03 5.12 5.03
auroraM—victoriaM 4.96 4.58 4.88 4.93 4.84
neopictaF—neopictaM 4.39 3.18 4.32 4.36 4.06
neopictaF—ornataF 5.3 4.12 5.27 5.32 5.00
neopictaF—ornataM 4.49 3.35 4.43 4.47 4.19
neopictaF—spaeteriM 4.75 3.64 4.68 4.74 4.45
neopictaF—victoriaM 4.56 3.19 4.5 4.54 4.20
neopictaM—ornataF 4.02 3.49 4.02 4.05 3.90
neopictaM—ornataM 2.88 2.7 2.85 2.87 2.83
neopictaM—spaeteriM 3.27 3.13 3.23 3.25 3.22
neopictaM—victoriaM 2.98 2.09 2.87 2.93 2.72
ornataF—ornataM 4.14 3.64 4.15 4.15 4.02
ornataF—spaeteriM 4.36 4.08 4.4 4.41 4.31
ornataF—victoriaM 4.21 3.46 4.2 4.22 4.02
ornataM—spaeteriM 3.4 3.22 3.35 3.39 3.34
ornataM—victoriaM 3.11 2.25 3.08 3.1 2.89
spaeteriM—victoriaM 3.49 2.91 3.41 3.48 3.32
MEAN 4.32 3.67 4.27 4.31 4.14
M = male, F = female, LM = landmark coefficients, CHRM = chromaticity coefficients, GWT = Gabor wavelet transformation coefficients, and ALL = combined LM, CHRM, & GWT. MD is measured in standard deviations.
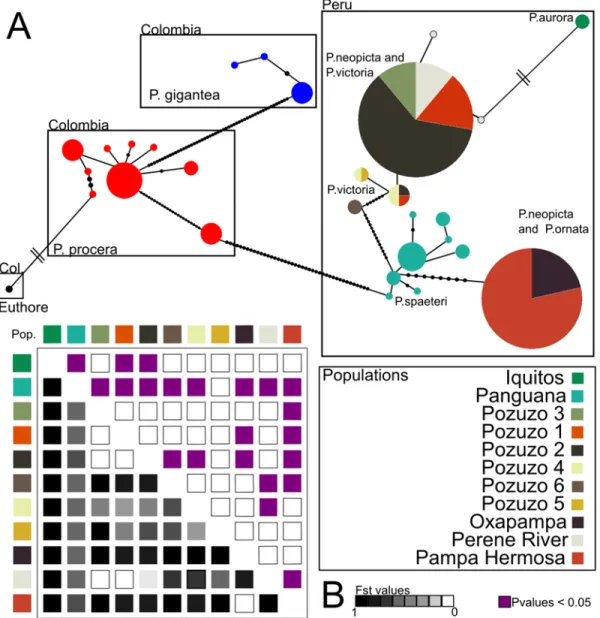
higher number of haplotypes (h = 8) in comparison withP.gigantea(h = 3). Forty-one missing or unsampled haplotypes are estimated betweenP.proceraandP.spaeterifrom Panguana in Peru. The haplotype network suggestsP.spaeteri(h = 8) as the source haplotypes from which all the remaining PeruvianPolythorehaplotypes are derived (Fig 6). Eight unsampled haplo-types associateP.ornatafrom Pampa Hermosa, andP.neopictafrom Oxapampa toP.spaeteri; while 12 unsampled haplotypes bridgeP.spaeteritoP.neopictaandP.victoriafrom localities near Pozuzo and the Perené River Road. Finally,P.neopictafrom the Perené River Road andP.
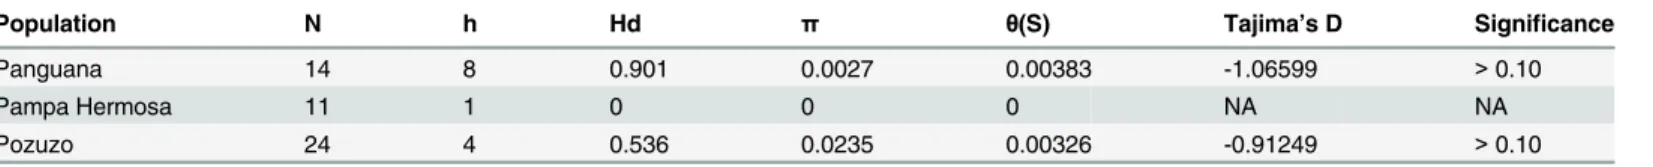
aurorafrom Iquitos are joined by more than 100 missing haplotypes between them (Fig 6). Genetic polymorphism statistics for the Peruvian populations with more than 10 individuals are shown inTable 2. The Panguana population (P.spaeteri) shows high haplotype and genetic
Fig 6. Comparison of mtDNA haplotypes amongPolythore.(A) mtDNA haplotype network and (B) FSTvalues across the geographical population. The
COI haplotype network shows the relationships among 29 haplotypes. Each circle represent an haplotype, the size of the circles represents the number of individuals sharing the haplotype, colors represent the geographical population, black small circles show missing or unsampled haplotypes, branch lengths are fixed and represent the genetic distance between the haplotypes, parallels lines represent more than 100 missing haplotypes and high genetic distance between the haplotypes. The population matrix is organized from Northern to Southern geographic location, colors underneath the diagonal represent the FSTvalues (i.e. gradient) and above the diagonal shows the significant p-values.
diversity in comparison with Pampa Hermosa (P.ornata) and Pozuzo populations (P.victoria—
P.neopicta). Pampa Hermosa (P.ornata) on the other hand shows a lack of genetic diversity, with only one haplotype representing the entire population. Tajima’s neutrality tests were all neg-ative and non-significant (Table 2), which suggest that the COI sequence is not subject to selec-tion and is evolving neutrally.
The calculated fixation index values for population structure (FST) show that the Panguana population (P.spaeteri) exhibited high and significant population structure (e.g. FST>0.88) compared to all the other sampled geographic populations (Fig 6and Table B inS1 File). The Pampa Hermosa population (P.ornata) showed high and significant population structure ex-cept with the Oxapampa population (P.neopicta) where the FSTvalue is 0, suggesting possible gene flow or a shared ancestral polymorphism between these two populations. Among the six localities sampled near to Pozuzo (P.victoria—P.neopicta), we observed a degree of significant
population structure across some of these populations (Fig 6and Table B inS1 File). Pozuzo 1, 2 and 3 show high structure as compared to Pozuzo 4 and 6, suggesting restricted gene flow among these populations. The lack of structure among Pozuzo 1, 2 and 3 and Pozuzo 4, 5 and 6 suggests possible recent gene flow between these two sets of geographical populations. Inter-estingly the FSTvalue of the Perené River Road population with Pozuzo 1, 2 and 3 is ~ 0, sug-gesting gene flow or a shared ancestral haplotype (Fig 6and Table B inS1 File).
Species delimitation. The PTP species delimitation model supports 9 species or Operation-al Taxonomic Units (OTU’s) based on our single marker COI. One of the supported OTU’s was the outgroupEuthore fasciata(p = 1). Within thePolythore, some of the OTU’s were highly sup-ported, with probabilities>0.70, while others were supported with probabilities<0.69 (Fig 2B). The Colombian species,P.giganteaandP.procera, were consistent with our expectations.P. pro-cerawas divided into two OTU’s (one supported with 0.658, and the other one with 0.903), which is consistent with the results previously obtained by Sánchez Herrera et al. 2010 (Fig 2B).
P.giganteawas recovered as an OTU with a high probability (0.705). The Peruvian species show incongruence with the morphological expectations.P.aurora,P.spaeteriandP.ornata/neopicta
were highly supported OTU’s, with probabilities of 0.988, 0.759 and 0.731, respectively (Fig 2B). TheP.victoria/P.neopictaclade was supported with a low probability (0.474) as only one OTU (Fig 2B). Despite the latter, two individuals ofP.victoriawere considered as another OTU with a high of probability 0.701 (Fig 2B).
Discussion
Patterns of Diversity
Our analyses of wing color patterns inPolythoredemonstrate that both the complexity of wing patterns—with some wingforms incorporating particular bands while others do not—and the in-terchanging of colors within those bands, come together to create a diverse range of phenotypes. Through our landmark analyses we show the influence of the different combination of bands on
Table 2. Peruvian geographical population polymorphism statistics.
Population N h Hd π θ(S) Tajima’s D Significance
Panguana 14 8 0.901 0.0027 0.00383 -1.06599 >0.10
Pampa Hermosa 11 1 0 0 0 NA NA
Pozuzo 24 4 0.536 0.0235 0.00326 -0.91249 >0.10
Number of individuals (N), Number of haplotypes (h), haplotype diversity (Hd), genetic diversity (π), genetic diversity per segregating sites (θ(S)), and Tajima’s D test including significance.
these phenotypes; for example, males ofP.victoriaandP.ornataare shown to be relatively simi-lar to one another (Fig 5AandTable 1), despite their obvious color differences (Fig 1). In this case, both wingforms have very similar banding, but the colors of the bands differ. These striking differences in color are shown in our chromaticity results (Fig 5B); while there is less resolution between the different wingforms, overall levels of melanization, in both the medial and distal parts of the wing, drive differences. Our GWT results incorporate both of these components; hereP.victoriaandP.ornataare shown to be quite different (as they are on visual inspection). Males ofP.victoriaandP.neopictashow great similarity, sharing similar overall color patterns as they do, but differing in the presence (P.victoria) or absence (P.neopicta) of a single, medial band. There are also differences in the overall variability of the phenotype components—banding patterns are relatively invariant, as reflected through the tight clustering of individuals sharing a common wingform in the LM and GWT analyses, but we see greater differences in the chroma-ticity values within wingforms. It is of note that these differences among and within wingforms are driven most by the red and blue components of color; the green component did not contrib-ute significantly. The combination of these analyses (Table 1and Fig. F inS1 File) resolves all of the analyzed wingforms effectively, except for the male wingforms ofP.neopictaversusP.ornata, andP.neopictaversusP.victoria; these wings all have black distal bands and differ only in the banding pattern preceding that shared band.
An interesting observation that can be made from these analyses concerns the way in which wing pattern diversity is generated in this group. While there are a number of distinct wing-forms observed inPolythore, these do not represent unlimited complexity; as shown by the as-sembly of our‘default wing’for landmark analysis, there are a fixed number of repeated pattern elements within the wings, such that a particular band may be present or absent within a wing-form, and if present may be of a different color within a different wingform. This suggests a fixed number of wing elements that can be expressed or suppressed, similar to the pattern ele-ments observed inHeliconiusbutterflies [69,70]. InHeliconius, these pattern element shifts are made through a small number of allele differences, and the same may be true ofPolythore. Ex-ploration of these wing pattern elements within this highly diverse group will allow for an un-derstanding of the mechanisms of wing pattern expression in the genus, and possibly more generally in odonates.
While distinct pattern elements can be identified through our morphometric analyses, our phylogenetic results are less clear. When considering the phylogenetic analyses of the morpho-logical dataset alone (Fig. G inS1 File), individuals sharing a common wingform generally form well-supported clades, reflecting the distinctness of the different wingforms. The greatest exception to this are the males ofP.aurora, which are found to be paraphyletic with respect to the remaining species; this is perhaps due to the rather extreme variability in the color intensity of individuals in our analyses (see the 3 examples at the top ofFig 1), Two individual males of
P.ornataclustered withP.victoriamales in the morphological phylogeny; this is likely due to variation in the hindwing banding patterns and forewing color patterns. Our molecular phylo-genetic analyses (Figs2Band7) and species delimitation analyses reveal that, for the Peruvian species studied here, there are some wingforms that correspond to well-defined species—such asP.spaeteriandP.aurora—while the wingforms associated withP.victoria,P.neopictaand
P.ornatado not resolve well.P.victoriaandP.ornataemerge in different locations within the tree, but haveP.neopictaindividuals contained within each of these two clades; a number ofP.
et al. (2010) and recovered in our own results (Fig 2B) we have a small clade of individuals from one site (Pozuzo 6) that, despite having the characteristicP.victoriawingform, are sup-ported as a separate species from the otherP.victoria. The lack of molecular separations be-tweenP.neopictaandP.victoria/P.ornataare at the heart of this lack of congruence between analyses. These preliminary analyses of the COI sequence suggest that a more extensive phylo-genetic exploration may be necessary to elucidate species relationships.
Topography is potentially very important in the distribution ofPolythore. The localities for
P.victoria,P.neopictaandP.ornataare all within steep river valleys with high ridges separat-ing them (Fig 2A);P.spaeteri, while at lower elevation between the Andes and Sira ranges, is also isolated from the other populations sampled in Peru. Thus, while the distances between these populations are not large, there are significant barriers to movement between these re-gions. In our haplotype network (Fig 6andTable 2),P.spaeterifrom Panguana, with its single wingform, shows relatively high genetic diversity in comparison to other groups that have
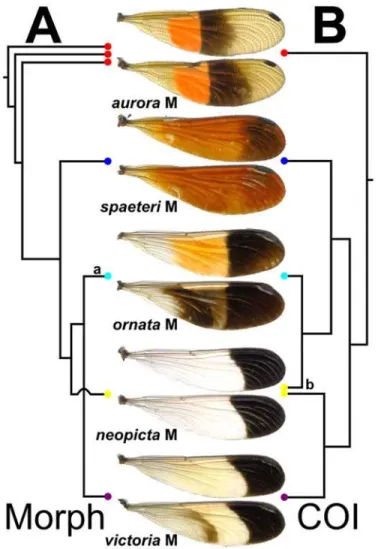
Fig 7. Comparison of the differing topologies among phylogenetic reconstructions.Simplified topologies are shown based on (A) morphological and (B) COI data, showing typical examples of each wing morph (center). Only males were included in these analyses. For full trees, seeFig 5and S1 Fig. G. Note: (a) P.ornatawas recovered as monophyletic (although with low, 9% bootstrap branch support) except for two specimens, which were recovered withinP.victoria(see S1 Fig. G); (b) in B, someP.neopictagrouped with P.ornata, while others grouped withP.victoria.
multiple wingforms, but little morphological diversity. Other haplotypes within the Peruvian
Polythorein our study appear to be derived from theseP.spaeterihaplotypes, possibly due to the highest genetic diversity present in that population.
Most of the species in this study were taken from the drainage basin of the Río Ucayali, one of the most water-rich headwaters of the Amazon (Fig 2A); the one exception isP.aurora
taken along the Río Marañón near Iquitos (see below). TheP.spaeterispecimens in this study were physically closest to the Río Ucayali confluence, taken at the Panguana field station, on the Río Llullapichis, a tributary of the Rxo Pachitea, which discharges into the Río Ucayali. The otherPolythorewingforms/species found in Peru, are all taken from river valleys (Pozuzo, Santa Cruz, Perené) that like the Pachitea, drain to the Río Ucayali. It is possible that there is some connectivity on the landscape through these river corridors, connectingP.spaeterito the
P.neopicta,P.ornataandP.victoriapopulations in higher-elevation streams, though some of the patterns seen from our high FSTsuggests that there is significant genetic isolation between the Pachitea river and Pozuzo River valleys (Figs5inset and6). Individuals in the putative cryptic species withP.victoriawingforms identified by our delimitation analysis were taken from site Pozuzo 6, which is actually in the valley of the Río Santa Cruz, a tributary of the Río Pozuzo; this latter river valley is where all of the other sample populations withP.victoria
wingforms are found. Within the higher-elevationP.ornatafrom Pampa Hermosa near the Perené River Valley shows a high genetic isolation with all the other populations from the Pozuzo Valley, except the Oxapampa. Finally, the Perené River Road population shows no dif-ferentiation with the Pozuzo Valley populations; this may represent an ancestral polymor-phism, rather than more recent gene flow due to the lack of connectivity between these regions (Fig 2A). Populations containing these latter three wingforms (Fig 1,P.neopicta,P.victoria
andP.ornata) are genetically less diverse, despite the greater morphological diversity (Fig 6 andTable 2).
The Ucayali flows north from central Peru to the Amazon and the region whereP.aurorais found. It is also of note that the haplotype ofP.aurora, is derived from theP.neopicta/P.victoria
haplotype group, rather than from those of the ColombianPolythore; sampling of other Poly-thorepopulations in Peru would help to better elucidate this relationship, but it is again possible that river corridors may be involved in establishing flow between these populations.
Why do we see such high wing pattern diversity that does not correlate to our molecular phylogenetics? A few explanations are available for these patterns; one is that these groups are currently speciating, and as yet are difficult to distinguish through molecular genetic tech-niques [71–75]. If this is the explanation for our pattern, then wing color phenotypes have al-ready diversified, but fully assortative mating has not yet established [76,77]. This is a potential explanation for theP.neopictawingform, which does not emerge as a separate species in our analyses, but as polymorphic forms of two other species,P.victoriaandP.ornata. If this is the case, then we have potentially two new species forming which share a common wing pheno-type. There is also the possibility that wingform is associated with species identity, but that in-trogression between individuals with different wingforms occurs regularly. This scenario begs the question of why hybrid wingforms are not observed in these zones: regular mixing has ap-parently not diminished wing phenotypic diversity [78,79].
wingform is common in one zone, another common in an adjoining zone, and a narrow border zone exists between the two where the two wingforms are encountered; these wingforms ap-pear to remain distinct, even in these overlapping zones. These distribution differences apap-pear to persist across years and seasons, suggesting that these wing colors are not influenced by the age of the individual or climatic conditions. Our haplotype analysis suggests that there may be gene flow between some of these localities with different wingforms (for example, between the sites in the Pozuzo Valley where theP.victoriaandP.neopictaclade is found) and as such we would consider these as a single population that is polymorphic.
In their recent review paper on the study of lineage divergence and speciation in insects, Mullen and Shaw suggest that a comprehensive understanding of the speciation process re-quires demonstrating the axes of differentiation in the system, the speciation phenotypes (i.e., traits whose divergence somehow limits gene flow, either directly or indirectly) and which evo-lutionary forces cause the divergence of a speciation phenotype, followed by an investigation of the genetic architecture of the speciation phenotypes and how they trigger further genome evo-lution in establishing species boundaries [80]. Here we have identified wing color patterning as a primary axis of differentiation, and the establishment of different wingforms as the pheno-types that may be associated with speciation. Now we must ask, what are the evolutionary forces driving this phenotypic divergence?
Hypotheses to Explain Color Polymorphism in
Polythore
Why did this extensive wing diversity arise in the first place? As has been noted previously, the majority of damselfly species that possess wing coloration display a single color in bands or spots on an otherwise clear wing, with much research supporting that this coloring functions to attracting mates or fend off conspecific male competitors [81,82]. If, similar to these other calop-terygoid damselflies, sexual selection is also the main driver of wing coloration inPolythore, it remains to be explained why in this group it has resulted in such elaborate wing patterns. Fur-ther exploration of this potential selective force would require mating behavior experiments within and among individuals ofPolythorewith different wingforms. Some diversity in mating behavior, such as differences in tendency for males to mate guard while the female oviposits, have been observed among differentPolythoreforms (MSH and CDB, unpublished data) and quantitative natural observations combined with experimental pairing between males and fe-males of different wingforms will determine how much wing coloration is a factor in mate choices in these damselflies. If it is found that mating preference is a function of wing color and pattern, this suggests that sexual selection is at least a factor maintaining wing diversity.
Another possibility that has been suggested (at least anecdotally) forPolythore, is that some of the wingforms may be under selection to resemble co-occurring toxic Ithomiinae and Heli-coniinae (clearwing) butterflies [9,83–85] (K. Tennessen, pers. comm.). Even if wing colors were initially under sexual selection, selection by predators for similarity to local defended but-terflies might have influenced wing color and pattern, in at least some species. It is of note that much recent work on speciation, introgression and wing ornamentation cited above comes from work on theHeliconiusmodel system; comparative studies of the distribution ofPolythore
Work on the diversification and genomics ofHeliconiusbutterflies has identified interesting patterns that are worth considering in the case ofPolythore, regardless of whether mimetic re-semblance may be involved in the evolution of the wing colors of these damselflies. Research suggests thatHeliconiuscolor patterning loci are tightly linked to alleles underlying variation in male preference[86]. InHeliconiustight physical linkage reduces recombination between loci associated with mating preference and color evolution and may facilitate the maintenance of positive assortative mating in this system. Introgression between differentHeliconiusspecies, while under strong selection from predators, may also provide the wing color diversity and adaptive novelty through wing color diversification[87], thus supporting the hypothesis that hybridization is an important source of adaptive novelty in this system. Considering what we now know about wing color diversity and species definitions in thePolythoredamselflies, a fur-ther exploration of behavior, color diversity and the genomics of wing coloration in this group may elucidate more generally the factors that can influence the development of CP, in damsel-flies as well as other organisms.
Supporting Information
S1 File. Supplementary Figures and Tables.
(DOCX)
S2 File.Polythorepolymorphism.zip.Compressed folder containing everything needed to run the analyses presented in this paper, including images, data, and a Mathematica notebook. (ZIP)
Acknowledgments
The authors would like to thank Juan Grados, Gerardo Lamas Müller and colleagues at the Natural History Museum in Peru for guidance and assistance with collections. We also thank many people for their hospitality during field work: Juliane Koepcke and Carlos Vásquez "Moro" Módena of the Panguana field station, the people of the villages of San Martín de Tipishca and Pozuzo, and Ernesto Lajara Loechle for assistance with transportation. We would like to thank David Polly and Gareth Russell for assistance with manuscript preparation.
Author Contributions
Conceived and designed the experiments: MSH WRK MOLC KMH NA TNS JH HVG JLW ACR CDB. Performed the experiments: MSH WRK MOLC KMH NA TNS JH HVG ACR CDB. Analyzed the data: MSH WRK MOLC NA JLW CDB. Contributed reagents/materials/ analysis tools: MSH WRK MOLC ACR JLW CDB. Wrote the paper: MSH WRK MOLC KMH NA TNS JH HVG JLW ACR CDB. Designed the code used in analysis: WRK.
References
1. Ford EB (1940) Polymorphism and taxonomy. In Huxley J. (Ed.) The New Systematics. Oxford: The Clarendon Press, page 493.
2. Lees DR, Creed ER (1975) Industrial melanism inBiston betularia: The role of selective predation. J Anim Ecol 44: 67–83. doi:10.2307/3852
3. Cain AJ, Sheppard PM (1954) Natural Selection inCepaea. Genetics 39: 89–116. PMID:17247470 4. Davison A, Clarke B (2000) History or current selection? A molecular analysis of“area effects”in the land snailCepaea nemoralis. Proc R Soc Lond B Biol Sci 267: 1399–1405. doi:10.1098/rspb.2000. 1156
6. Sinervo B, Lively M (1996) The rock-paper-scissors game and the evolution of alternative male strate-gies. Nature 380: 240–243.
7. Svensson EI, Sinervo B (2004) Spatial scale and temporal component of selection in side-blotched liz-ards. Am Nat 163: 726–734. doi:10.1086/an.2004.163.issue-5PMID:15122490
8. Gray SM, McKinnon JS (2007) Linking color polymorphism maintenance and speciation. Trends Ecol Evol 22: 71–79. doi:10.1016/j.tree.2006.10.005PMID:17055107
9. Corbet PS (1999) Dragonflies: Behaviour and ecology of Odonata. Colchester, UK: Harley Books. 802 p. 10. Fitzstephens DM, Getty T (2000) Colour, fat and social status in male damselflies,Calopteryx maculata.
Anim Behav 60: 851–855. doi:10.1006/anbe.2000.1548PMID:11124884
11. Vukusic P, Sambles JR (2003) Photonic structures in biology. Nature 424: 852–855. doi:10.1038/ nature01941PMID:12917700
12. Chapman RF (1998) The insects: Structure and function. Cambridge, MA: Cambridge University Press. 792 p.
13. Hooper RE, Tsubaki Y, Siva-Jothy MT (1999) Expression of a costly, plastic secondary sexual trait is correlated with age and condition in a damselfly with two male morphs. Physiol Entomol 24: 364–369. doi:10.1046/j.1365-3032.1999.00152.x
14. Grether GF (1997) Survival cost of an intrasexually selected ornament in a damselfly. Proc R Soc Lond B Biol Sci 264: 207–210. doi:10.1098/rspb.1997.0029
15. Grether GF (1996) Intrasexual competition alone favors a sexually dimorphic ornament in the rubyspot damselflyHetaerina americana. Evolution 50: 1949–1957. doi:10.2307/2410753
16. Grether GF (1996) Sexual selection and survival selection on wing coloration and body size in the ruby-spot damselflyHetaerina americana. Evolution 50: 1939–1948. doi:10.2307/2410752
17. Siva—Jothy MT (2000) A mechanistic link between parasite resistance and expression of a sexually selected trait in a damselfly. Proc R Soc Lond B Biol Sci 267: 2523–2527. doi:10.1098/rspb.2000. 1315
18. Joop G, Mitschke A, Rolff J, Siva-Jothy MT (2006) Immune function and parasite resistance in male and polymorphic femaleCoenagrion puella. BMC Evol Biol 6: 19. doi:10.1186/1471-2148-6-19PMID: 16522202
19. Córdoba-Aguilar A (2002) Wing pigmentation in territorial male damselflies,Calopteryx haemorrhoida-lis: a possible relation to sexual selection. Anim Behav 63: 759–766. doi:10.1006/anbe.2001.1974 20. Córdoba-Aguilar A (2008) Dragonflies and damselflies: Model for ecological and evolutionary research.
Cary, NC: Oxford University Press. 304 p.
21. Svensson EI, Eroukhmanoff F, Friberg M (2006) Effects of natural and sexual selection on adaptive population divergence and premating isolation in a damselfly. Evolution 60: 1242–1253. PMID: 16892974
22. Svensson EI, Friberg M (2007) Selective predation on wing morphology in sympatric damselflies. Am Nat 170: 101–112. doi:10.1086/518201PMID:17853995
23. Tynkkynen K, Kotiaho JS, Svensson EI (2008) Interspecific interactions and premating reporductive isolation. In: Cordoba-Aguilar A, editor. Dragonflies and damselflies: Model organisms for ecological and evolutionary research. Cary, NC: Oxford University Press. pp. 139–152.
24. Tynkkynen K, Grapputo A, Kotiaho JS, Rantala MJ, Väänänen S, Suhonen J (2008) Hybridization in Calopteryxdamselflies: the role of males. Anim Behav 75: 1431–1439. doi:10.1016/j.anbehav.2007. 09.017
25. Wellenreuther M, Vercken E, Svensson EI (2010) A role for ecology in male mate discrimination of im-migrant females inCalopteryxdamselflies? Biol J Linn Soc 100: 506–518. doi:10.1111/j.1095-8312. 2010.01464.x
26. Wellenreuther M, Tynkkynen K, Svensson EI (2010) Simulating range expansion: Male species recog-nition and loss of premating isolation in damselflies. Evolution 64: 242–252. doi:10.1111/j.1558-5646. 2009.00815.xPMID:19674095
27. Lorenzo-Carballa MO, Watts PC, Cordero-Rivera A (2014) Hybridization betweenCalopteryx splen-densandC.haemorrhoidalisconfirmed by morphological and genetical analyses. Int J Odonatol: 17: 149–160. doi:10.1080/13887890.2014.951696
28. Bick GH, Bick JC (1985) A revision of thepictagroup of Polythore, with a description of a new species, P.lamercedaspec. nov., from Peru (Zygoptera: Polythoridae). Odonatologica 14: 1–28.
29. Garrison RW, Ellenrieder N von, Louton JA (2010) Damselfly genera of the New World: An illustrated and annotated key to the Zygoptera. 1 edition. Baltimore, MD: Johns Hopkins University Press. 528 p. 30. Sánchez-Herrera M, Realpe E (2010) Population structure ofPolythore proceraat a Colombian stream
31. Contreras-Garduño J, Lanz-Mendoza H, Córdoba-Aguilar A (2007) The expression of a sexually select-ed trait correlates with different immune defense components and survival in males of the American rubyspot. J Insect Physiol 53: 612–621. doi:10.1016/j.jinsphys.2007.03.003PMID:17451742 32. Bick GH, Bick JC (1986) The genusPolythoreexclusive of thepictagroup (Zygoptera: Polythoridae).
Odonatologica 15: 245–273.
33. Robertson HM, Paterson HEH (1982) Mate recognition and mechanical isolation inEnallagma damsel-flies (Odonata: Coenagrionidae). Evolution 36: 243–250. doi:10.2307/2408042
34. Sánchez Herrera M, Realpe E, Salazar C (2010) A Neotropical polymorphic damselfly shows poor con-gruence between genetic and traditional morphological characters in Odonata. Mol Phylogenet Evol 57: 912–917. doi:10.1016/j.ympev.2010.08.016PMID:20736073
35. Wolfram Research (2010) Mathematica Edition: Version 8.0. Champaign, Illinois: Wolfram Research Inc. 36. Rohlf FJ (2005) tpsDig, digitize landmarks and outlines, version 2.05. Dep Ecol Evol State Univ N Y
Stony Brook.
37. Riek EF, Kukalová-Peck J (1984) A new interpretation of dragonfly wing venation based upon Early Upper Carboniferous fossils from Argentina (Insecta: Odonatoidea) and basic character states in ptery-gote wings. Can J Zool 62: 1150–1166. doi:10.1139/z84-166
38. Zelditch ML, Swiderski DL, Sheets HD (2004) Geometric morphometrics for biologists: A primer. Wal-tham, MA: Academic Press. 490 p.
39. Polly PD (2014) Geometric Morphometrics for Mathematica, version 11.1. Bloomington, Indiana: De-partment of Geological Sciences, Indiana University.
40. Gillespie AR, Kahle AB, Walker RE (1987) Color enhancement of highly correlated images. II. Channel ratio and“chromaticity”transformation techniques. Remote Sens Environ 22: 343–365. doi:10.1016/ 0034-4257(87)90088-5
41. Woebbecke DM, Meyer GE, Von Bargen K, Mortensen DA (1995) Color indices for weed identification under various soil, residue, and lighting conditions. Trans ASAE 38: 259–269.
42. Sonnentag O, Hufkens K, Teshera-Sterne C, Young AM, Friedl M, Braswell BH, et al. (2012) Digital re-peat photography for phenological research in forest ecosystems. Agric For Meteorol 152: 159–177. doi:10.1016/j.agrformet.2011.09.009
43. Russell K, Huff J, Do MT, Plantnick, MacLeod N (2007) Introducing SPIDA-web: wavelets, neural net-works and internet accessibility in an image-based automated identification system. Automated taxoni-dentification in systematics: Theory, approaches and applications. Boca Raton, FL: CRC Press. pp. 131–152.
44. Daugman JG (1988) Complete discrete 2-D Gabor transforms by neural networks for image analysis and compression. IEEE Trans Acoust Speech Signal Process 36: 1169–1179.
45. Weldon TP, Higgins WE, Dunn DF (1996) Efficient Gabor filter design for texture segmentation. Pattern Recognit 29: 2005–2015.
46. Daugman JG (1980) Two-dimensional spectral analysis of cortical receptive field profiles. Vision Res 20: 847–856. doi:10.1016/0042-6989(80)90065-6PMID:7467139
47. Jombart T, Devillard S, Balloux F (2010) Discriminant analysis of principal components: a new method for the analysis of genetically structured populations. BMC Genet 11: 94. doi: 10.1186/1471-2156-11-94PMID:20950446
48. HammerØ, Harper DA., Ryan PD (2001) PAST: paleontological statistics software package for educa-tion and data analysis. Palaeontol Electron 4: 9.
49. Szeliski R (2010) Computer Vision: Algorithms and Applications. Springer Science & Business Media. 824 p.
50. Doyle J, Doyle JL (1987) Genomic plant DNA preparation from fresh tissue-CTAB method. Phytochem Bull 19: 11–15.
51. Simon C, Frati F, Beckenbach A, Crespi B, Liu H, Flook P (1994) Evolution, weighting, and phylogenet-ic utility of mitochondrial gene sequences and a compilation of conserved polymerase chain reaction primers. Ann Entomol Soc Am 87: 651–701.
52. Thompson JD, Higgins DG, Gibson TJ (1994) CLUSTAL W: Improving the sensitivity of progressive multiple sequence alignment through sequence weighting, position-specific gap penalties and weight matrix choice. Nucleic Acids Res 22: 4673–4680. PMID:7984417
54. Zwickl D (2006) Genetic algorithm approaches for the phylogenetic analysis of large biological se-quence datasets under the maximum likelihood criterion. Austin, TX: The University of Texas at Austin.
55. Sukumaran J, Holder MT (2008) SumTrees: Summarization of Split Support on Phylogenetic Trees. Version 1.0. 2. DendroPy Phylogenetic Comput Libr Version 20 3.
56. Ronquist F, Teslenko M, van der Mark P, Ayres DL, Darling A, Höhna S, et al. (2012) MrBayes 3.2: Effi-cient Bayesian phylogenetic inference and model choice across a large model space. Syst Biol: sys029. doi:10.1093/sysbio/sys029PMID:22357727
57. Guindon S, Gascuel O (2003) A simple, fast and accurate method to estimate large phylogenies by maximum-likelihood. Syst Biol 52: 696–704. PMID:14530136
58. Darriba D, Taboada G, Doallo R, Posada D (2012) jModelTest 2: more models, new heuristics and par-allel computing. Nat Methods 9: 772. doi:10.1038/nmeth.2109PMID:22847109
59. Rambaut A, Suchard MA, Xie D, Drummond AJ (2014) Tracer v1.6. Available:http://beast.bio.ed.ac.uk/ Tracer.
60. Rambaut A (2014) FigTree v 1.4.1, A Tree Figure Drawing Tool. Available:http://tree.bio.ed.ac.uk/ software/figtree/.
61. Goloboff P, Farris J, Nixon K (2008) TNT, a free program for phylogenetic analysis. Cladistics 24: 774–786.
62. Maddison WP, Maddison DR (2011) Mesquite: A modular system for evolutionary analysis. 63. Posada D, Crandall KA (2001) Intraspecific phylogenetics: Trees grafting into networks. Trends Ecol
Evol 16: 37–45. PMID:11146143
64. Excoffier L, Lischer HEL (2010) Arlequin suite ver 3.5: a new series of programs to perform population genetics analyses under Linux and Windows. Mol Ecol Resour 10: 564–567. doi: 10.1111/j.1755-0998.2010.02847.xPMID:21565059
65. Teacher AGF, Griffiths DJ (2011) HapStar: Automated haplotype network layout and visualization. Mol Ecol Resour 11: 151–153. doi:10.1111/j.1755-0998.2010.02890.xPMID:21429113
66. Librado P, Rozas J (2009) DnaSP v5: A software for comprehensive analysis of DNA polymorphism data. Bioinformatics 25: 1451–1452. doi:10.1093/bioinformatics/btp187PMID:19346325
67. Tajima F (1989) Statistical method for testing the neutral mutation hypothesis by DNA polymorphism. Genetics 123: 585–595. PMID:2513255
68. Zhang J, Kapli P, Pavlidis P, Stamatakis A (2013) A general species delimitation method with applica-tions to phylogenetic placements. Bioinformatics 29: 2869–2876. doi:10.1093/bioinformatics/btt499 PMID:23990417
69. Joron M, Papa R, Beltrán M, Chamberlain N, Mavárez J, Baxter S, et al. (2006) A conserved supergene locus controls colour pattern diversity in Heliconius butterflies. PLoS Biol 4: e303. doi:10.1371/journal. pbio.0040303. PMID:17002517
70. Joron M, Jiggins CD, Papanicolaou A, McMillan WO (2006)Heliconiuswing patterns: an evo-devo model for understanding phenotypic diversity. Heredity 97: 157–167. doi:10.1038/sj.hdy.6800873 PMID:16835591
71. Brower AVZ (1996) A new mimetic species ofHeliconius(Lepidoptera: Nymphalidae), from southeast-ern Colombia, revealed by cladistic analysis of mitochondrial DNA sequences. Zool J Linn Soc 116: 317–332. doi:10.1006/zjls.1996.0022
72. Brower AVZ (2011) Hybrid speciation in Heliconius butterflies? A review and critique of the evidence. Genetica 139: 589–609. doi:10.1007/s10709-010-9530-4PMID:21113790
73. Mallet J (1989) The Genetics of warning colour in Peruvian hybrid zones ofHeliconius eratoandH. melpomene. Proc R Soc Lond B Biol Sci 236: 163–185. doi:10.1098/rspb.1989.0019
74. Mallet J, Barton NH (1989) Strong natural selection in a warning-color hybrid zone. Evolution 43: 421–431. doi:10.2307/2409217
75. Hill RI, Elias M, Dasmahapatra KK, Jiggins CD, Koong V, Willmott KR, et al. (2012) Ecologically rele-vant cryptic species in the highly polymorphic Amazonian butterflyMechanitis mazaeuss.l. (Lepidop-tera: Nymphalidae; Ithomiini). Biol J Linn Soc 106: 540–560. doi:10.1111/j.1095-8312.2012.01874.x 76. Feder JL, Gejji R, Yeaman S, Nosil P (2012) Establishment of new mutations under divergence and
ge-nome hitchhiking. Philos Trans R Soc B Biol Sci 367: 461–474. doi:10.1098/rstb.2011.0256PMID: 22201175
78. Mavárez J, Salazar CA, Bermingham E, Salcedo C, Jiggins CD, Linares M (2006) Speciation by hybrid-ization inHeliconiusbutterflies. Nature 441: 868–871. doi:10.1038/nature04738PMID:16778888 79. Salazar C, Jiggins CD, Taylor JE, Kronforst MR, Linares M (2008) Gene flow and the genealogical
his-tory ofHeliconius heurippa. BMC Evol Biol 8: 132. doi:10.1186/1471-2148-8-132PMID:18454858 80. Mullen SP, Shaw KL (2014) Insect Speciation Rules: Unifying Concepts in Speciation Research. Annu
Rev Entomol 59: 339–361. doi:10.1146/annurev-ento-120710-100621PMID:24160421
81. Honkavaara J, Dunn DW, Ilvonen S, Suhonen J (2011) Sympatric shift in a male sexual ornament in the damselflyCalopteryx splendens. J Evol Biol 24: 139–145. doi:10.1111/j.1420-9101.2010.02146.x PMID:21044198
82. Hassall C (2014) Continental variation in wing pigmentation inCalopteryxdamselflies is related to the presence of heterospecifics. PeerJ 2. Available:http://www.ncbi.nlm.nih.gov/pmc/articles/
PMC4060027/. Accessed 20 September 2014.
83. De Marmels J (1982) The genusEuthoreSelys in Venezuela, with special notes onEuthore fasciata fasciata(Hagen, 1853)(Zygoptera: Polythoridae). Adv Odonatol 1: 39.
84. Louton JA, Garrison RW, Flint OS (1996) The Odonata of Parque Nacional Manu, Madre de Dios, Peru; natural history, species richness and comparisons with other Peruvian sites. Manu, the biodiver-sity of southeastern Peru. Washington DC: Smithsonian Institution Press. pp. 431–449.
85. Beccaloni GW (1997) Ecology, natural history and behaviour of ithomiine butterflies and their mimics in Ecuador (Lepidoptera: Nymphalidae: Ithomiinae). Trop Lepidoptera 8: 103–124.
86. Kronforst MR, Young LG, Kapan DD, McNeely C, O’Neill RJ, Gilbert LE (2006) Linkage of butterfly mate preference and wing color preference cue at the genomic location of wingless. Proc Natl Acad Sci 103: 6575–6580. doi:10.1073/pnas.0509685103PMID:16611733