REVISTA BRASILEIRA DE GESTÃO DE NEGÓCIOS ISSN 1806-4892 REVIEw Of BuSINESS MANAGEMENT
© FECAP
RBGN
Received on August 22, 2013 Approved on July 7, 2015
1. María-Jesús Segovia-Vargas Doctor of Financial and Actuarial Economics
Universidad Complutense de Madrid (Spain)
[mjsegovia@ccee.ucm.es]
2. María-del-Mar Camacho-Miñano
Doctor of Accounting
Universidad Complutense de Madrid (Spain)
[marcamacho@ccee.ucm.es]
3. David Pascual-Ezama Doctor of Psychology Universidad Autónoma de Madrid
(Spain)
[david.pascual@ccee.ucm.es]
Review of Business Management
DOI:10.7819/rbgn.v17i57.1741
Risk factor selection in automobile insurance
policies: a way to improve the bottom line of
insurance companies
María-Jesús Segovia-Vargas, María-del-Mar Camacho-Miñano e
David Pascual-Ezama
Financial economics and accounting II, Universidad Complutense de Madrid, Madrid, Spain
Responsible editor: João Maurício Gama Boaventura, Dr. Evaluation process: Double Blind Review
ABSTRACT
Objective – he objective of this paper is to test the validity of using ‘bonus-malus’ (BM) levels to classify policyholders satisfactorily.
Design/methodology/approach – In order to achieve the proposed objective and to show empirical evidence, an artiicial intelligence method, Rough Set theory, has been employed.
Findings – he empirical evidence shows that common risk factors employed by insurance companies are good explanatory variables for classifying car policyholders’ policies. In addition, the BM level variable slightly increases the explanatory power of the a priori risks factors.
Practical implications – To increase the prediction capacity of BM level, psychological questionnaires could be used to measure policyholders’ hidden characteristics.
Contributions – he main contribution is that the methodology used to carry out research, the Rough Set heory, has not been applied to this problem.
1229 Rev. bus. manag., São Paulo, Vol. 17, No. 57, pp. 1228-1245, Jul./Sept. 2015
1 I N T R O D U C T I O N : C U R R E N T P R O B L E M S C O N C E R N I N G AUTOMOBILE POLICIES IN SPANISH INSURANCE COMPANIES
Spain is one of the European countries that were most hit by the inancial crisis that happened in Europe while this study was being prepared, particularly due to lack of inancial funding. In addition, it is one of the most relevant countries within the European Union (EU), since it was the 5th largest in terms of GDP in 2011, according to the International Monetary Fund (IMF) (2011). Spanish companies are trying to overcome the crisis from different approaches. For insurance companies, deining risk involves identifying events, their likelihood, and their costs; and, although this is easier for frequent events such as road accidents (Johnson, 2006), it is also important to be eicient from a management point of view, speciically, as to operational eiciency (PwC, 2012). As well as for keeping customers, this is necessary to manage risks properly. However, though the service sector has acquired a growing importance in national economies (Resende & Guimarães, 2012), there is little research concerning insurance services,
particularly those referring to the behavior of the parts involved in the ofer or demand of insurance services (Silva, 2004).
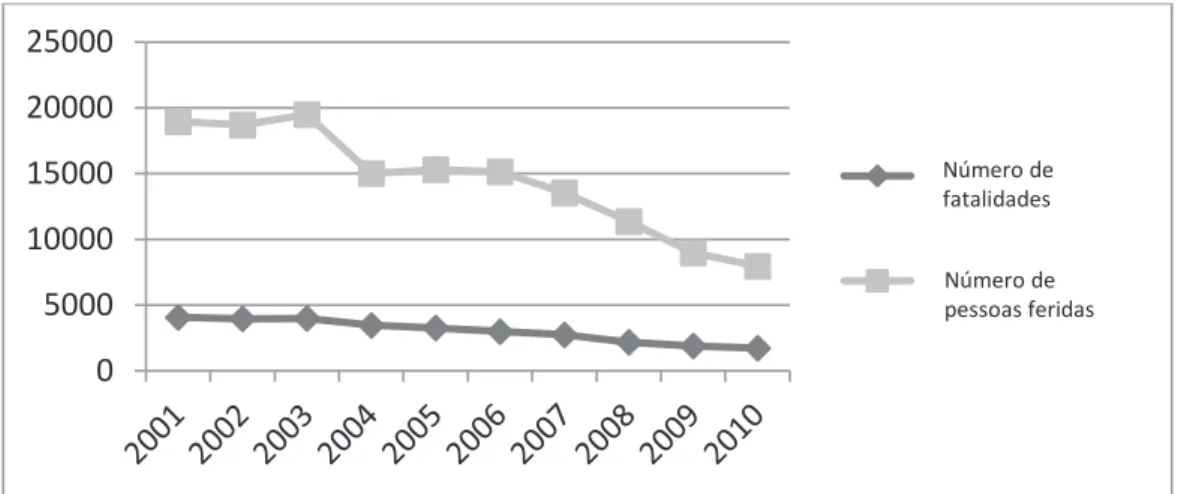
Insurance companies try to classify their insured policies into homogeneous tarif classes, assigning the same premium to all policies that belong to the same class in order to charge fair premiums to drivers. In fact, ‘accuracy is therefore crucial’, as Arvidsson (2010) inds. hus, it is extremely important for the insurance company to select an adequate set of risk factors to correctly predict future claim rates, for two main reasons. Firstly, insurance market competence is currently increasing overall due to internet company special ofers (Segovia-González, Contreras, & Mar-Molero, 2009). Secondly, the accident rate has decreased signiicantly over the last ten years – especially in Spain, with a reduction of 50% (see Figure 1). Due to these circumstances, the claim premium could efectively be readjusted, since the probability of high indemnities has decreased as a result. hese two readjustments need to be limited by insurance companies for economic viability reasons and to avoid bankruptcy. Consequently, convergence between insurance and fostering inancial stability is needed within insurance
companies.
3
“
”
0
5000
10000
15000
20000
25000
fatality number
injured person
number
Número de fatalidades
Número de pessoas feridas
María-Jesús Segovia-Vargas / María-del-Mar Camacho-Miñano / David Pascual-Ezama
It should be mentioned that the premium paid for an automobile insurance policy depends on the class to which the principal driver is assigned. his assignment has clear consequences for the two parties afected by the classiication system choice: the insurance company, due to the costs and the revenues incurred; and the insured driver, due to the premium rate. his policy classiication is based on the selection of so-called ‘risk factors’. hese factors are policy characteristics or features that help companies predict their claim amounts over a given period of time (usually one year). In automobile insurance, these are observable variables concerning the driver, the vehicle and traic. he main classiicatory variables used by the insurance industry are as follows: driver’s age, gender, accident or claim record of the principal driver, driving license date, vehicle kind and place of residence. hese variables are correlated with the claim rates, and therefore can be useful in order to predict future claims. he usual approach to select risk factors is based on statistical multivariate techniques, although these techniques still leave a great deal of heterogeneity within tarif classes. here is already a lot of scientiic literature dealing with the subject of the risk classiication of policyholders (Arvidsson, 2010; Denuit, Maréchal, Pitrebois, & Walhim, 2007).
However, when motor insurance products are being given a price range, there are many important factors that cannot be taken into account a priori, for instance: swiftness of relexes or the extent of aggressive behavior behind the wheel. Indeed, psychologists have been able to demonstrate that road crashes refer to drivers’ behavior (Aberg & Rimmö, 1998) and to driving violations (Arvidsson, 2010; Forward, 2008). It is therefore considered that these ‘hidden characteristics’ are partly revealed by the number of claims reported by policyholders (Pitrebois, Denuit, & Walhim, 2006). Hence, the premium
can be readjusted according to the number of claims reported by policyholders. his is usually done by integrating past claims history in a so-called ‘bonus-malus system’ (BMS). hus, BMS is a merit-demerit rating system with twofold purposes: to encourage policyholders to drive more carefully, as well as to better assess individual risks, so everyone pays a premium according to his or her own claim frequency history (Lemaire, 1988). BMS is used in several countries such as Spain or Brazil; therefore, the conclusions of this research are especially interesting for countries that have adopted this merit-demerit system. However, it is relevant at this stage to note that BMS is not used in all countries due to insurance market maturity and national culture (Park, Lemaire & Chua, 2009).
In this context it is noteworthy that BMS schemes ‘force’ policyholders to decide whether the magnitude of an accident is sufficiently great to justify a claim, since making a claim necessarily involves a future loss of discount. In addition, policyholders may have information, unobservable to the insurer, which predicts the ex-post risk (Arvidson, 2010). here is empirically demonstrated evidence that ‘drivers who were involved in traic accidents or crashes in the last year took more risks when driving’ (Iversen, 2004). However, while there is a continuing debate as to the efects, problems and beneits of BMS, its use may improve market eiciency (Heras, Vilar, & Gil, 2002; Hey, 1985; Richaudeau, 1999).
risk policyholders are inadequately assigned in the BMS, the company could incur a high costs risk. Such a situation could jeopardise the future of the insurance company. Consequently, another variable will be considered (BM level) together with the original risk factors in this study.
Bearing all these things in mind, the testing model of this paper is to examine the accident predictability to all factors with and without BM classes, and a comparison of the predictability of both models is carried out. We hypothesize that BM can add information for improving automobile policies classification into tarif classes. Moreover, this will be done to explain the ‘hidden factors’ for accurate insurance pricing. If the model with BM level signiicantly improves the explanation of claims rate referring to the models without BM level, the ‘hidden factors’ are consequently suiciently explained by the BM level variable.
his research paper is divided hereafter into the following sections: beginning with section 2 which shows the Rough Set method (RS). To test the model, the RS method will be employed due to its advantages. To date, there is no study that has applied this methodology to classify insurance policies. hen Section 3 describes the data and variables. In section 4 the methodology is shown whilst Section 5discusses and presents results. Finally, the conclusions and proposals will be described and outlined in section 6.
2 ROUGH SET METHODOLOGY
The RS methodology used to test the models proposed belongs to the domain of Artiicial Intelligence (AI). AI has demonstrated very high performance in classifying problems such as the one under study. Yet, there is little AI research devoted to the insurance industry, although it plays a growing and crucial role in modern economies. As is the case with other methodologies
of artiicial intelligence, the RS method has been successfully employed to investigate inancial problems such as inancial distress (Ahn, Cho, & Kim, 2000; Beynon & Peel, 2001; Dimitras, Slowinski, Susmaga, & Zopounidis, 1999; Sanchís, Segovia, Gil, Heras, & Vilar, 2007; Slowinski & Zopounidis, 1995), activity-based travel modeling (Witlox & Tindemans, 2004) or travel demand analysis (Goh & Law, 2003).
María-Jesús Segovia-Vargas / María-del-Mar Camacho-Miñano / David Pascual-Ezama
with single-choice and multi-choice answers. The authors apply RS theory to investigate the relationship between a single value and a combination of values of attributes. he results obtained with RS analysis are satisfactory because a hit test has been applied to check the feasibility of the decision rules obtaining a 100% hit rate test. The decision rules show the following customers’ insurance needs: the purchase purpose is endowment, the average annual premium was under US$ 938, the targets customers’ age 25-35 years and the most purchased product is a mixture of products. Moreover, given reasons for not purchasing are no interest and the age (too young, below 25 years old).
he selection of the RS method is based here not only on its being a high-performance classifying method, but also on its explanatory character. If the classiication result is satisfactory, then the conclusions derived from the methodology shall be analyzed.
his methodology has become a valuable new way to analyze inancial problems since it presents some fundamental advantages, such as the fact that it does not usually need variables to satisfy any assumptions. Statistical methods need explanatory variables to satisfy statistical assumptions, which can be quite difficult to achieve when working with real problems. In the data variable selection proposed here there are qualitative and quantitative factors to consider. his can complicate the analysis and the results obtained. hereby the elimination of redundant variables is achieved, so that the cost of the decision-making process and time employed by the decision-makers are reduced.
Indeed, RS method has not been applied to this problem yet. Until the date this research has been carried out, there is only one research paper referring to alternative procedures for risk factor selection. However, this is based on black box AI methods (Bousoño, Heras, & Tolmos, 2008).
hat is, although the results obtained in this paper are satisfactory, the AI methods employed are not as explanatory as RS.
RS theory was irstly developed by Pawlak (1991) in the 1980s as a mathematical tool to deal with uncertainty inherent to decision-making processes. hough nowadays this theory has been extended (Greco, Matarazzo, & Solwinski, 1998, 2001), this paper will use the classical approach. RS theory involves a calculus of partitions; therefore, it refers in some aspects to other tools that deal with uncertainty, such as statistical probability or fuzzy set theory. Unlike the RS method, there is a considerable literature on fuzzy set theory in insurance classiication (Ebanks, Karwowski, & Ostaszewski, 1992; Horgby, 1998; Lemaire, 1990; Shapiro, 2005; Wit, 1982; Young, 1996).
precise sets (McKee, 2000; Nurmi, Kacprzyk, & Fedrizzi, 1996).
hese diferences show one of the main advantages of RS theory: an agent is not required to establish any preliminary or additional information about the data. In the other two categories of imprecision, it is necessary to assign precise numerical values to express imprecision of the knowledge, such as probability distributions in statistics or grade of membership or the value of possibility in fuzzy set theory (Pawlak, Grzymala-Busse, Slowinski, & Ziarko, 1995).
he main concept of this approach is based on the assumption that, with every object in the universe, there can be correlation with associated knowledge and data. Knowledge is regarded in this context as ability to classify objects.
RS heory represents knowledge about the objects as a data table, that is, an information table in which rows are labelled by objects (states, processes, firms, patients, candidates…) and columns are labelled by attributes. Entries of the table are attribute values. Consequently, for each pair object-attribute, x-q, there is known a value called descriptor, f(x, q). In the problem that will be analyzed, the information table consists in the policies and the risk factors, that is, the objects will be each policyholder and the columns will be the risk factors used (see Table 1). herefore, the descriptor will be the risk factor value for each policyholder.
Occasionally, objects described by the same data or knowledge are indiscernible in view of such knowledge. he indiscernibility relation leads to the mathematical basis for the RS theory. Intuitively, a RS is a collection of objects that, in general, cannot be precisely characterized in terms of the values of a set of attributes. In real problems or databases, the occurrence of inconsistencies in classiications usually appears. In the case of study there are two classes in the database (drivers with
and without accident). If a good driver (without accidents) has the same values for all attributes (risk factors) as a bad one it is diicult to classify them properly into the corresponding classes. Mathematically, the indiscernibility relation can be expressed in terms of descriptors, that is, two objects, x and y, all their descriptors in the table have the same values, that is if, and only if, f(x, q) = f(y, q).
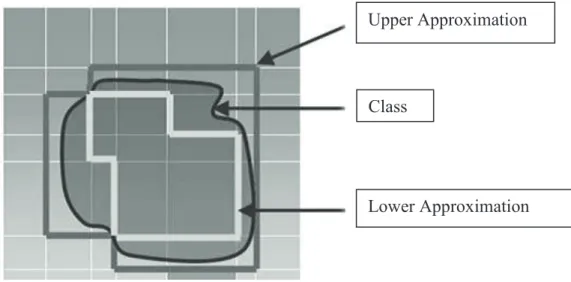
To find a solution, there are several ways: the first one consists in increasing the information (for example, considering more attributes) which, sometimes, is not easy or possible. Another possibility is eliminating these inconsistencies which is not a proper way because at least some information will be lost. Finally, another way is to deal with these inconsistencies by incorporating them to the analysis (that is RS case). RS methodology incorporates these inconsistencies creating some approximations to the decision classes. he lower approximation of a class or category consists of all objects that certainly belong to this class and can be certainly classiied to this category employing the set of attributes (in the case of study, the risk factors). he upper approximation of a class contains objects that possibly belong to this class and can be possibly classiied to this category using the set of attributes. he diference between the lower and the upper approximation, if it exists, is called the boundary or doubtful region: the set of elements that cannot be certainly classiied to a class, taking into account the set of attributes. Using the lower and the upper approximation, those classes that cannot be expressed exactly (there is a doubtful region) can be deined precisely using available attributes.
María-Jesús Segovia-Vargas / María-del-Mar Camacho-Miñano / David Pascual-Ezama
8
“ ”
Upper Approximation
Class
Lower Approximation
FIGURE 2 – Approximations in Rough Set heory
Note. Source: Adapted from “Rough Sets, heir Extensions and Applications”, by Q. Shen and R. Jensen, Journal of Automation and Compunting, 4, p. 218.
A fundamental problem of the Rough Set approach is identifying dependencies between attributes in a database, since it enables the reduction of a set of attributes by removing those that are not essential to characterizing knowledge. This problem will be referred as knowledge reduction or, in more general terms, as a feature selection problem. Feature selection problem would imply the possibility of correctly classifying objects without using the whole attributes that were originally taken into account. his is a very useful question, because it enables to a decision maker to classify focusing on the relevant variables what reduces time, efort and cost in a decision making process. For instance, in medicine this fact would imply to diagnose a patient more quickly if some proofs (especially the most painful or time-consuming ones) could be avoided if the experience demonstrates that they do not provide additional information to diagnose an illness. In the considered problem, the risk factors could be reduced without misclassifying the policies. In RS theory, there are several models to reduce the number of attributes. One of the most popular is the suggested by Skowron and Rauszer (1992). He proposed to represent the information table in a diferentiation matrix. It is a symmetric
matrix in which the rows and the columns are the objects (policies in this case, for instance xi y xj). Each entry in the table (cij) represents the attribute or set of all attributes (risk factors, in this case) that can diferentiate xi from xj. Comparing each object with the rest in terms of attributes, it is possible to calculate this matrix, and the core and the reducts will be obtained. A reduct is the minimal subset of attributes which provides the same classiication as the set of all attributes. If there is more than one reduct, the intersection of all of them is called the core and is the collection of the most relevant attributes in the table. If none of the attributes is redundant, it is impossible possible to obtain any reduct and, therefore, it will be necessary to use all the variables. But, if there is at least one reduct, it is possible to eliminate all the attributes that do not belong to it because they are redundant, that is, they do not provide any additional information.
undertaken when some conditions are satisied. he number of objects that satisfy the condition part of the rule is called the strength of the rule. he obtained rules do not usually need to be interpreted by an expert as they are easily understandable by the user or decision maker. Several algorithms can develop rules based on RS Theory. Bazan, Nguyen, Nguyen, Synak and Wróblewski (2000) have developed the one implemented within the software employed in the empirical part of this paper.
In sum: the most important result in the RS approach is the generation of decision rules, because they can be used to assign new objects to a class by matching the condition part of one of
the decision rules to the description of the object. herefore, rules can be used for decision support.
3 DATA AND VARIABLE SELECTION
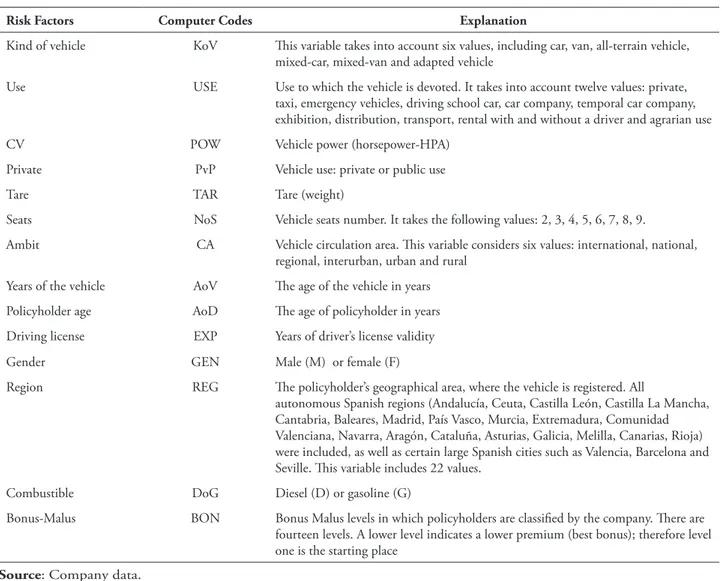
A real sample of 5,500 Spanish automobile policies observed during the year 2005 was employed. his data were provided by a large auto insurance company from Spain, although it is not generally available due to privacy legislation and industrial conidentiality issues. he risk factors (variables) employed by the company are the following fourteen (Table 1), usually accepted in the insurance business, which display a mixture of both qualitative and quantitative variables:
TABLE 1 – Deinitions of the variables used
Risk Factors Computer Codes Explanation
Kind of vehicle KoV his variable takes into account six values, including car, van, all-terrain vehicle, mixed-car, mixed-van and adapted vehicle
Use USE Use to which the vehicle is devoted. It takes into account twelve values: private, taxi, emergency vehicles, driving school car, car company, temporal car company, exhibition, distribution, transport, rental with and without a driver and agrarian use
CV POW Vehicle power (horsepower-HPA)
Private PvP Vehicle use: private or public use
Tare TAR Tare (weight)
Seats NoS Vehicle seats number. It takes the following values: 2, 3, 4, 5, 6, 7, 8, 9.
Ambit CA Vehicle circulation area. his variable considers six values: international, national, regional, interurban, urban and rural
Years of the vehicle AoV he age of the vehicle in years
Policyholder age AoD he age of policyholder in years
Driving license EXP Years of driver’s license validity
Gender GEN Male (M) or female (F)
Region REG he policyholder’s geographical area, where the vehicle is registered. All
autonomous Spanish regions (Andalucía, Ceuta, Castilla León, Castilla La Mancha, Cantabria, Baleares, Madrid, País Vasco, Murcia, Extremadura, Comunidad Valenciana, Navarra, Aragón, Cataluña, Asturias, Galicia, Melilla, Canarias, Rioja) were included, as well as certain large Spanish cities such as Valencia, Barcelona and Seville. his variable includes 22 values.
Combustible DoG Diesel (D) or gasoline (G)
Bonus-Malus BON Bonus Malus levels in which policyholders are classiied by the company. here are fourteen levels. A lower level indicates a lower premium (best bonus); therefore level one is the starting place
María-Jesús Segovia-Vargas / María-del-Mar Camacho-Miñano / David Pascual-Ezama
he sample is described in Table 2. Most database policies belong to men (74.3%). In all, 80% of auto policies are car in kind of vehicle, and speciically its main use is almost 100% private. he autos of the sample are gasoline in almost 6
out of 10 cases. he use zone of the car is urban in 74.2% of cases, while 22.3% is rural. he sample is concentrated in two regions: Andalusia (28.3%) and Madrid (10.5%).
TABLE 2 – Frequencies of variables referring to insurer, auto and circulation zone
Codes Categories Frequency Percent Valid Percent Cumulative Percent
Gen Male 4084 74.3 74.3 74.3
Female 1416 25.7 25.7 100.0
Kov Car 4394 79.9 79.9 79.9
Van 2 0 0 79.9
All-terrain vehicle 394 7.2 7.2 87.1
Mixed-car 347 6.3 6.3 93.4
Mixed-van 85 1.5 1.5 94.9
Adapted vehicle 278 5.1 5.1 100.0
pvp Public 47 0.9 0.9 0.9
Private 5453 99.1 99.1 100.0
Use Private 5358 97.4 97.4 97.4
Taxi 18 0.3 0.3 97.7
Emergency vehicle 1 0 0 97.8
Driving school car 13 0.2 0.2 98.0
Car company 48 0.9 0.9 98.9
Temporal car company 2 0 0 98.9
Exhibition 2 0 0 98.9
Distribution 10 0.2 0.2 99.1
Transport 1 0 0 99.1
Renting with driver 29 0.5 0.5 99.7
Renting without driver 17 0.3 0.3 100.0
Agrarian use 1 0 0 100.0
Dog Diesel 2271 41.3 41.3 41.3
Gasoline 3229 58.7 58.7 100.0
Ca Rural 1224 22.3 22.3 22.3
Urban 4081 74.2 74.2 96.5
Interurban 125 2.3 2.3 98.7
Regional 28 0.5 0.5 99.2
Nacional 2 0 0 99.3
International 40 0.7 0.7 100.0
Reg Melilla 17 0.3 0.3 0.3
Ceuta 18 0.3 0.3 0.6
Rioja 38 0.7 0.7 1.3
Cantabria 106 1.9 1.9 3.2
Navarra 134 2.4 2.4 5.6
Asturias 151 2.7 2.7 8.3
Baleares 145 2.6 2.6 10.9
Extremadura 446 8.1 8.1 19
Aragón 203 3.7 3.7 22.7
Murcia 175 3.2 3.2 25.9
C. Mancha 336 6.1 6.1 32
Canarias 2 0 0 32
P. Vasco 218 4.0 4.0 36
C. León 298 5.4 5.4 41.4
Galicia 272 4.9 4.9 46.3
Valencia 346 6.3 6.3 52.6
Madrid 575 10.5 10.5 63.1
Barcelona 285 5.2 5.2 68.3
Cataluña 176 3.2 3.2 71.5
Sevilla 373 6.8 6.8 78.3
Andalucía 1186 21.6 21.6 100.0
Other information (Table 3) of the sample is that the mean power of cars is 91.36 horsepower, the mean weight of vehicles is 1,198 kilos, the average number of seats is almost 5 and
the mean age of the vehicle is 6.5 years. he mean age of the policyholder is 44 years old, and the average driver’s license experience is over 20 years.
TABLE 3 – Descriptive statistics of the main variables of the sample
CLAIM POW TAR NoS AoV AoD EXP BON
non-accident N 2853 2853 2853 2853 2853 2853 2853
Mean 90.4048 1166.2471 4.9930 6.9113 44.8591 20.7774 3.0277
Std. Deviation 28.66927 292.12331 .58973 21.10206 14.11033 11.58152 2.59847
accident N 2647 2647 2647 2647 2647 2647 2647
Mean 92.3993 1232.9686 4.8515 6.0650 44.0147 20.1980 3.2116
Std. Deviation 28.32268 359.00620 .80968 5.01882 12.79749 10.82368 3.14247
Total N 5500 5500 5500 5500 5500 5500 5500
Mean 91.3647 1198.3584 4.9249 6.5040 44.4527 20.4985 3.1162
Std. Deviation 28.51782 327.69976 .70768 15.59640 13.49982 11.22590 2.87437
hese policies are assigned to two classes: (accident = A) or (non-accident = N_A). It is important to note that policyholders are assigned to these two classes taking into account reported claims (that is, when an accident is reported the policyholder is reclassiied to ‘class accident’ class), but crucially not their costs. his is because BMS in force throughout the world (with very few exceptions such as Korea) penalize just the number of claims (Lemaire, 1995).In this way, it seemed that accident class would be very heterogeneous, but it is qualiied taking into account the fourteen BM levels used by the company.
4 RESEARCH METHODOLOGY
The financial problem tackled is a classification problem, so new policyholders described by a set of risk factors are assigned to a category (accident or non accident). In order to achieve goal, two models are developed: irstly, one without BM level, and thereafter another with BM level. If the classiication accuracy (percentage of correctly classiied policyholders) in the irst model is higher than the classiication accuracy for the second one,then the BM level is a redundant
variable. On the contrary, if classiication accuracy in the second model is higher than the other one, then the BM level includes the ‘hidden factors’ for accurate insurance pricing. Depending on the diferences between the two models (with and without BM level), the BM level variable explanatory power is presented. The two RS models are obtained to explain the dependent variable (claims) without BM level and with the BM level variable.
If a classification model is developed and tested with the entire sample, the results obtained could be conditioned. So in order to avoid this happening, two random samples have been selected: a training set to develop the model (4,400 policies; or 80% of the whole sample) and a holdout sample to validate the rules (1,100 policies; or 20% of the total sample). he software used to perform the analysis allows splitting the table into two disjoint subtables randomly. However, it is necessary to specify the split factor to determine the size of theirst subtable and the other subtable complements the irst one. he split factor has been set at 0.8.
Rough set analysis has been performed using RSES21. This software follows step by
María-Jesús Segovia-Vargas / María-del-Mar Camacho-Miñano / David Pascual-Ezama
about RS theory. Before running the software, the continuous variables (vehicle power, tare, years of the vehicle, age of the driver and year number of the driving licence) were registered in qualitative terms. his registry was made by dividing the original domain into subintervals. While it is not imposed by the RS theory, it is very useful in order to draw general conclusions from the decision rules or to interpret them (Dimitras et al.,1999). he company, based on its internal analyses, has established some groups (intervals) for the majority of the continuous variables (power, years of driving license, years of policyholder age, years of the vehicle) to manage the risk of the policies and they have been adopted for the analyses. he only exception is the tare (weight) variable. herefore,in this research the subintervals are based on the information of the insurance company for all the continuous variables except for the tare variable. For this variable, the percentiles (10 to 90) have been employed in order to avoid subjective bias (see also researchers such as Laitinen, 1992; McKee, 2000). he optimal boundary values deinition in the subintervals is usually done by experts according to their experience, knowledge, habits or conventions (that is the reason why the groups established by the company have been adopted in the paper) (Dimitras et al., 1999; Slowinski & Zopounidis, 1995). If there is not an expert to recode the variables that could follow their experience or standards of inancial analysis, it is deemed desirable to avoid subjective bias to the greatest extent possible (therefore, percentiles have been adopted for tare variable).
After recoding risk factors, two tables were obtained. he two recoded training tables which consisted of 4,400 policies described with 13 (without Bonus-Malus variable) or 14 (with
Bonus-Malus variable) risk factors and assigned to a decision class (accident or not – 0) was entered into an input file in RSES2. The first result obtained by RS analysis is reduct calculation. One reduct has been obtained from the sample in both models, with and without BM level variable. he only variable that does not appear in the reduct is vehicle use (PvP), which has therefore been eliminated. Consequently, though RS theory is a very strong tool for feature selection, in this particular case the company has carefully selected the variables in order to focus on a few risk factors to make the decisions. In this way the time and the cost of the decision-making process are minimized.
After eliminating the redundant variable in both tables, RSES2 has induced two decision rule models (with and without Bonus Malus variable). Before analyzing the obtained rules, both models have been validated using the two test samples (1,100 policies each) randomly selected. To validate the rules, both models employ classiication accuracy in percentages of correctly classiied policyholders. he RS model 1 without BM variable has on average classiication accuracy of 72% while the RS model 2 with BM level variable has on average classiication accuracy of 74.5%.
In general, both models are satisfactory, because the percentage of right classiications is higher than 70%, and, therefore, the obtained rules for both models can be interpreted.
5 RESULTS AND DISCUSSION
TABLE 4 – RS model 1 without BM level
Rules KoV USE POW TAR CA AoV AoD EXP GEN NoS REG Class
1 54-75 Interurban 5 D N_A
2 20-30 50-65 G A
3 Regional 16-20 N_A
4 1010-1078 Interurban 30-40 G N_A
5 Interurban 10-15 F D N_A
6 76-118 Urban 30-40 Murcia A
7 1215-1290 Interurban 30-40 N_A
8 Regional 30-40 N_A
9 CAR Urban 30-40 M Murcia A
10 < 940 20-30 50-65 A
11 30-40 F N_A
12 Particular 20-30 50-65 A
13 VAN 3 N_A
14 > 20 2 D N_A
15 3 3 N_A
16 54-75 Interurban 5 M N_A
17 54-75 < 1 > 20 5 A
18 9 Interurban D N_A
19 < 1 > 20 G A
he RS model 2 with BM level variable is shown in Table 5.
TABLE 5 – RS model 2 with BM level
Rules KoV POW TAR CA AoV AoD EXP GEN NoS REG DoG BON Class
1 Interurban 8 N_A
2 < 940 20-30 20 1 A
3 Interurban 20-30 1 A
4 54-75 Interurban 5 D N_A
5 Interurban G 4 N_A
6 Van 119-215 1 N_A
7 119-215 3 1 N_A
8 20-30 50-65 G A
9 20-30 50-65 1 A
10 Regional 16-20 N_A
11 Interurban M 6 N_A
12 1010-1078 Interurban 30-40 G N_A
13 76-118 Interurban 4 N_A
14 Interurban 10-15 F D N_A
15 76-118 Urban 30-40 Murcia A
16 1215-1290 Interurban 30-40 N_A
17 Interurban D 6 N_A
18 Regional 30-40 N_A
19 Car 76-118 Urban 40-50 > 20 M 2 A
María-Jesús Segovia-Vargas / María-del-Mar Camacho-Miñano / David Pascual-Ezama
he rules for the irst model can be read as follows:
a) If power (POW) = (54-75 HPA.) and circulation area (CA) = interurban and the age of the vehicle (AoV) = (5 years) and combustible (DoG) = D (diesel), then N_A (non-accident).
b) If the age of the vehicle (AoV) = (21-30 years) and the age of the driver (AoD) = (50-65 years) and combustible (DoG) = G (Gasoline), then A (accident).
c) If the circulation area (CA) = regional and the experience (EXP) = (16-20 years), then N_A (non-accident).
d) If…and so on.
herefore, RS model 2 can be read in the same way.
he comparison between classiication accuracies of both models shows that the BM level variable increases the classiication rate by 2.5%. his result is in line with Bousoño et al. (2008). he inclusion of another variable (BM) implies a 7.7% increase in the number of variables to an increase of 2.5% in the classiication, calling into question the value of including the BM variable. hese results are also in line with Hey (1985), since the BMS do not improve to a great extent the explanation of ‘hidden factors’. In fact, psychological research show critical variables such as risk aversion, personality or stress referring to traic incidents.
here are also empirical studies which show that males were twice as likely to have reported at least one crash as a driver compared to females and nearly three times as likely to have reported two or more crashes. Additionally, drivers aged 17-29 were twice as likely to have reported at least one crash when compared to those aged over 50 years (Glendo, Dorn, Davies, Matthews, & Taylor, 1996). Taking into account these results, two of risk factors measured for the insurance companies are age and gender. However, when risk-taking behaviors were introduced into the model, males or 17-29 year olds being involved in at least one crash substantially reduced (Turner & McClure, 2003). On the other hand, personality is a very
important variable in car incident prediction (Schwebel, Severson, Ball, & Rizzo, 2006). Aggression, traditionalism, and alienation were the most frequent personality scales associated with risky driving behavior and crash risk. Above all, high levels of aggression predict that a driver could be involved in a crash (Gulliver & Begg, 2007). Finally, driver stress is correlated with accident involvement as well. Moreover stress is also linked with other variables that could be correlated to accidents like frequency of daily hassles and aggressiveness, poorer self-rated attention or mood states (Matthews, Dorn, & Glendon, 1991). It seems unlikely that the importance of all these variables can be captured by the 2.5% increase in classiication accuracy attributable to BM in the model.
With this in mind, due to these positive results in terms of classiication, the decision rules set can be interpreted accordingly. Taking into consideration the strongest ones, the following results are found for both models:
a) In tables 4 and 5, there are more rules for the non-accident class than for accident class (Table 4 N_A rules 12- A rules 7; Table 5 N_A rules 13- A rules 7). A few rules facilitate their interpretation because the model is more compact and it is possible to be more concrete. herefore it is easier to draw some standards for car accidents than for the other class.
b) All the rules are deterministic. his means that both classes are well discriminated amongst each other. The number of attributes in the rules varies from 2 to 7. In some rules, the explanation model could be deined using only 2 risk factors. c) The most relevant risk factors (which
majority of the rules that belong to class A (accident) in both models. On the contrary, this variable takes on the value ‘urban’ for the majority of rules referring to class N_A (non-accident). his fact shows that the majority of reported accidents, also probably the most serious ones, occurred in the interurban circulation area. Referring to the BM level, this is assigned by the company based on past experience. he rules show that the best two levels (1 and 2) are assigned to non-accident class. his inding conirms that the company is correctly assigning the bonus levels. his is especially important given that BM level is a key variable in the premium calculation.
a) he vehicle use risk factor does not appear in the RS model 2, whilst in the RS model 1 it only appears in one rule. his fact show that the use of the vehicle is not a determining factor but it cannot be eliminated because it belongs to the core. b) he gender risk factor appears just in four
rules that belong to both classes in both models. herefore no conclusions referring with that variable can be drawn.
6 C O N C L U S I O N S A N D F U T U R E RESEARCH
he objective of this paper was to test the validity of using ‘bonus-malus’ (BM) levels to classify policyholders satisfactorily. In order to show this empirical evidence a novel method in insurance, Rough Set theory has been employed. According to the data, the empirical evidence shows that the common risk factors employed by the insurance company are good explanatory variables for classifying car policyholders’ policies.
Furthermore, the BM level variable increases the explanatory power of the a priori risks factors. he diferences of the model with and without BM level are not very notable. In fact, the empirical evidence in the sample shows that the BM level risk factor explanation power is
too small (at only 2.5%). However, the referring literature consulted inds that there are many important factors that cannot be taken into account a priori. It is considered that these ‘hidden characteristics’ are partly revealed by the number of claims reported by the policyholders; that is, the BM level. Indeed, as it has been mentioned, there are many relevant factors to predict dangerous driver behavior as drivers’ personality, risk-taking or stress (among others) that automobile sector should be taken into account.
To increase the prediction capacity of BM level, psychological questionnaires could be used to measure ‘hidden characteristics’. Concretely, in Spain drivers need to renew their driving licence at regular periods. his requires a medical examination that guarantees the physical conditions to drive and it could also be used to test the psychological factors mentioned above using, for instance, the ‘Driving Behavior Inventory’ for driving stress (Gulian, Matthews, Glendon, Davies, & Debney, 1989); the ‘NEO-FFI’ for personality (Costa & McCrae, 1992); the ‘Zuckerman-Kuhlman ive-factor’ (Zuckerman & Kuhlman, 2000) for risk-taking referring with personality or a new simple questionnaire using a mix of traditional questionnaires. Another suggestion would be to take into account the ‘points-based driving licence system’ used in some European countries such as UK, Germany, France, Italy, Ireland, Luxembourg or Spain as a proxy to improve the BM level classiication. here are also cultural factors that could afect the study (Nordfaern, Simsekoglu, & Rundmo, 2012), for instance if drivers pay more attention on written information and sounds in road traic or on oral and visual traic information. Another important variable is if drivers are more or less fatalistic. herefore, more studies are required to generalize the obtained results.
NOTA
María-Jesús Segovia-Vargas / María-del-Mar Camacho-Miñano / David Pascual-Ezama
REFERENCES
Åberg, L., & Rimmö, P. A. (1998). Dimensions of aberrant driver behavior. Ergonomics, 41(1), 39-56.
Ahn, B. S., Cho, S. S., & Kim, C. Y. (2000). he integrated methodology rough set theory and artiicial neural network for business failure prediction. Expert Systems with Applications, 18(2), 65-74.
Arvidsson, S. (2010). Does private information affect the insurance risk? Working paper, The Geneva Association, 396, 2010. Retrieved from http://www.transportportal.se/SWoPEc/Essay_1_ Arvidsson_Does_private_information.pdf
Bazan, J., Nguyen, H. S., Nguyen, S. H., Synak, P., & Wróblewski, J. (2000). Rough set algorithms in classification problem. In L. Polkowski, S. Tsumoto, & T. Y. Lin (Eds.), Rough set methods and applications (pp. 49-88). New York: Physica-Verlag.
Beynon, M. J., & Peel, M. J. (2001). Variable precision rough set theory and data discrimination: An application to corporate failure prediction. OMEGA: he International Journal of Management Science, 29(6), 561-576.
Bousoño, C., Heras, A., & Tolmos, P. (2008). Factores de riesgo y cálculo de primas mediante técnicas de aprendizaje. Madrid, España: Ed. MAPFRE.
Brockett P., Cooper, W., Golden, L., & Pitaktong, U. (1994). A neural network method for obtaining an early warning of insurer insolvency. he Journal of Risk and Insurance, 61(3), 402-424.
Brockett, P., Golden, L., Jang, J., & Yang.C. (2006). A comparison of neural network, statistical methods, and variable choice for life insurers’ inancial distress prediction. he Journal of Risk and Insurance, 73(3), 397-419.
Costa, P. T., & McCrae, R. R. (1992). NEO PI-R professional manual. Odessa, FL: Psychological Assessment Resources.
D’Arcy, S. (2005). Predictive modeling in automobile insurance: A preliminary analysis. [Working Paper, 302]. World Risk and Insurance Economics Congress, August, Salt Lake City. Retrieved from http://business.illinois.edu/ ormir/Predictive%20Modeling%20in%20 Automobile%20Insurance%207-1-05(PDF).pdf
Denuit, M., Maréchal, X., Pitrebois, S., & Walhin, J. F. (2007). Index, in actuarial modeling of claim counts: Risk classiication, credibility and bonus-malus systems. Chichester, UK: John Wiley & Sons.
Díaz, Z., Segovia, M. J., Fernández, J., & Pozo, E. Machine learning and statistical techniques: An application to the prediction of insolvency in Spanish non-life insurance companies. (2005). he International Journal of Digital Accounting Research, 5(9), 1-45. Retrieved from http://www. uhu.es/ijdar/10.4192/1577-8517-v5_1.pdf
Dimitras, A., Slowinski, R., Susmaga, R., & Zopounidis, C. (1999). Business failure prediction using Rough Sets. European Journal of Operational Research, 114(2), 263-280.
Dionne, G., & Ghali, O. (2005). he bonus-malus system in Tunisia: An empirical Evaluation. Journal of Risk and Insurance, 72(4), 609-633.
Ebanks, B., Karwowski, W., & Ostaszewski, K. (1992). Application of measures of fuzziness to risk classiication in insurance. Paper presented at Forth International Conference on Computing and Information ICCI’92, Toronto.
For ward, S. (2008). Driving violations: Investigating forms of irrational rationality. Uppsala: Universitetsbiblioteket. Retrieved from http://uu.diva-portal.org/smash/get/ diva2:172720/FULLTEXT01
Goh, C., & Law, R. (2003). Incorporating the rough sets theory into travel demand analysis. Tourism Management, 24(5), 511-517.
Greco, S., Matarazzo, B., & Slowinski, R. (1998). A new rough set approach to evaluation of bankruptcy risk. In C. Zopounidis (Ed.), New operational tools in the management of inancial risks (pp. 121-136). Dordrecht: Kluwer Academic Publishers.
Greco, S., Matarazzo, B., & Slowinski, R. (2001). Rough sets theory for multicriteria decision analysis. European Journal of Operational Research, 129(1), 1-47.
Gulian, E., Matthews, G., Glendon, A. I., Davies, D. R., & Debney, L. M. (1989). Dimensions of driver stress. Ergonomics, 32(6), 585-602.
Gulliver, P., & Begg, D. (2007). Personality factors as predictors of persistent risky driving behavior and crash involvement among young adults. Injury Prevention, 13(6) 376-381.
Heras, A., Vilar, J. L., & Gil, J. A. (2002). Asymptotic fairness of Bonus- Malus systems and Optimal scales premiums. he Geneva Papers on risk and Insurance heory, 27(1), 61-82.
Hey, J. (1985). No claim bonus? he Geneva Papers on risk and Insurance, 10(36), 209-228.
Horgby, P.-J. (1998). Risk classiication by fuzzy inference. he Geneva Papers on Risk and Insurance heory, 23(1), 63-82.
International Monetary Fund. (2011). World economic outlook database. Retrieved from www. imf.org
Iversen, H. (2004). Risk-taking attitudes and risky driving behavior. Transportation Research Part F, 7(3), 135-150.
Johnson, J. (2006). Can complexity help us better understand risk? Risk Management, 8(4), 227-267.
Kramer, B. (1997). N.E.W.S.: A model for the evaluation of non-life insurance companies.
European Journal of Operational Research, 98(2), 419-430.
Laitinen, E. K. (1992). Prediction of failure of a newly founded irm. Journal of Business Venturing, 7(4), 323-340.
Lemaire, J. (1988). A comparative analysis of most European and Japanese Bonus-malus Systems. Journal of Risk and Insurance, 55(4), 660-681.
Lemaire, J. (1990). Fuzzy insurance. ASTIN Bulletin, 20(1), 33-55.
Lemaire, J. (1995). Bonus-malus systems in automobile insurance. Boston: Kluwert Academic Publisher.
Martinez de Lejarza Esparducer, I. (1996, September). Forecasting company failure: Neural approach versus discriminant analysis: An application to Spanish insurance companies of the 80´s. International Conference on Artiicial Intelligence in Accounting, Finance and Tax, Punta Umbria (Huelva), Spain, 2.
Matthews, G., Dorn, L., & Glendon, A. (1991). Personality correlates of driver stress. Personality and Individual Diferences, 12(6), 535-549.
McKee, T. (2000). Developing a bankruptcy prediction model via rough sets theory. International Journal of Intelligent Systems in Accounting, Finance and Management, 14(3), 159-173.
Nordjaern, T., Simsekoglu, O., & Rundmo, T. (2012). A comparison of road traic culture, risk assessment and speeding predictors between Norway and Turkey. Risk Management, 14(3), 202-221.
Nurmi, H., Kacprzyk, J., & Fedrizzi, M. (1996). Probabilistic, fuzzy and rough concepts in social choice. European Journal of Operational Research, 95(2), 264-277.
María-Jesús Segovia-Vargas / María-del-Mar Camacho-Miñano / David Pascual-Ezama
insurance maturity or national culture? Evidence from Asia. he Geneva Papers, 35(S1), 7-27.
Pawlak, Z. (1991). Rough sets: heoretical aspects of reasoning about data. Dordrecht: Kluwert Academic Publishers.
Pawlak, Z., Grzymala-Busse, J., Slowinski, R., & Ziarko, W. (1995). Rough Sets. Communications of the ACM, 38(11), 89-97. Retrieved from http:// dl.acm.org/ft_gateway.cfm?id=277421&ftid=1 7537&dwn=1&CFID=220789019&CFTOK EN=72446287
Pitrebois, S., Denuit, M., & Walhin, J.F. (2006). Multi-event Bonus-malus scales. he Journal of Risk and Insurance, 73(3) 517-528.
PwC. (2012). The five keys to the industry. Retrieved from http://www.pwc.es/en/inanciero-seguros/claves-sector-seguros.jhtml
Resende, P. C., Jr., & Guimãres, T. (2012). Inovação em serviços: O estado da arte e uma proposta de agenda de pesquisa. Revista Brasileira de Gestão de Negócios, 14(44), 293-313.
Richadeau, D. (1999). Automobile insurance contracts and risk of accident: An empirical test using French individual data. he Geneva Papers on Risk and Insurance heory, 24(1), 97-114.
Salcedo Sanz, S., Fernández Villacañas, J. L., Segovia Vargas M. J., & Bousoño Calzón, C. (2005). Genetic programming for the prediction of insolvency in non-life insurance companies. Computers and Operations Research, 32(4), 749-765.
Salcedo Sanz, S., Prado Cumplido, M., Segovia Vargas, M. J., Perez Cruz, F., & Bousoño Calzón, C. (2004). Feature selection methods involving Support Vector Machines for prediction of insolvency in non-life insurance companies. Intelligent Systems in Accounting, Finance and Management, 12(4), 261-281.
Sanchís, A., Segovia, M. J., Gil, J. A., Heras, A., & Vilar, J. L. (2007). Rough Sets and
the Role of Monetary Policy in Financial Stability (Macroeconomic Problem) and the Prediction of Insolvency in the Insurance Sector (Microeconomic Problem). European Journal of Operational Research, 181(3), 1554-1573.
Schwebel, D. C., Severson, J., Ball, K.K., & Rizzo, M. (2006). Individual diference factors in risky driving: The roles of anger/hostility, conscientiousness, and sensation-seeking. Accident Analysis and Prevention, 38(4), 801-810.
Segovia-González, M. M., Contreras, I., & Mar-Molinero, C. A. (2009). DEA analysis of risk, cost, and revenues in insurance. Journal of Operational Research Society, 60(11), 1483-1494.
Segovia-Vargas M. J., Salcedo-Sanz, S., & Bousoño-Calzón, C. (2004). Prediction of Insolvency in non-life insurance companies using support vector machines and genetic algorithms. Fuzzy Economic Review, 9(1), 79-94.
Slowinski, R., & Zopounidis, C. (1995). Application of the rough set approach to evaluation of bankruptcy risk. International Journal of Intelligent Systems in Accounting, Finance and Management,4(1), 27-41.
Shapiro, A. (2005). Fuzzy logic in insurance: the irst 20 years. Actuarial Research Clearing House, 39(1), 1-32. Retrieved from https:// w w w. s o a . o r g / Ne w s - a n d - Pu b l i c a t i o n s / Publications/Proceedings/Arch/pub-arch-table-of-contents-2005-1.aspx
Shen, Q., & Jensen, R. (2007). Rough sets, their extensions and applications. International Journal of Automation and Computing, 4(3), 217-228.
Shyng, J.-Y., Wang, F.-K., Tzeng, G.-H., & Wu, K.-S. (2007). Rough Set heory in analyzing the attributes of combination values for the insurance market. Expert Systems with Applications, 32(1), 56–64.
corretores de seguros. Revista Brasileira de Gestão de Negócios, 6(15),49-68.
Skowron, A., & Rauszer, C. M. (1992). The discernibility matrices and functions in information systems. In R. W. Slowinski (Ed.), Intelligent decision support (Chap. 2, pp. 331-362). Dordrecht: Kluwer Academic Publishers.
Spanish National Institute of Statistics (2015). Accidentes. Serie 2004-2012. Retrieved from http:// www.ine.es/jaxi/menu.do?type=pcaxis&path=/t10/ a109/a04/&ile=pcaxis
Turner, C., & McClure, R. (2003). Age and gender diferences in risk-taking behavior as an explanation for high incidence of motor vehicle crashes as a driver in young males. Injury Control and Safety Promotion, 10(3), 123-130.
Warsaw University. (2005). RSES 2.2 User’s Guide. Retrieved from http://logic.mimuw.edu.pl/~rses/ RSES_doc_eng.pdf
Wit, G. W. (1982). Underwriting and uncertainty. Insurance: Mathematics and Economics,1(4), 277-285.
Witlox, F., & Tindemans, H. (2004). The application of rough sets analysis in activity-based modeling, opportunities and constraints. Expert Systems with Application,27(4), 585-592.
Young, V. (1996). Insurance rate changing: A fuzzy logic approach. Journal of Risk and Insurance, 63(3), 461-484.