A vibrational spectroscopic study of the borate mineral takedaite
Ca
3
(BO
3
)
2
Ray L. Frost
a,⇑, Andrés López
a, Yunfei Xi
a, Leonardo M. Graça
b, Ricardo Scholz
baSchool of Chemistry, Physics and Mechanical Engineering, Science and Engineering Faculty, Queensland University of Technology, GPO Box 2434, Brisbane, Queensland 4001, Australia bGeology Department, School of Mines, Federal University of Ouro Preto, Campus Morro do Cruzeiro, Ouro Preto, MG 35400-00, Brazil
h i g h l i g h t s
We have studied the mineral takedaite Ca3(BO3)2.
A borate mineral of calcium using SEM with EDX and vibrational spectroscopy.
Chemical analysis shows a homogeneous phase, composed by Ca.
No Raman bands were observed in the OH stretching region. A very intense Raman band at
1087 cm 1is assigned to the BO
stretching vibration of BO3units.
g r a p h i c a l
a b s t r a c t
a r t i c l e
i n f o
Article history:
Received 20 February 2014
Received in revised form 28 May 2014 Accepted 3 June 2014
Available online 12 June 2014
Keywords:
Takedaite Borate Calcium
Raman spectroscopy Infrared spectroscopy
a b s t r a c t
We have studied the mineral takedaite Ca3(BO3)2, a borate mineral of calcium using SEM with EDX and
vibrational spectroscopy. Chemical analysis shows a homogeneous phase, composed of Ca. Boron was not detected. A very intense Raman band at 1087 cm1is assigned to the BO stretching vibration of BO
3units.
Additional Raman bands may be due to isotopic splitting. In the infrared spectrum, bands at 1218 cm 1
and at 1163, 1262 and 1295 cm1are assigned to the trigonal borate stretching modes. Raman bands at
712 and 715 cm 1are assigned to the in-plane bending modes of the BO
3units. Vibrational spectroscopy
enables aspects of the molecular structure of takedaite to be assessed.
Ó2014 Elsevier B.V. All rights reserved.
Introduction
The mineral takedaite Ca3(BO3)2is the borate mineral of
cal-cium[1]. It is one of several minerals found at Fuka, Okayama Pre-fecture, Japan[2]. Takedaite is a rare mineral probably formed by boron-rich fluids reacting between crystalline limestone and gehl-enite–spurrite skarns[3,4]. Crystal structure has been refined[5].
The mineral is hexagonal with Point Group: 3 2/m and Space
Group:R3/c. The unit cell parameters are:a= 8.638 Å,c= 11.85 Å,
Z= 6;V= 765.73 Å3. The boron isotope ratio (11B/10B) is used to
determine the geochemistry of boron minerals including hydrobo-racite[6–8]. This isotopic ratio may be reflected in the vibrational spectra providing the resolution of the spectrometers is sufficiently high.
Vibrational spectroscopy has been applied to borate glasses[9– 12]. However, the number of vibrational spectroscopic studies of borate minerals is few and far between. The number of vibrational spectroscopic studies of borate minerals is quite few and far between[13–16]. The number of Raman studies of borate minerals
http://dx.doi.org/10.1016/j.saa.2014.06.004
1386-1425/Ó2014 Elsevier B.V. All rights reserved.
⇑ Corresponding author. Tel.: +61 7 3138 2407; fax: +61 7 3138 1804.
E-mail address:[email protected](R.L. Frost).
Contents lists available atScienceDirect
Spectrochimica Acta Part A: Molecular and
Biomolecular Spectroscopy
is also very limited[17,18]. There have been a number of infrared studies of some natural borates[19–22]. Most of these references are not new and there have been no recent studies on the vibra-tional spectroscopy of natural borates. Ross in Farmer’s treatise reported the infrared spectra of several borate minerals[23]. There have been only a few infrared studies of hydroboracite
[19,22,24,25]and almost no studies of the Raman spectrum of tak-edaite[26]. There is some disagreement between researchers as to the position of some selected infrared bands. Moenke[27]and
Vlas-ova and Valyashko[25]show a band at 675 cm 1which was not
observed in the infrared spectrum of Weier[22]. These authors sim-ply reported the infrared data without any assignment of the bands. Vibrational spectroscopy has proven most useful for the study of borate minerals[28–31]. There are many calcium borate miner-als; many contain water and/or hydroxyl units in their structure. There is a vital need to study these calcium borate minerals using vibrational spectroscopy. In the authors view, there is an apparent lack of fundamental knowledge of borate mineral spectroscopy. The authors have made several studies of boron containing miner-als[32–35]. The objective of this research is to report the Raman and infrared spectra of takedaite and to relate the spectra to the molecular structure of the mineral. This is the first report of a sys-tematic study of takedaite from Fuka, Japan. It is important to understand the structure of takedaite in order to form nanomate-rials based upon its structure. Vibrational spectroscopy enables a better understanding of the structure of takedaite.
Experimental
Samples description and preparation
The takedaite sample studied in this work forms part of the col-lection of the Geology Department of the Federal University of Ouro Preto, Minas Gerais, Brazil, with sample code SAB-096. The sample is from the Fuka mine, located in the Okayama Prefecture, Japan. The studied sample occurs as a massive aggregate of micro-metric crystals.
The sample was prepared by using of a stereomicroscope Leica MZ4. The takedaite studied in this work occurs as a pure phase. Scanning electron microscopy (SEM) in the EDS mode was applied to support the mineral characterization.
Scanning electron microscopy (SEM)
Experiments and analyses involving electron microscopy were performed in the Center of Microscopy of the Universidade Federal
de Minas Gerais, Belo Horizonte, Minas Gerais, Brazil (http:// www.microscopia.ufmg.br).Takedaite crystals were coated with a 5 nm layer of evaporated carbon. Secondary Electron and Backscat-tering Electron images were obtained using a JEOL JSM-6360LV equipment. Qualitative and semi-quantitative chemical analyses in the EDS mode were performed with a ThermoNORAN spectrom-eter model Quest and were applied to support the mineral characterization.
Fig. 1.Backscattered electron image (BSI) of a takedaite fragment up to 2.0 mm in length.
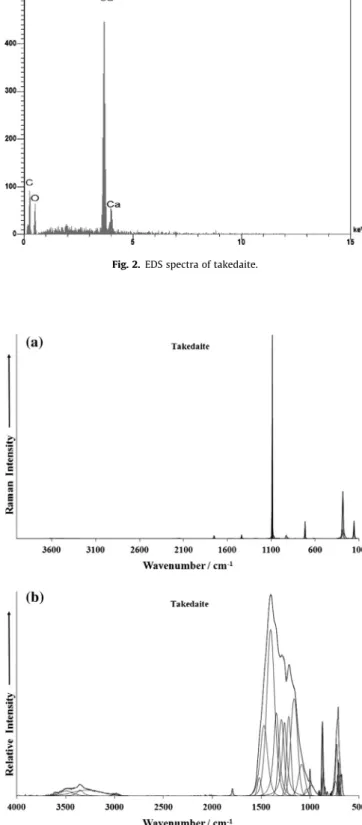
Fig. 2.EDS spectra of takedaite.
Fig. 3.(a) Raman spectrum of takedaite over the 100–4000 cm1spectral range. (b)
Raman microprobe spectroscopy
Crystals of takedaite were placed on a polished metal surface on the stage of an Olympus BHSM microscope, which is equipped with 10, 20, and 50objectives. The microscope is part of a
Reni-shaw 1000 Raman microscope system, which also includes a monochromator, a filter system and a CCD detector (1024 pixels). The Raman spectra were excited by a Spectra-Physics model 127 He–Ne laser producing highly polarized light at 633 nm and
col-lected at a nominal resolution of 2 cm 1 and a precision of
±1 cm 1in the range between 200 and 4000 cm 1. Repeated
acqui-sitions on the crystals using the highest magnification (50) were
accumulated to improve the signal to noise ratio of the spectra. Raman Spectra were calibrated using the 520.5 cm 1line of a
sili-con wafer. The Raman spectrum of at least 10 crystals was col-lected to ensure the consistency of the spectra.
Infrared spectroscopy
Infrared spectra were obtained using a Nicolet Nexus 870 FTIR spectrometer with a smart endurance single bounce diamond
ATR cell. Spectra over the 4000–525 cm 1 range were obtained
by the co-addition of 128 scans with a resolution of 4 cm 1and a
mirror velocity of 0.6329 cm/s. Spectra were co-added to improve the signal to noise ratio.
Spectral manipulation such as baseline correction/adjustment and smoothing were performed using the Spectracalc software package GRAMS (Galactic Industries Corporation, NH, USA). Band component analysis was undertaken using the Jandel ‘Peakfit’ soft-ware package that enabled the type of fitting function to be selected and allows specific parameters to be fixed or varied
accordingly. Band fitting was done using a Lorentzian–Gaussian cross-product function with the minimum number of component bands used for the fitting process. The Gaussian–Lorentzian ratio was maintained at values greater than 0.7 and fitting was under-taken until reproducible results were obtained with squared corre-lations ofr2greater than 0.995.
Results and discussion
Chemical characterization
The SEM image of the mineral sample takedaite studied in this work is shown inFig. 1. The image shows a takedaite microcrysta-line aggregate. Qualitative chemical analysis shows a homoge-neous phase, composed of Ca. Carbon was also observed and occurs due to C coating (Fig. 2). Boron was not detected as the atomic number is low.
Vibrational spectroscopy
The Raman spectrum of takedaite over the 100–4000 cm 1
spectral range is shown inFig. 3a. This spectrum shows the posi-tion and intensity of the Raman bands. The observed bands are very sharp. No intensity above 1700 cm 1is observed. The Raman
spectrum may be subdivided into sections based upon the type of vibration being analyzed. The infrared spectrum of takedaite over the 500–4000 cm 1spectral range is illustrated inFig. 3b. In
com-parison with the Raman spectrum the bands are broad and overlap. Now in the infrared spectrum, some intensity is observed in the 3000–4000 cm 1spectral range.
Fig. 4.(a) Raman spectrum of takedaite over the 800–1300 cm1spectral range. (b)
Infrared spectrum of takedaite over the 500–1600 cm 1spectral range. Fig. 5.(a) Raman spectrum of takedaite over the 300–800 cm
1spectral range. (b)
The Raman spectrum over the 800–1300 cm 1spectral range is
reported in Fig. 4a. The spectrum is dominated by an intense
Raman band at 1087 cm 1. This band is assigned to the BO
stretch-ing vibration of BO3units. Some low intensity shoulder bands are
noted at 1085 and 1091 cm 1. Iliev et al. determined the Raman
spectrum of a synthetic cobalt boracite[36]. The symmetry species of some vibrational modes were determined. Iliev et al.[37]used Raman imaging to show the ferroelectric properties of boracite type compounds. These workers[37]showed that boracites exhibit a sequence of transitions from the high temperature paraelectric cubic phase to ferroelectric orthorhombic, monoclinic, trigonal phases, and finally to a monoclinic phase at low temperatures where both ferroelectric and magnetic orders coexist. Kim and Somoano determined the improper ferroelectric transition using Raman spectroscopy[38].
In contrast, the infrared spectrum of boracite (Fig. 4b) shows complexity with many overlapping bands, making band attribution difficult. The intense infrared band at 1218 cm 1with shoulders at
1163, 1262 and 1295 cm 1 is assigned to the trigonal borate
stretching modes. The overlapping infrared bands are the infrared BO antisymmetric stretching vibrations. According to Ross [23]
(page 220 of this reference), bands between 1300 and 1500 cm 1
are due to the antisymmetric stretching modes of trigonal boron. This is perhaps confirmed by the intensity of the infrared bands
in the 1300–1500 cm 1 region. The series of bands from 600
through to 800 cm 1are related to trigonal borate bending modes.
Infrared bands are observed at 677, 694, 707, 712, 728, and
742 cm 1. The infrared bands at 1345, 1403 and 1472 cm 1 are
related to the out-of-plane OBO bending modes.
The Raman spectrum of takedaite over the 300–800 cm 1
spec-tral range is shown inFig. 5a. The Raman spectrum of takedaite over the 100–300 cm 1spectral range is shown inFig. 5b. Intense
Raman bands are observed at 712 and 715 cm 1and are assigned
to the in-plane bending modes of the BO3 units. A low intensity
Raman band is found at 585 cm 1. A very intense Raman band is
observed at 282 cm 1with shoulders at 276 and 287 cm 1. These
bands are attributed to CaO stretching vibrations. The Raman
bands at 154 and 159 cm 1 are simply described as lattice
vibrations.
The mineral takedaite has the formula Ca3(BO3)2and as such
contains no water or hydroxyl groups. The Raman spectrum of
tak-edaite over the 3000–3800 cm 1 spectral range is provided in
Fig. 6a. The spectrum is very noisy. Nevertheless, Raman bands may be resolved at 3350, 3509 and 3615 cm 1. The first two bands
are due to the stretching vibrations of water, whilst the Raman band at 3615 cm 1is due to the stretching vibrations of OH units.
It is suggested that we are picking up the spectrum of some other mineral. A number of possible minerals may be nominated namely colemanite, fabianite, gowerite and priceite. The infrared spectrum over the 2600–3800 cm 1spectral range is given inFig. 6b. As for
the Raman spectrum, the spectrum is very noisy and suffers from a lack of signal. Infrared bands may be resolved at 3280, 3353, 3492 and 3608 cm 1. The infrared spectrum bears a strong resemblance
to the Raman spectrum.
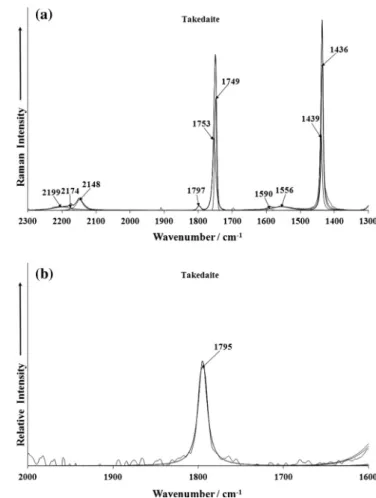
The Raman spectrum of takedaite over the 1300–2300 cm 1
spectral region is shown inFig. 7a. Two intense Raman bands are
found at 1436 and 1439 cm 1. These bands are assigned to the
antisymmetric stretching vibrations of trigonal boron. These bands
Fig. 6.(a) Raman spectrum of takedaite over the 3000–3800 cm 1spectral range.
(b) Infrared spectrum of takedaite over the 2600–3800 cm 1spectral range. Fig. 7.(a) Raman spectrum of takedaite over the 1300–2300 cm
1spectral range.
may be due to isotopic splitting. These bands are assigned to the antisymmetric stretching vibrations of trigonal boron[23](please see Table 11.VIII of this reference). Two low intensity Raman bands
are noted at 1556 and 1590 cm 1. Two intense Raman bands are
observed at 1749 and 1753 cm 1 with a shoulder band at
1797 cm 1. These bands are also attributed to the antisymmetric
stretching vibrations of trigonal boron[23]. In the case of the infra-red spectrum (Fig. 7b), only one infrared band at 1795 cm 1 is
observed. No water bending modes were found. Low intensity
Raman bands at 2148, 2174 and 2199 cm 1 are observed. These
bands may be associated with overtone or combination bands.
Conclusions
There are many borate minerals. Most are either hydrate or con-tain hydroxyl groups or both. Many of these minerals have never been analyzed using vibrational spectroscopy. In this instance, we have studied the anhydrous borate mineral takedaite. Chemical analysis shows a homogeneous phase, composed by Ca. Vibrational spectroscopy proves the absence of either water or hydroxyl units in the structure. The spectra are characterized by a trigonal borate
with intense Raman bands at 712, 715 and 1087 cm 1. Raman
spectroscopy allows the possibility of distinguishing takedaite from the other boron containing calcium minerals.
Acknowledgements
The financial and infra-structure support of the Discipline of Nanotechnology and Molecular Science, Science and Engineering Faculty of the Queensland University of Technology, is gratefully acknowledged. The Australian Research Council (ARC) is thanked for funding the instrumentation. The authors would like to acknowledge the Center of Microscopy at the Universidade Federal de Minas Gerais (http://www.microscopia.ufmg.br) for providing the equipment and technical support for experiments involving electron microscopy.
References
[1]I. Kusachi, C. Henmi, S. Kobayashi, Min. Mag. 59 (1995) 549–552.
[2]I. Kusachi, S. Kobayashi, C. Henmi, Y. Takechi, Kobutsugaku Zasshi 28 (1999) 41–46.
[3]S.M. Aleksandrov, Geokhimiya (2003) 492–512.
[4]S.M. Aleksandrov, M.A. Troneva, Geochem. Int. 50 (2012) 885–898. [5]A. Vegas, F.H. Cano, S. Garcia-Blanco, Acta Crystall. B31 (1975) 1416–1419. [6]S.V. Malinko, A.E. Lisitsyn, L.V. Sumin, Doklady Akad. 267 (1982) 453–456. [7]S.V. Malinko, A.E. Lisitsyn, L.V. Sumin, Sovetskaya Geol. (1987) 89–97. [8]M.R. Palmer, C. Helvaci, Geochim. Cosmochim. Acta 61 (1997) 3161–3169. [9]I. Ardelean, S. Cora, J. Mater. Sci. 19 (2008) 584–588.
[10] I. Ardelean, S. Cora, J. Optoelectron. Adv. Mater. 12 (2010) 239–243. [11]I. Ardelean, L. Griguta, J. Optoelectron. Adv. Mater. 9 (2007) 2068–2070. [12]I. Ardelean, V. Timar, J. Optoelectron. Adv. Mater. 10 (2008) 246–250. [13]M. Mir, J. Janczak, Y.P. Mascarenhas, J. Appl. Crystallogr. 39 (2006) 42–45. [14]I. Mitov, Z. Cherkezova-Zheleva, V. Mitrov, J. Balkan Trib. Assoc. 4 (1998) 191–
200.
[15]A.S. Povarennykh, E.I. Nefedov, Geol. Zh. 31 (1971) 13–27. [16]V.S. Suknev, E.N. Diman, Zh. Prikl. Spektrosk. 10 (1969) 326–328. [17] V.F. Ross, J.O. Edwards, Chem. Boron its Compd., 1967, pp. 15–207. [18]R.L. Frost, J. Raman Spectrosc. 42 (2011) 540–543.
[19]M.V. Akhmanova, Zh. Strukt. Khim. 3 (1962) 28–34.
[20] D.A. Long, R.T. Bailey, Spectrochim. Acta 19 (1963) 1607–1610. [21]A. Vasko, I. Srb, Czech. J. Phys. 17 (1967) 1110–1123. [22]C.E. Weir, J. Res. Nat. Bur. Stand. A70 (1966) 153–164.
[23]V.C. Farmer, Mineralogical Society Monograph 4: The Infrared Spectra of Minerals, Mineralogical society, London, 1974.
[24]M.G. Valyashko, E.V. Vlasova, Jena Rev. 14 (1969) 3–11.
[25]E.V. Vlasova, M.G. Valyashko, Zh. Neorgan. Khim. 11 (1966) 1539–1547. [26]X. Xie, F. Zha, Kuangwu Xuebao 13 (1993) 130–136.
[27]H. Moenke, Silikattechnik 13 (1962) 287–288.
[28]R.L. Frost, Y. Xi, R. Scholz, F.M. Belotti, M. Candido Filho, J. Mol. Struct. 1037 (2013) 23–28.
[29]R.L. Frost, R. Scholz, A. Lopez, Y. Xi, L.M. Graca, J. Mol. Struct. 1059 (2014) 20– 26.
[30] R.L. Frost, A. Lopez, Y. Xi, R.M.F. Lima, R. Scholz, A. Granja, Spectrochim. Acta A116 (2013) 160–164.
[31]R.L. Frost, Y. Xi, R. Scholz, Spectrochim. Acta A96 (2012) 946–951. [32]J.T. Kloprogge, R.L. Frost, Appl. Spectrosc. 53 (1999) 356–364. [33]R.L. Frost, Y. Xi, Spectrochim. Acta A96 (2012) 831–836. [34]R.L. Frost, Y. Xi, Spectrochim. Acta A 96 (2012) 89–94. [35]R.L. Frost, Y. Xi, Spectrochim. Acta A96 (2012) 611–616.
[36]M.N. Iliev, V.G. Hadjiev, M.E. Mendoza, J. Pascual, Phys. Rev. B76 (2007). 214112/214111-214112/214115.
[37]M.N. Iliev, V.G. Hadjiev, J. Iniguez, J. Pascual, Acta Phys. Pol. A116 (2009) 19– 24.